A backtest can look so good that the correct response is not excitement first. It is scrutiny.
A real edge should survive evidence it was not designed to impress.
Every backtest contains signal and noise. The challenge is that both a genuine market relationship and a curve-fit rule set can produce an excellent in-sample equity curve, high win rate, strong profit factor, and small historical drawdown. The sharper question is: Did the strategy discover something about the market—or did we discover the settings that best describe one historical dataset?
That question belongs inside The Setup because backtesting is not only about finding attractive historical results. It is about deciding how much confidence those results deserve before they influence risk. Overfitting does not make a backtest look bad; it is one reason a backtest can look unusually good.
What Overfitting Actually Means
Imagine being given yesterday's test answers and asked to design the perfect study guide. You could create something that scores 100% on yesterday's exam without understanding the subject well enough to answer tomorrow's questions. A curve-fit strategy can do the same thing with market history.
The developer keeps adjusting the lookback, threshold, stop, target, session, indicator, and filters until the historical result becomes exceptional. The final rules may explain the development sample beautifully while capturing random coincidences, favorable sequences, and quirks that do not persist. A curve-fit strategy explains the past better than it predicts unseen data.
Optimization Is Not the Problem
Almost every systematic rule requires choices, so parameters and optimization are not automatically suspicious. Optimization can help determine whether a broad range of settings behaves sensibly, where performance becomes unstable, and whether the economic idea responds as expected. The problem begins when historical performance becomes the main reason each precise parameter exists.
Optimization asks whether reasonable settings work. Overfitting asks which exact settings make the past look best. OPTIMIZATION ≠ OVERFITTING, just as complexity does not automatically prove curve fitting and simplicity does not automatically prove robustness.
Why the Number of Attempts Matters
Suppose one trader develops one clearly specified idea and tests it once, while another runs 10,000 variations and reports only the best result. Those two winning backtests carry very different evidentiary weight even if their headline performance is identical. The second process had thousands of opportunities to discover something that looked impressive by chance.
This is the multiple-testing problem in beginner language. If enough useless strategies are tested on the same history, some will eventually look profitable, smooth, and unusually convincing simply through randomness. The best result out of 1,000 attempts is not statistically equivalent to one idea tested once.
That is why the hidden research history matters. Forty-seven failed parameter sets, twelve discarded indicators, and six alternate exit rules are part of the evidence behind the final strategy even if they never appear in the presentation. Every hidden backtest is part of the statistical history of the backtest you chose to show.
Real Edge vs. Curve Fit
A more credible result usually has a reason to exist beyond “the backtest liked it.” The underlying hypothesis might involve behavioral overreaction, liquidity provision, trend persistence, risk transfer, or another plausible market mechanism. That does not prove the strategy is profitable, but it gives the rules an economic reason to be tested.
Curve-fit research often works backward. A historical loss appears, another filter is added, the equity curve improves, and the new rule survives because it repaired the past. One reasonable adjustment repeated twenty times can become an unreasonable amount of hindsight.
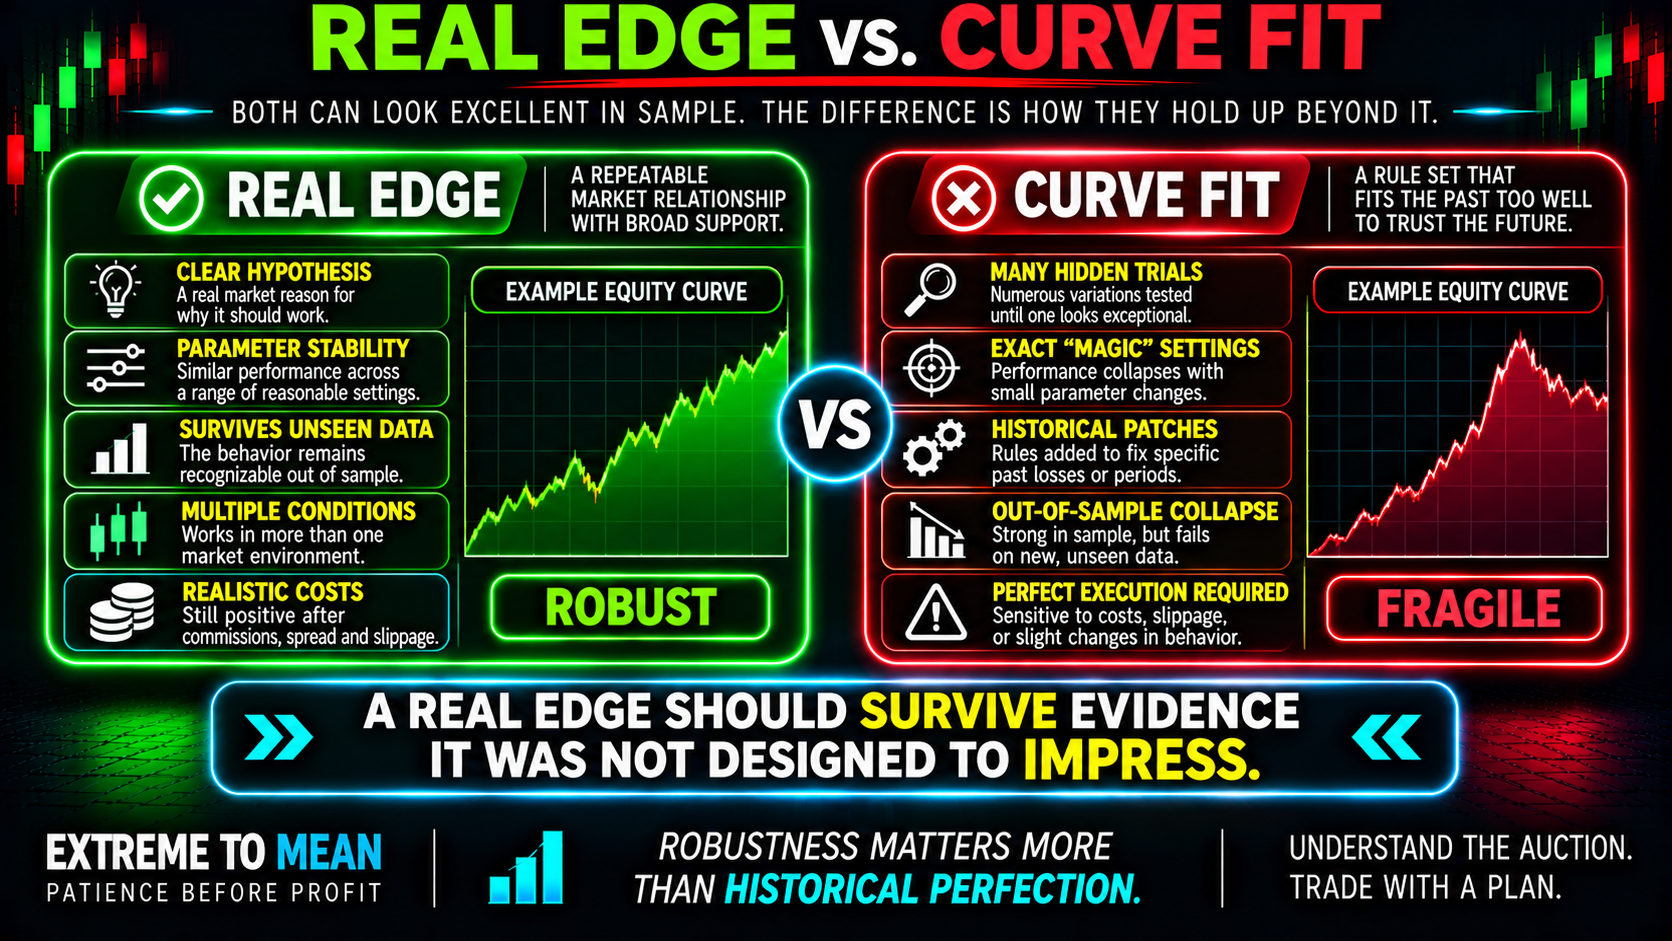
A cleaner research question is: Would I have created this rule without seeing the historical result it fixes? Rules should enter because the hypothesis requires them—not because one historical loss annoyed you. A backtest can show that something happened; it cannot by itself explain why it should keep happening.
Parameter Robustness: Look for a Plateau, Not a Needle
Suppose a mean-reversion strategy works reasonably well with lookbacks of 32, 34, 36, 38, and 40 periods. None is perfect, but the underlying behavior remains broadly recognizable across nearby choices. That is more reassuring than a strategy where 36 is poor, 37 is spectacular, and 38 is poor again.
A robust edge often lives on a hill. An overfit result often sits on a needle. The exact best setting matters less than whether nearby reasonable settings produce a similar economic story.
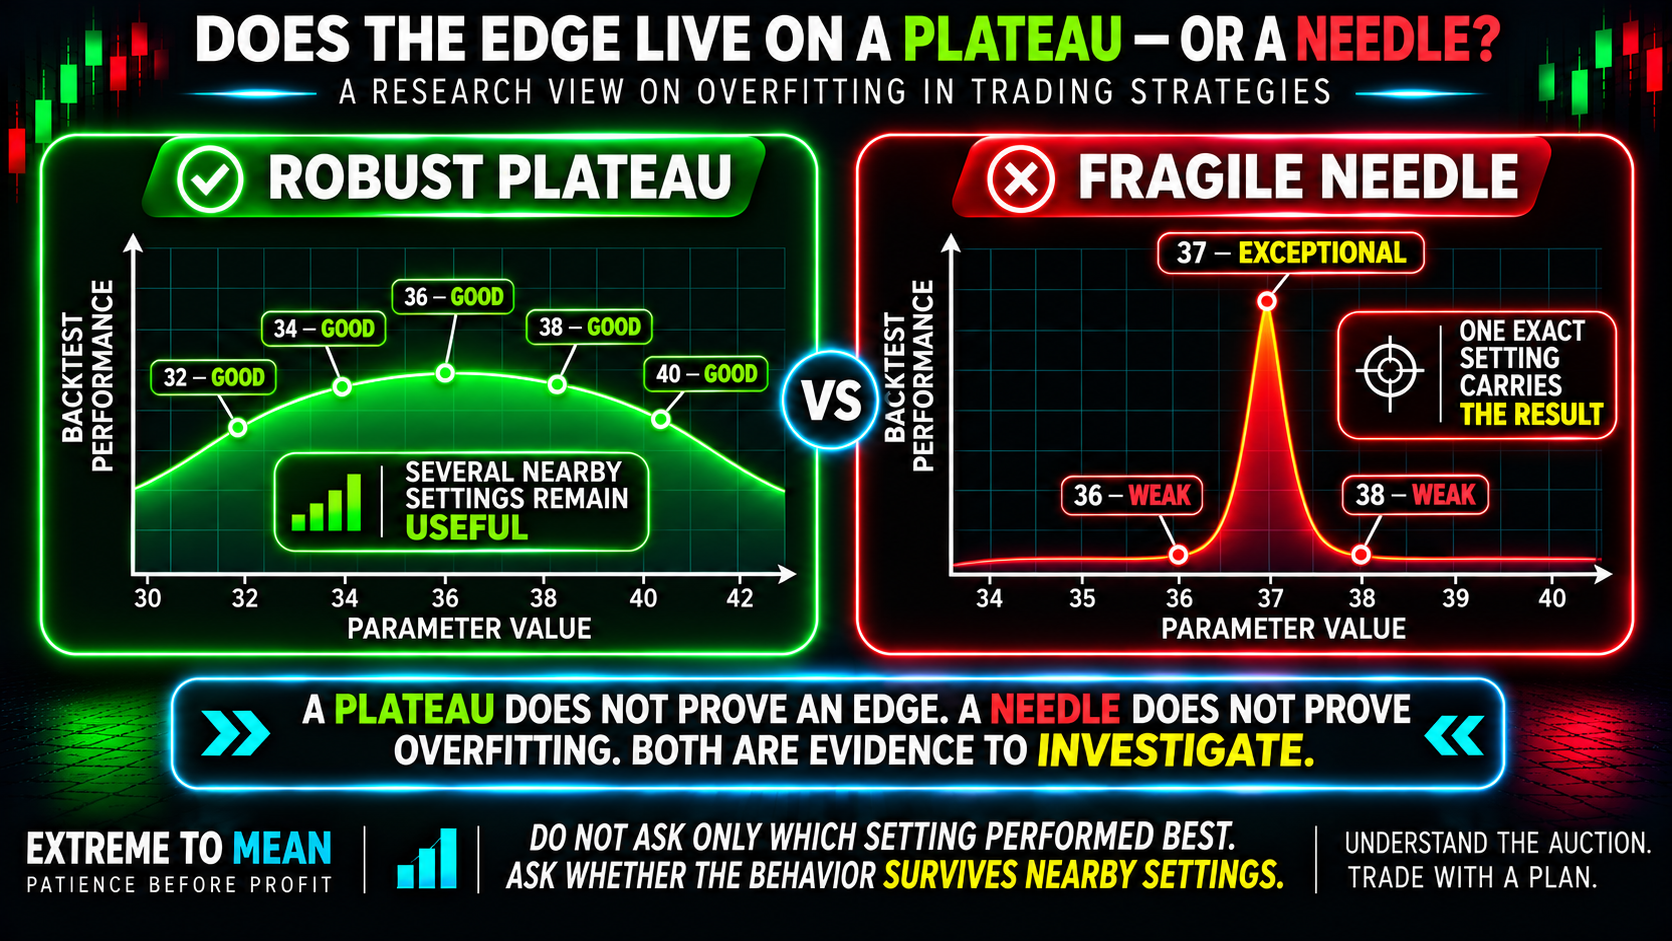
A plateau does not prove robustness, and a sharp optimum does not automatically prove overfitting. But extreme sensitivity deserves investigation because tiny changes in settings should have a plausible reason for producing huge changes in economics. If moving a threshold from 1.50 to 1.51 destroys the strategy, the settings may be carrying more of the performance than the idea itself.
Out-of-Sample Testing—and How Traders Contaminate It
In-sample data is the history used to design, adjust, and select the strategy. Out-of-sample data is deliberately withheld so the strategy can encounter information it was not built to fit. The first real test of a backtest begins where the optimization ends.
The problem is that holdout data can lose that status. A trader tests the strategy on 2025, sees failure, adds a volatility filter, changes the stop, and retests 2025 until the result looks good. The moment out-of-sample failure changes the model, that sample starts becoming training data.
Fresh data loses its innocence once it influences the model. The cleaner response is to reclassify contaminated data as development history and reserve genuinely untouched information for another test. A dataset cannot remain an exam after its answers have been used to rewrite the course.
Walk-forward testing can improve the research process by repeatedly learning from an earlier window and evaluating on a later unseen window. It still is not magic. If dozens of window lengths, retraining frequencies, or objectives are tested and only the best walk-forward version survives, selection bias simply reappears at a higher level.
Why 169 Trades Does Not Answer the Sample-Size Question
“Is 169 trades enough?” cannot be answered from the number 169 alone. Those trades might span ten years and several regimes, or they might come from one unusually favorable month with highly correlated setups. The answer also depends on how many strategy versions were tried before those 169 observations were selected.
More trades can deepen a sample without broadening the evidence. A strategy with hundreds of trades from one strong bull market may still know very little about ranges, volatility contraction, volatility expansion, or different years. MORE TRADES ≠ MORE INDEPENDENT EVIDENCE.
Performance concentration matters too. A ten-year backtest can look diversified while 70% of the profit comes from one three-month period or a handful of exceptional trades. Dependence on a few trades is not automatic proof of curve fitting—some legitimate strategies are naturally positively skewed—but it is a concentration risk worth investigating.
Stress Costs, Execution and Market Conditions
A backtest can survive every statistical check and still depend on assumptions that live trading cannot reproduce. Add realistic commissions, fees, slippage, slightly worse entries, slightly worse exits, and other reasonable execution friction. An edge that exists only before realistic execution costs is not a tradable edge.
Stress also means asking whether the relationship survives different market environments. Market conditions change the quality of a setup, so evidence across trend, balance, higher volatility, and quieter periods is more informative than thousands of trades from one regime. A robust strategy should tolerate reality being a little less cooperative than the simulation.
This is also where context comes before the candle becomes a research principle rather than only a discretionary-trading principle. If nearly all historical profitability comes from one specific environment, that dependence should be understood rather than hidden inside the average. The question is not whether every regime must be profitable; it is whether the strategy's conditions are defined honestly.
Keep a Research Log of the Strategies That Failed
Most traders save the final strategy but not the search process that produced it. That makes the winner look cleaner than the research really was because failed hypotheses, discarded parameters, and rejected exits disappear from view. Keeping a research log makes selection visible.
Track the hypothesis, variants tested, parameter ranges, changes made, rejected ideas, and why each change occurred. The strategies that failed are part of the statistical history of the strategy that survived. This is especially important when the research process is iterative and the same dataset is repeatedly revisited.
The prettier the backtest, the more important it becomes to ask how much searching was required to produce it. An extraordinary equity curve may be genuine, but it has earned more verification—not less. A perfect-looking result should increase the burden of proof.
The Curve-Fit Warning Signs Checklist
Before trusting an optimized strategy, ask:
- How many strategies, parameter sets, filters, and exits did I actually try?
- Can I explain why each rule should exist without pointing only to improved historical P&L?
- Does performance remain reasonable across nearby parameter values?
- Does useful behavior survive genuinely unseen chronological data?
- Did I change the strategy after seeing those out-of-sample results?
- Does performance survive realistic costs and slightly worse execution?
- Is most of the profit concentrated in a few trades or one regime?
- Does the sample cover genuinely different market environments?
- Is the strategy becoming more complicated every time history disagrees with it?
- Would I have created this rule without seeing the historical loss it fixes?
The checklist is diagnostic, not a pass/fail score. There is no universal maximum parameter count, minimum trade count, or required in-sample/out-of-sample split that makes a strategy safe from overfitting. The job is to evaluate how much freedom the research process had to learn the accidents of the data.
The ETM Hypothesize → Build → Stress → Withhold → Verify Framework
Use HYPOTHESIZE → BUILD → STRESS → WITHHOLD → VERIFY. Start with a market behavior that has a plausible reason to exist, translate it into the simplest reasonable rules that express that hypothesis, and stress parameters, costs, execution assumptions, and market environments. Then protect genuinely unseen data from the development process.
Finally, verify whether useful behavior persists beyond the information used to design the strategy. The possible decisions are KEEP / SIMPLIFY / RETEST / REJECT. A strategy earns trust by surviving tests it was not optimized to pass.
The ETM free tools can support structured research and review, but the central discipline is preserving honest evidence. Validation should increase confidence in stages—not flip a strategy from “unproven” to “certain.” Out-of-sample success raises confidence; it does not eliminate uncertainty.
Final Thought
A great backtest is evidence worth investigating, not a verdict. Overfitting happens when the research process learns the accidents of historical data so well that the strategy looks exceptional in the past but cannot reproduce the same relationship on information it was never designed around. The danger grows when traders test many variations, select the winner, patch every historical weakness, and repeatedly reuse supposedly unseen data until something finally passes.
Look for evidence that is harder to manufacture: a plausible reason the edge should exist, reasonable performance across nearby settings, survival under realistic costs and slightly worse execution, behavior across different market environments, and useful results on genuinely untouched data. Keep the failed experiments as part of the research record. GOOD BACKTEST ≠ REAL EDGE, and OUT-OF-SAMPLE PASS ≠ PERMANENT PROOF.
Do not ask whether you found the perfect historical settings. Ask whether the underlying behavior remains recognizable when history stops cooperating. A real edge does not need to look perfect; it needs to remain useful when the test becomes less familiar.
Educational content only. Trading involves substantial risk and is not suitable for everyone.