
Halfway Is Not Automatically Value
A range high and low tell us the boundaries of observed price travel. Once those two points are defined, the midpoint is easy: add the high and low and divide by two. That tells us exactly where the boundaries balance mathematically, but nothing about how the market actually used the space between them.
That difference matters throughout the Market curriculum. A market can touch one end of a range for seconds, spend hours near the other end, and still produce the same midpoint as a market that rotated evenly around the center. Halfway between the high and low is always the midpoint; it is not automatically where the market found value.
What We Mean by Fair Value Here
The phrase “fair value” needs care because it can mean very different things in finance. In this article, it does not mean an analyst's estimate of intrinsic economic worth, nor does it mean that one price is objectively correct. We are using it as trading shorthand for an area where the current auction appears relatively willing to conduct sustained two-sided business.
That makes fair value an inference rather than a simple calculation. We look for evidence such as repeated trade, time spent in an area, volume concentration, rotation, failed attempts to leave, and developing market references. The market can change, so the area we describe as accepted value can change with it.
The Midpoint Is Exact. Value Must Be Inferred.
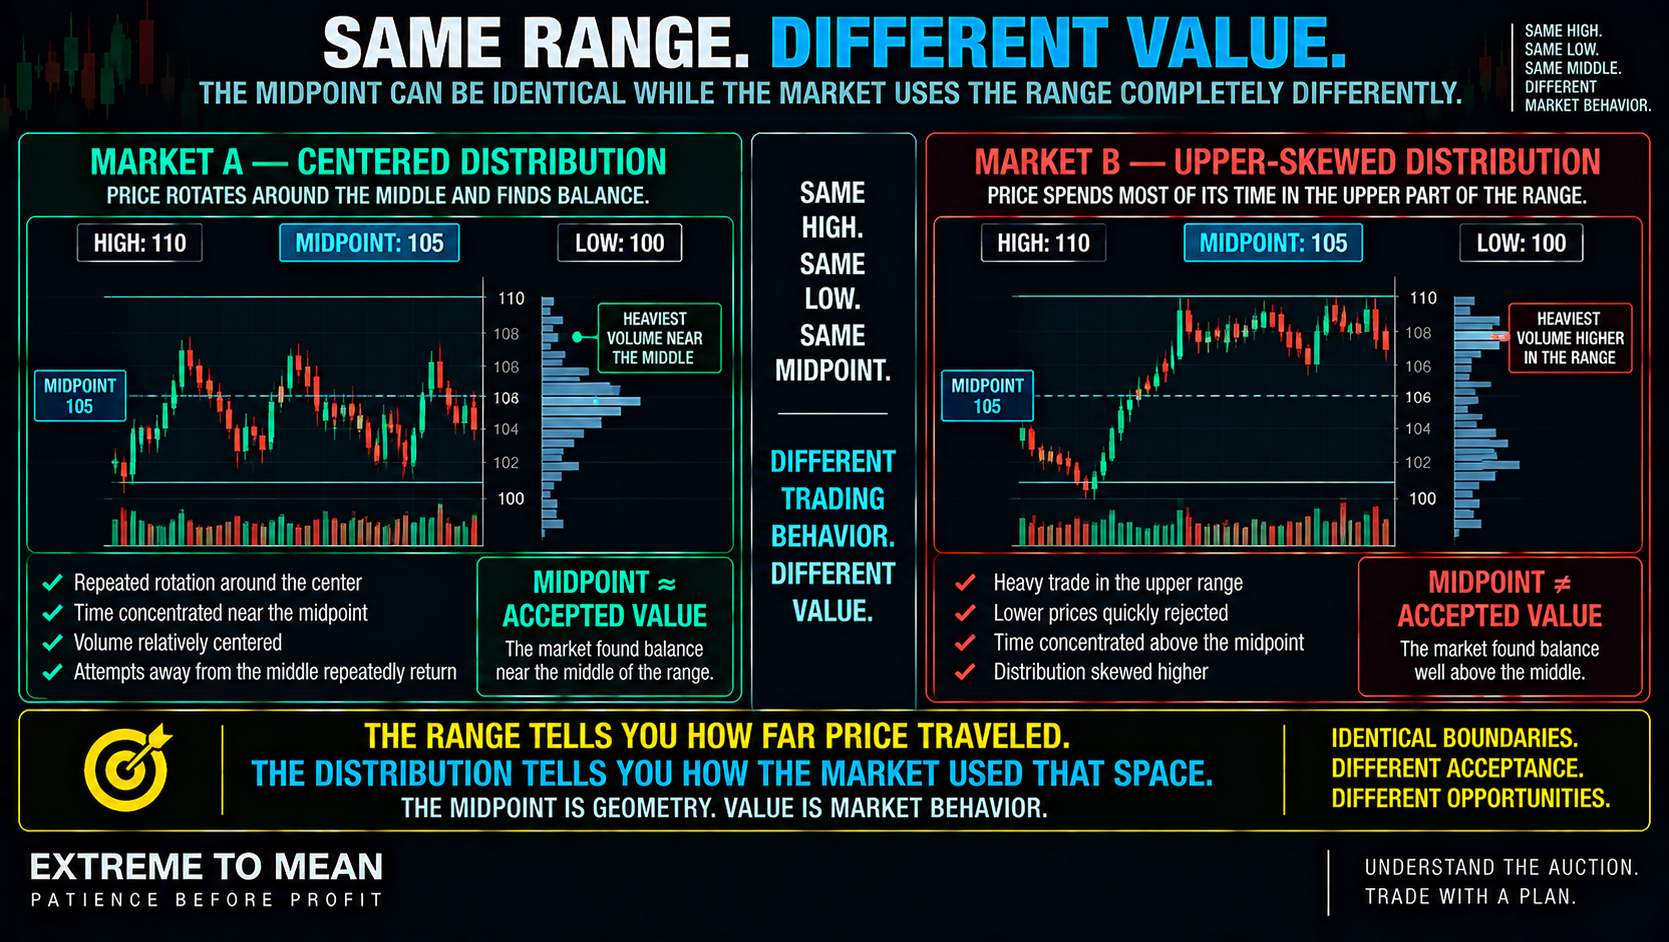
Consider two sessions with the same high at 5,100 and the same low at 5,000. Session A rotates heavily between 5,040 and 5,060, while Session B spends most of its time between 5,075 and 5,095 after briefly rejecting the lower half. Both sessions have a midpoint of 5,050, but their internal distributions are clearly different.
The range tells us how far price traveled. The distribution tells us where the market actually stayed, and that difference is what the midpoint cannot capture by itself. A rectangle around the range makes every price inside it look equally important even when the market treated those prices very differently.
Time and Volume Add Information the Midpoint Ignores
A price the market touches is not the same as a price the market accepts. If price repeatedly returns to an area and remains there, the market is showing a greater willingness to facilitate business around those prices than around an area touched once and immediately rejected. Time at price is not a perfect definition of value, but it adds information that simple high-low geometry does not contain.
Volume at price adds another perspective because it shows where transactions actually concentrated. A high-volume area can be useful evidence that the market conducted significant business there, while a thinly traded area may have been passed through quickly. That does not make the highest-volume price the one true fair value; it tells us something about how the auction distributed activity.
POC, VWAP, Midpoint, and Mean Are Different Objects
Point of Control identifies the price with the highest traded volume inside a selected profile. VWAP is a volume-weighted average transaction price over a defined window, while a range midpoint is simply the halfway point between two chosen boundaries. A moving average, median, Value Area, and other central references use still different definitions.
If those tools produce different centers, one of them is not necessarily broken. They may be measuring different aspects of balance, and the trader's job is to understand what each reference represents rather than hold a vote to decide which one is “real.” Center is not one universal calculation.
This is also why what the mean really is is an important foundation. The relevant question is not whether every central reference agrees to the tick, but whether the reference being used matches the market behavior and trade horizon the strategy is trying to understand. A reference earns usefulness from its role, not from the word “mean” or “value” attached to it.
Value Is Usually an Area, Not One Perfect Tick
Markets do not need one precise price to be balanced. Buyers and sellers can repeatedly conduct business across a zone, with price rotating through that area while volume and time accumulate. Even precise plotted values such as VWAP or POC should be interpreted in context rather than treated as magical prices that must hold.
That is why a market can have a range from 100 to 110, a midpoint at 105, and most accepted activity between 107.50 and 109. The distribution is upper-skewed even though the range itself remains geometrically symmetrical. A balanced auction does not require a perfectly centered distribution.
The Midpoint Can Still Matter
The point is not that the midpoint is useless. Traders may watch it, price may respond around it, and in a genuinely symmetrical range it may sit close to other accepted-value references. The midpoint becomes more interesting when the market behaves as though it matters.
That last condition is important because geometry should not be granted authority before behavior confirms it. If price repeatedly rotates through the midpoint, volume is relatively centered, and other references cluster nearby, the middle may be a useful approximation of the accepted center. The conclusion came from the market's behavior, not from arithmetic alone.
Value Can Move While the Midpoint Stays Still
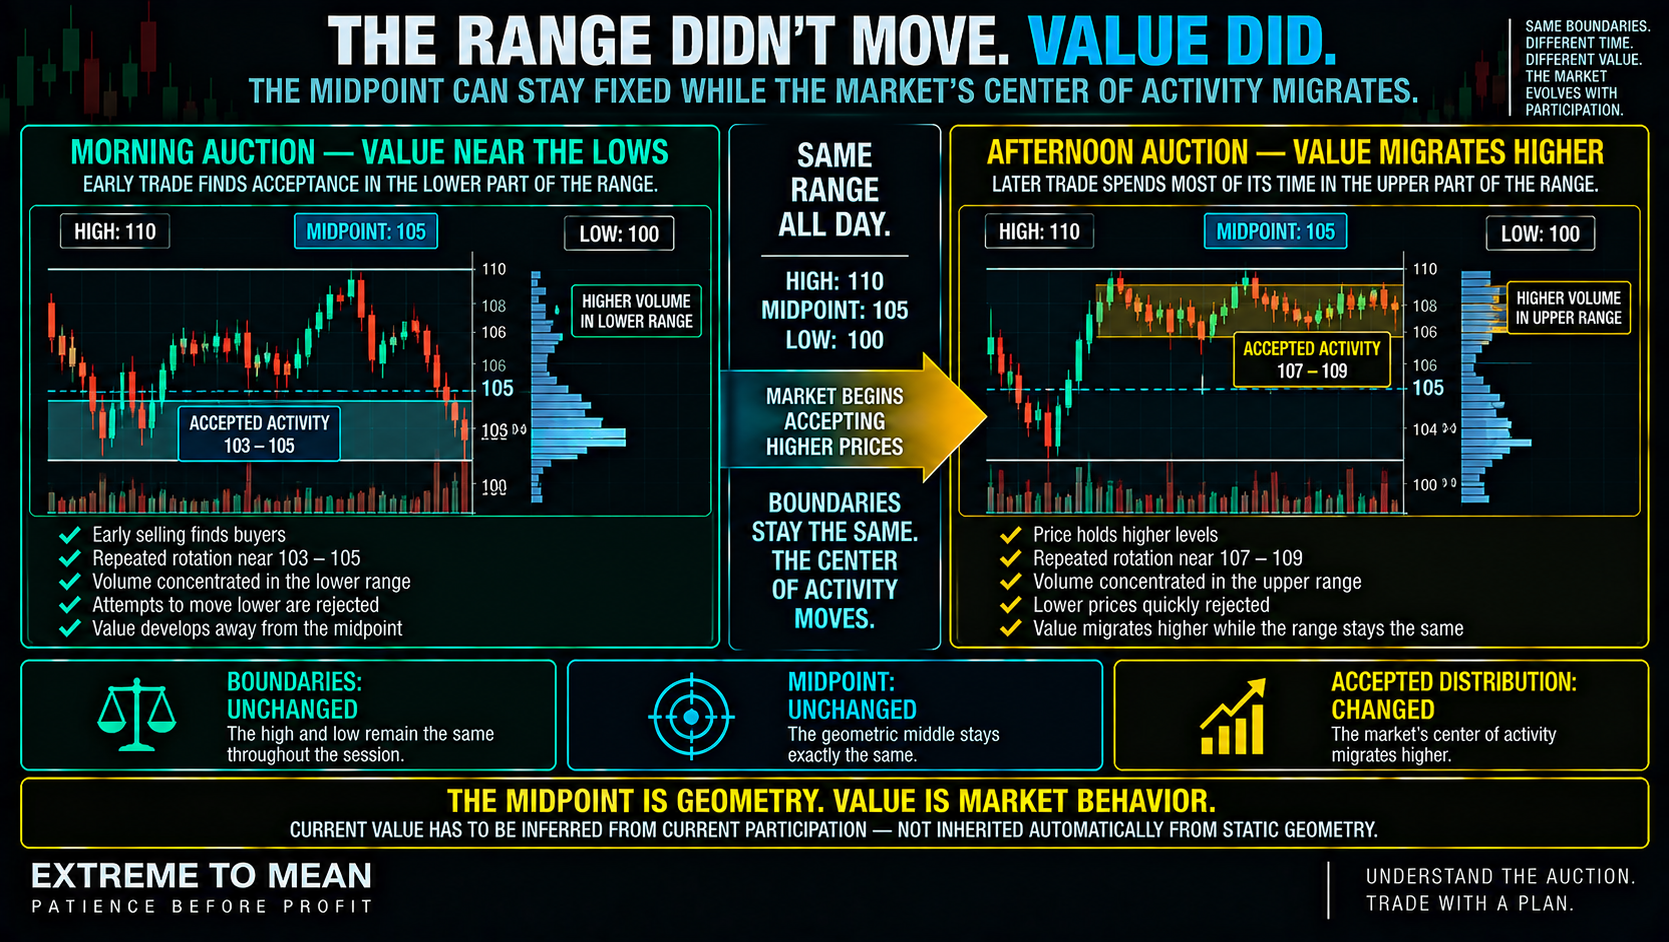
Imagine a range remains fixed between 100 and 110 all day. Morning trade concentrates near 103–105, but after a successful move higher the afternoon spends hours rotating between 107 and 109. The range midpoint remains 105 even though the center of actual activity has migrated upward.
The boundaries can stay still while the center of activity moves. VWAP may rise, a developing POC may shift, and the distribution of volume and time may become increasingly concentrated in the upper portion of the same range. The midpoint remains mathematically correct while answering an increasingly less useful question about current acceptance.
One Outlier Can Move the Midpoint Without Moving Value
Suppose a market spends most of the morning rotating between 100 and 110, then a fast news spike reaches 120 and immediately fails. The visible range midpoint jumps from 105 to 110 even though trading quickly returns to the prior accepted area. The midpoint changed because one boundary moved, not because the market necessarily accepted a new center.
That distinction matters because high-low arithmetic is extremely sensitive to the selected extremes. A brief wick can change the middle mechanically while contributing very little to where the market ultimately conducts business. Value should require evidence that the market accepted the change, not merely evidence that price briefly traveled there.
Acceptance and Rejection Matter More Than Symmetry
When price enters an area, trades there repeatedly, survives pullbacks, accumulates meaningful activity, and keeps returning, that behavior is more consistent with acceptance. When price enters an area and quickly leaves, cannot sustain trade, or repeatedly fails to remain there, the market is showing more rejection. Value should be inferred from acceptance, not from visual symmetry.
This is also why trading through a price is not the same as building value there. Price can race through dozens of levels during a directional move without spending enough time or activity to make those levels central to the current auction. Sometimes it is easier to identify where the market refuses to stay than to declare one perfect fair-value price.
The Middle and Value Perform Different Trading Jobs
Accepted value can be a useful reference while still being a poor place to initiate certain directional trades. When price is rotating around a well-accepted center, buyer-seller agreement may be relatively high, nearby boundaries can reduce target room, and repeated reversals can create the kind of chop discussed in why the middle is where good traders get chopped up. A useful reference point is not automatically a useful entry point.
For a mean-reversion trader, the extreme and the center perform different jobs. The extreme asks whether meaningful separation and potential asymmetry exist, while the accepted center can help define what price may be reverting toward if the thesis works. The place price may revert toward is often the place where the reversion trade itself becomes less interesting.
That is also why room to revert remains a separate trade-quality question. Identifying a useful center does not tell us whether the current entry has enough distance, reasonable invalidation, or acceptable geometry to justify a trade. Market reference first; trade qualification second.
Above Value Does Not Mean Overpriced
Another dangerous shortcut is turning an auction reference into a directional rule. Price above VWAP, POC, a developing value area, or another accepted center does not automatically mean overpriced or short, just as price below it does not automatically mean cheap or long. During directional markets, both price and the accepted area can migrate together.
That distinction also keeps trading “value” separate from fundamental valuation. Saying ES is trading above an intraday accepted area is not the same claim as saying the S&P 500 is economically overvalued. The first describes price relative to an auction reference; the second requires a completely different valuation framework.
Value Is Horizon-Dependent
The same price can be near accepted intraday value while sitting far from a broader weekly center. It can also be the midpoint of today's range, the upper edge of the overnight range, and the lower edge of a larger balance at the same time. Any statement about middle or value therefore needs a defined window and a reason that window belongs to the trade.
This is where traders can accidentally create the answer they want. If the current midpoint does not support a thesis, changing the range boundaries until a new midpoint appears is not stronger analysis. If the range boundaries change because you dislike the midpoint, the midpoint is measuring your bias more than the market.
An Evidence Ladder for Value
A cleaner process begins with geometry but does not end there. Mark the midpoint for orientation, then study where price spent time, where volume accumulated, where rotation repeatedly occurred, which areas were accepted or rejected, and whether the center of activity is migrating. That moves the analysis from a neat rectangle toward observable market behavior.
The progression is Geometry → Time → Volume → Rotation → Acceptance → Migration. Those are not six bullish or bearish votes, and no single tool automatically owns the answer. They are layers of evidence that help the trader form and continually update a value hypothesis.
The ETM Fair-Value Framework
Use the midpoint for what it does well, then make the market earn every stronger conclusion. The purpose is not to locate one perfect fair-value tick, but to determine which area currently provides the most useful representation of balance for the trade being considered. Then keep that conclusion open to revision as the auction changes.
- Window — What range, session, swing, or balance are you analyzing?
- Midpoint — Where is the exact geometric center?
- Distribution — How did the market actually use the space inside the range?
- Time — Where did price repeatedly remain?
- Volume — Where did meaningful business accumulate?
- Rotation — Which areas did price keep revisiting?
- Acceptance — Where could price remain, and where was it quickly rejected?
- References — Where are VWAP, POC, midpoint, and other strategy-relevant centers relative to one another?
- Migration — Is the accepted area stable, moving higher, or moving lower?
- Role — Is value serving as context, a possible target, or another defined function in the strategy?
- Trade context — Is price extended away from value, rotating inside it, or building a new accepted area?
- Decision — Does the actual setup qualify after that context is understood?
The condensed framework is Range → Midpoint → Distribution → Acceptance → Value → Migration → Trade Context. The better question is no longer, “Where is the middle?” It is, “Where is this market actually accepting price, what evidence supports that conclusion, and is that accepted area stable or moving?”
Final Thought
The midpoint is simple arithmetic, and that simplicity is useful. It tells us the exact halfway point between two defined boundaries, but it cannot tell us how the market behaved inside those boundaries. The middle can be mathematically correct and behaviorally unimportant at the same time.
Fair value, as we are using the term here, is more humble. It is an evolving judgment about where the market appears willing to conduct sustained business, built from time, volume, rotation, acceptance, rejection, and the movement of developing references. Value is an interpretation we update—not a verdict the chart announces.
Do not force symmetry onto a market that is showing an uneven distribution. Use the midpoint as orientation, not authority, and remember that reversion is not reversal any more than “above value” is automatically a short. Study where the market actually agrees to trade, then evaluate the opportunity through the broader Extreme to Mean system.
Educational content only. Trading involves substantial risk and is not suitable for everyone.