A strategy can work beautifully in backtesting, perform well live for months, and then begin losing. The uncomfortable part is that the equity curve tells you something changed in the results, but not what changed underneath them.
Diagnosis comes before modification.
A falling equity curve can look almost identical under three very different conditions. The strategy may be experiencing normal statistical drawdown, the market may have shifted into an environment where the strategy historically struggles, or the relationship the strategy exploited may genuinely be weakening.
That is why this lesson belongs inside The Setup. The better question is not simply, “Is my strategy broken?” It is: What changed—the results, the edge, or the environment?
Your Strategy Is Losing. That Does Not Yet Tell You Why.
The same losing streak can require patience, research, or retirement. Reacting only to P&L is dangerous because ordinary drawdown, regime mismatch, and genuine decay can all feel identical while they are happening. The job is to separate discomfort from diagnosis.
Gate Zero: Was the Original Edge Real?
Before diagnosing decay, ask whether there was enough evidence to establish an edge in the first place. A backtest can look excellent because of parameter selection, repeated testing, small samples, unrealistic fills, or a configuration chosen after many alternatives were tried. Backtest performance is evidence, not proof of a permanent live edge.
This is where what an edge actually is matters. Edge decay means something with credible evidence has weakened; immediate live failure after aggressive optimization may instead mean the original edge was overstated. You cannot diagnose the death of an edge that was never established with enough evidence to begin with.
Diagnosis #1: Normal Drawdown
Any strategy that loses sometimes can experience clusters of poor trades, deeper-than-average drawdowns, and longer recovery periods even if its expectancy remains positive. A historical win rate does not mean wins and losses arrive in a neat sequence. An edge describes a distribution; it does not promise a smooth path.
Compare current performance with the strategy's own history: drawdown magnitude and duration, number of comparable trades, consecutive losses, rolling expectancy, average winner, and average loser. Historical drawdown gives context—not a contractual maximum. Future losses can exceed anything previously observed simply because the future sample is different.
Normal drawdown should look painful but somewhat familiar. Setup behavior remains recognizable, winners still appear, payoff characteristics remain broadly plausible, and there is no strong evidence that the deterioration is tied to a structural market change. “Normal” does not mean safe to ignore; it means broadly plausible given the existing evidence.
Diagnosis #2: Edge Decay
Edge decay means the relationship between the setup and the favorable outcome has weakened, not simply that recent trades lost. Possible causes include market-microstructure changes, greater competition, rising transaction costs, changing participant behavior, or a signal becoming less predictive. None should be diagnosed from one bad week or one metric.
The stronger warning is deterioration across several dimensions. Rolling expectancy weakens, winners shrink, follow-through becomes less reliable, and the strategy continues performing poorly even when conditions that historically suited it return. A strategy failing in its historically best environment is more concerning than one failing in its historically worst.
Diagnosis #3: Market-Regime Change
A strategy can stop fitting the market without ceasing to be valid. Volatility, trend persistence, liquidity, correlations, macro conditions, and event intensity can change enough that a setup which worked well in one environment becomes less suitable in another. An edge can be conditional without being broken.
This is why market conditions change the quality of a setup. The question is not only, “Does this strategy work?” but, “Under what conditions has it worked?” A regime mismatch becomes more plausible when the environment changes in a way that historical segmentation already showed was difficult for the strategy. A valid strategy can be temporarily mismatched to the market in front of it.
Mean reversion makes the distinction easy to see. A VWAP-reversion strategy may perform well during contained, range-oriented conditions, then struggle when volatility expands and one-way sessions become more persistent. The same distance from the mean can mean “stretched” in one regime and “still accelerating” in another.
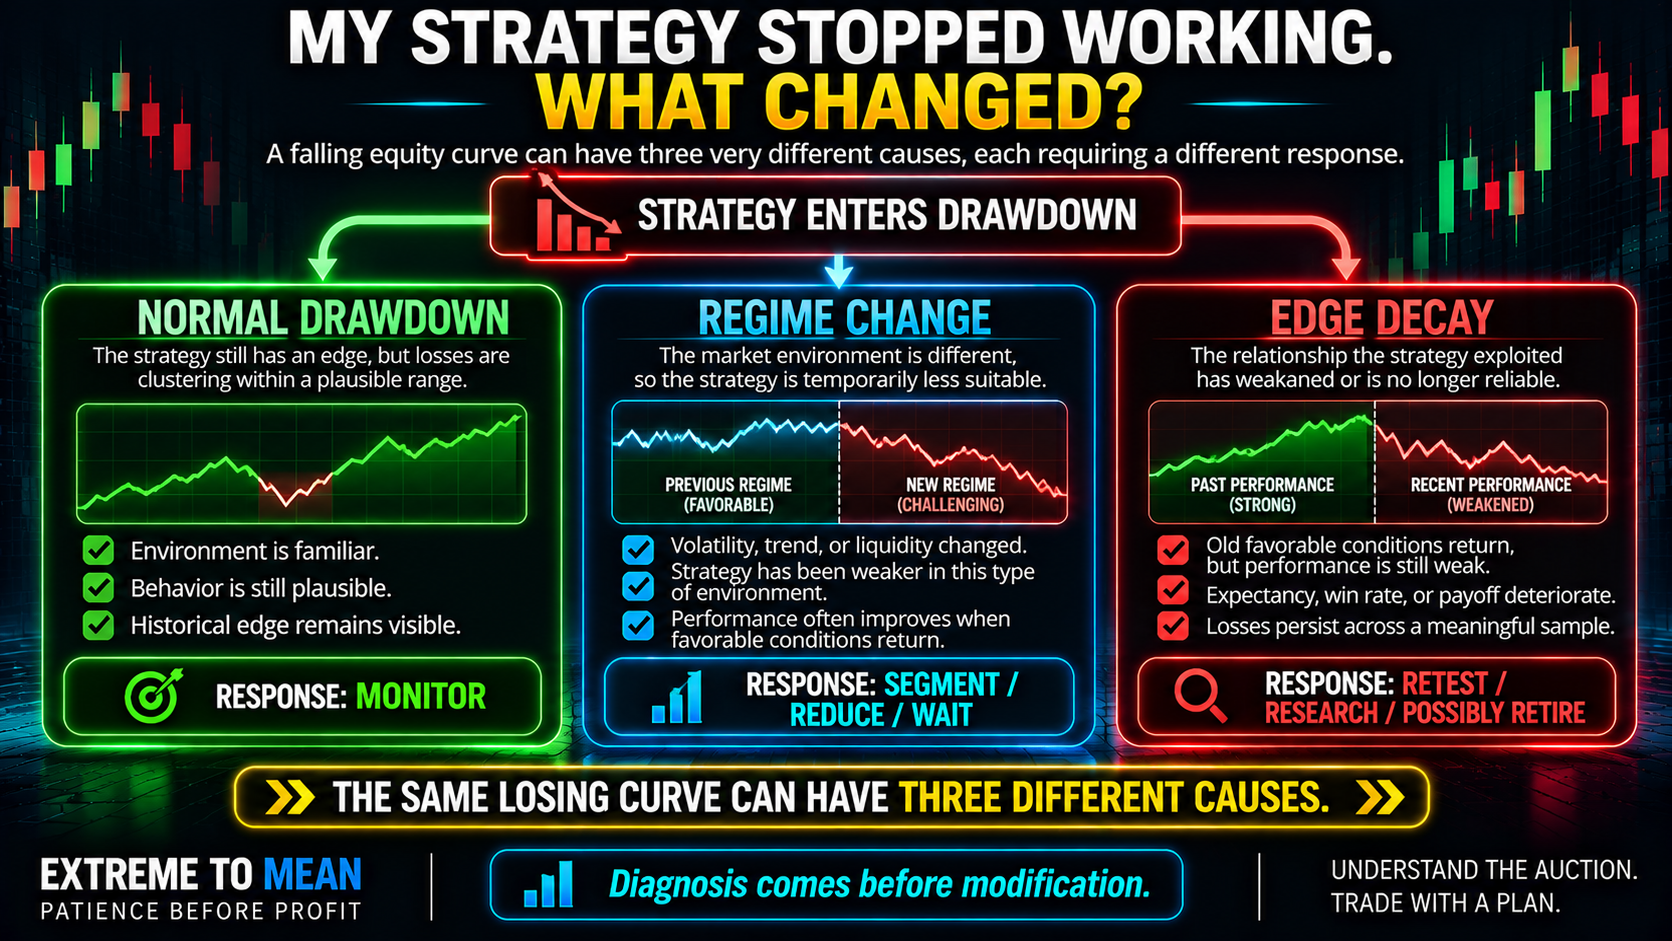
A regime mismatch is not automatically permanent. If historically favorable conditions return and the strategy's old behavior also returns, conditional performance becomes more plausible than permanent edge death. Sometimes the market did not invalidate the strategy; it simply stopped offering the environment the strategy needs.
Segment Before You Rewrite
Testing everything as one giant sample can hide the diagnosis. Segment performance by sensible variables with a plausible connection to the setup, such as volatility, trend versus range, session, instrument, or event conditions. Segmentation should test a hypothesis, not become a search for enough categories to make recent losses disappear.
The strongest diagnostic question is: Does the strategy still work when its historically favorable environment appears? If it struggles only where it always struggled, regime mismatch remains plausible. If favorable conditions return and payoff, follow-through, and expectancy remain weak across a meaningful sample, genuine decay deserves serious investigation. That comparison is more informative than simply counting recent losing days.
Do Not Optimize While You Are in Pain
Drawdown creates an urge to fix something. The trader changes a lookback, moves the stop, adds a filter, or searches for settings that would have survived the recent losses. That feels like research, but it can quietly create a new strategy optimized around the exact sample causing the pain.
A drawdown is evidence to investigate—not permission to optimize until the pain disappears. If every drawdown produces new parameters, the strategy never gets a fair test because its definition keeps changing. Diagnosis comes before modification.
Before blaming the market, also check whether live execution matches the backtest. Commissions, slippage, fill assumptions, latency, data quality, session definitions, and contract-roll handling can create a gap between simulated and live performance. Sometimes the strategy did not stop working; the simulation stopped being realistic.
One VWAP Strategy, Three Different Diagnoses
Imagine a VWAP mean-reversion setup tested across a substantial sample, validated outside the original development period, and traded successfully for several months. Then it struggles for six weeks. The first reaction might be, “VWAP mean reversion stopped working,” but the result alone cannot justify that conclusion.
Suppose the recent period has higher volatility, stronger directional persistence, and more trend-oriented sessions, while historical segmentation shows the strategy was always weakest under those conditions. Regime mismatch is now more plausible than edge death. The cleaner response is to monitor what happens when historically favorable conditions return rather than rewriting the strategy immediately.
Months later, range-oriented conditions return, but the strategy still shows weaker snapback, smaller winners, and deteriorating expectancy. Now the evidence is different. When the old environment returns but the old edge does not, decay deserves serious investigation.
The Three-Diagnosis Matrix
| Question | Normal Drawdown | Edge Decay | Regime Change |
|---|---|---|---|
| Losses plausible versus history? | Often | Increasingly not | Can be |
| Works when favorable conditions return? | Often | Increasingly no | Often |
| Environment materially different? | Not required | Not required | Usually |
| Rolling expectancy recovering? | May recover | Persistent deterioration | Conditional on regime |
| Best first response | Monitor | Research / retest | Segment / adapt exposure |
These are diagnostic clues, not proof. No single cell decides the answer, and historical plausibility does not guarantee recovery.
The Strategy Health Check
Before changing anything, ask:
- Was the original edge validated out of sample?
- Were realistic fees, slippage, and fills included?
- How does the current drawdown compare with historical magnitude and duration?
- How many comparable trades are in the recent sample?
- Has rolling expectancy actually deteriorated?
- What changed: win rate, payoff, setup frequency, or execution?
- Has volatility, trend behavior, or liquidity materially changed?
- Does the strategy still work when its historically favorable regime appears?
- Am I changing parameters because the evidence changed—or because losing feels uncomfortable?
- What evidence would make me continue, reduce, pause, retest, or retire it?
The decision to pause should come from predefined research and risk criteria, not from the emotional point where losses finally become unbearable. There is no universal drawdown threshold that safely answers the question for every strategy.
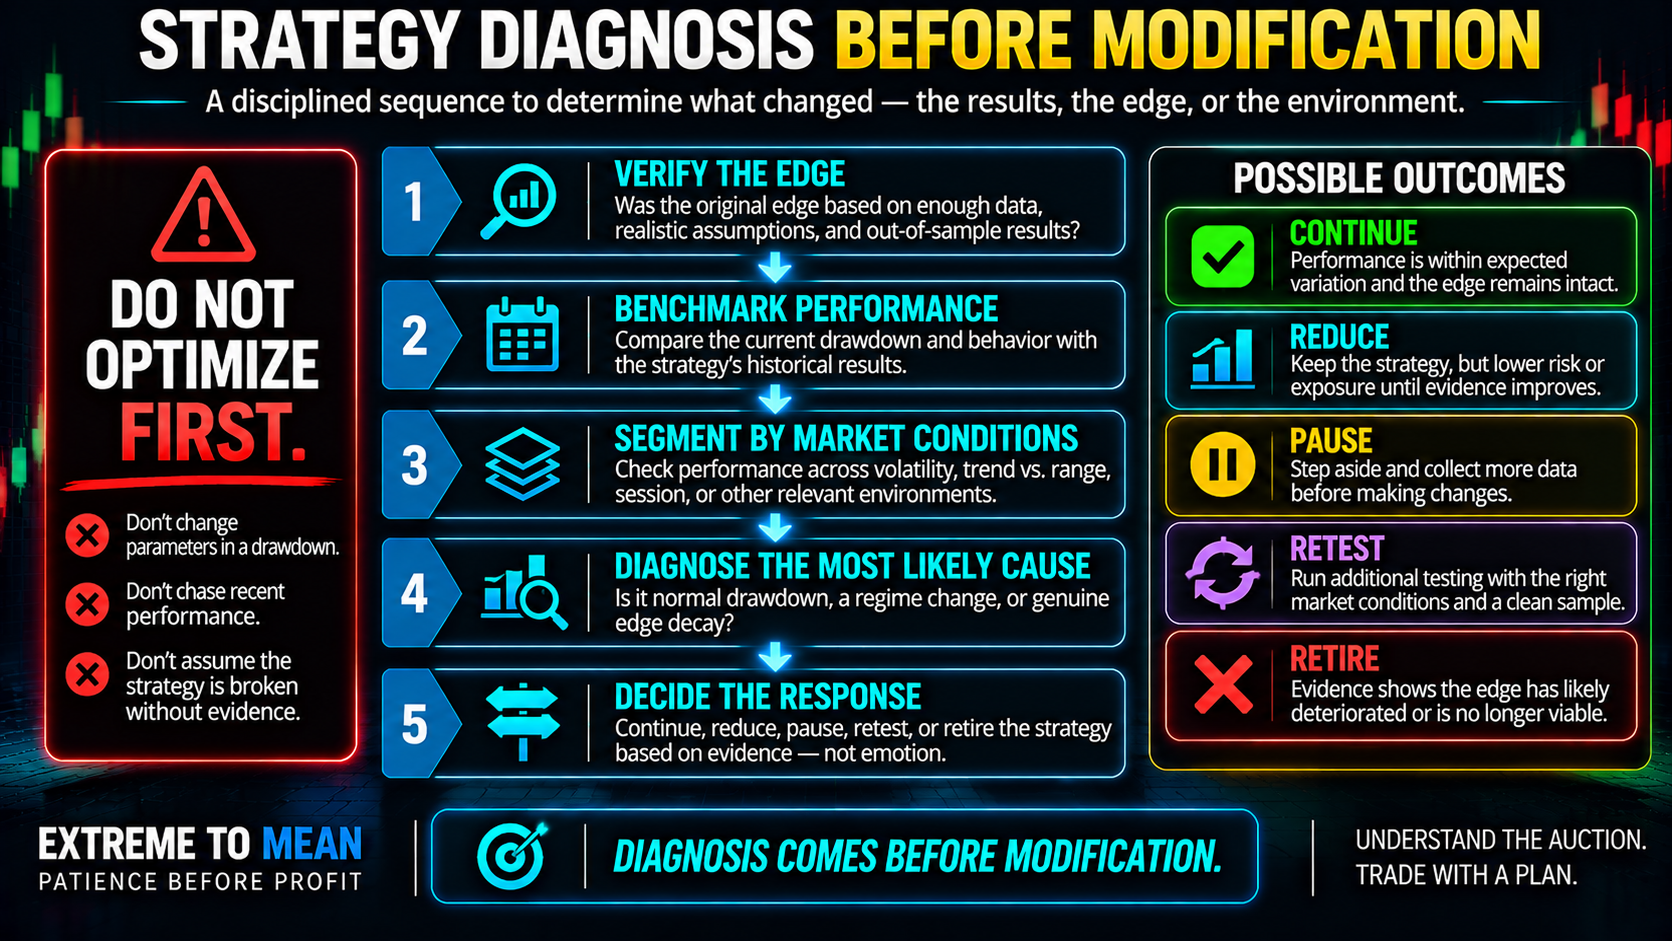
Continue, Reduce, Pause, Retest or Retire?
The danger exists on both sides: quitting a good strategy too early and defending a bad strategy too long. Context comes before the candle, and the same principle applies to research—recent losses need context before they become a conclusion. Retire a strategy because the evidence changed, not simply because confidence did.
If the diagnosis remains uncertain, reducing or pausing live exposure while collecting more evidence may be cleaner than immediately rewriting the system. The ETM free tools can support review, but no worksheet can replace a defined research standard. A valid strategy deserves evidence before abandonment, and a broken one deserves more than hope before continued risk.
The ETM Verify → Benchmark → Segment → Diagnose → Decide Framework
Use VERIFY → BENCHMARK → SEGMENT → DIAGNOSE → DECIDE. Verify that the original edge was credible, benchmark current performance against historical behavior, and segment results by market conditions that genuinely matter to the setup. Then diagnose the most plausible explanation before changing the strategy.
The diagnosis may be normal drawdown, regime mismatch, edge decay, or an original-model problem. Only after that should the response become CONTINUE / REDUCE / PAUSE / RETEST / RETIRE. Diagnosis comes before modification.
Final Thought
When a strategy starts losing, the equity curve tells you that something changed in the results. It does not tell you why. The losses may be ordinary variation inside a valid edge, the market may have shifted into a regime where the strategy historically struggles, the edge may genuinely be weakening, or the original backtest may have overstated what existed from the beginning.
Do not change parameters until the recent pain disappears. Verify the original edge, compare current drawdown with historical behavior, count enough comparable trades, segment performance by relevant market conditions, and ask the most important question: when the strategy's old favorable environment returns, does the old behavior return with it?
A valid strategy deserves enough evidence before you abandon it. A broken strategy deserves more than hope before you keep trading it.
Educational content only. Trading involves substantial risk and is not suitable for everyone.