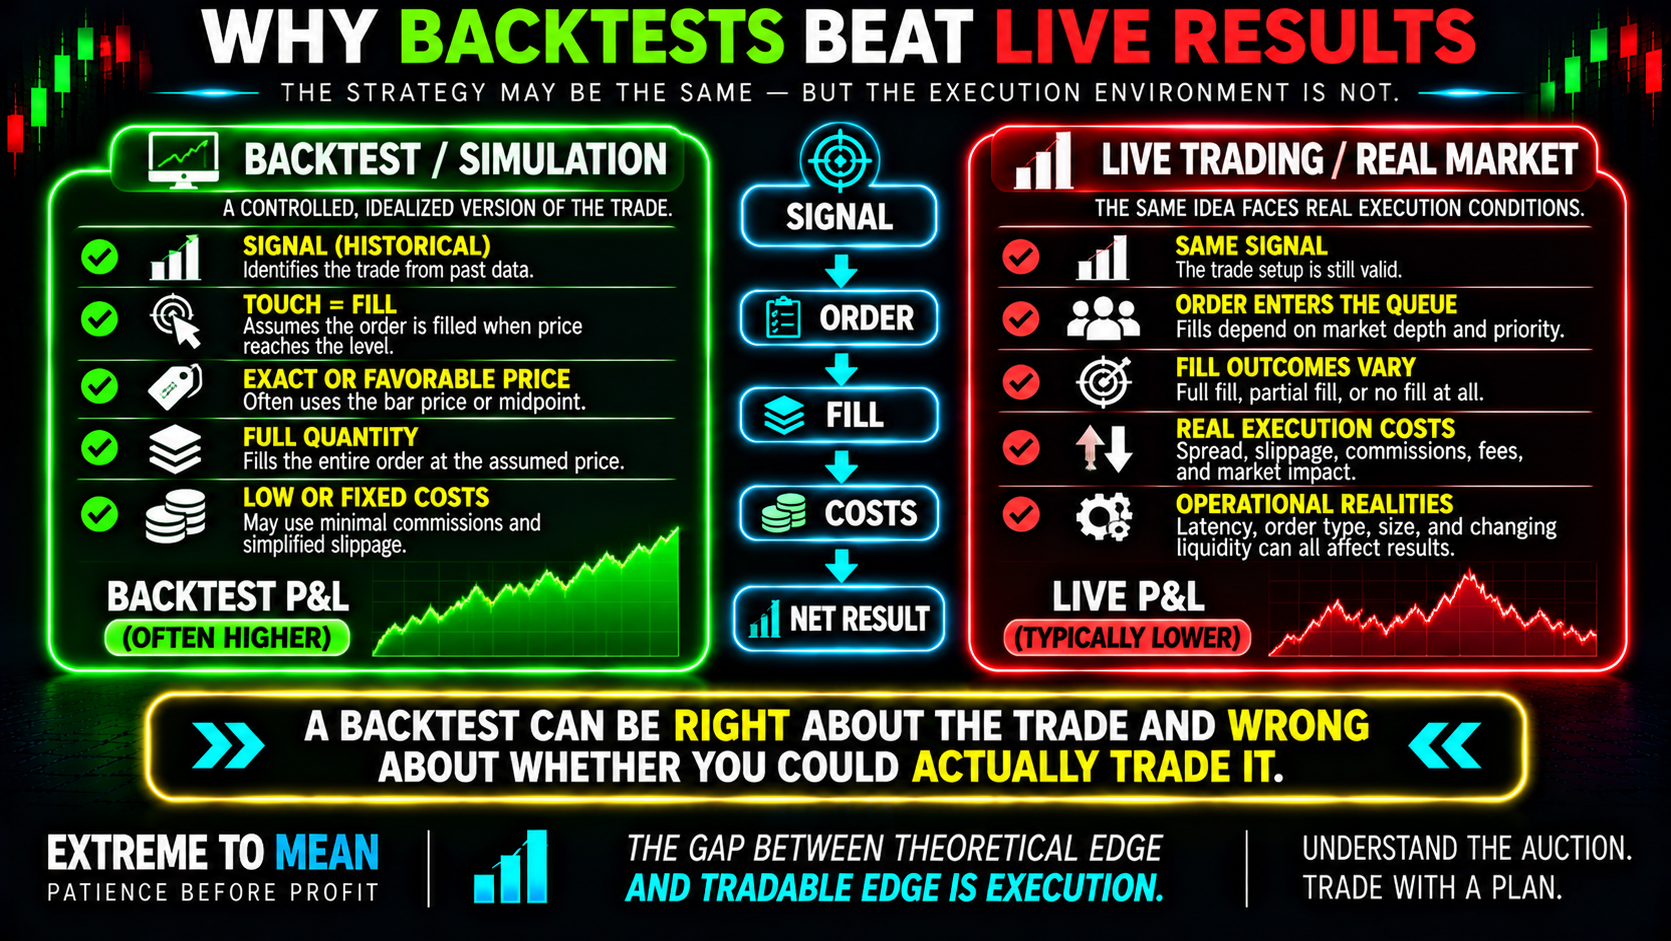
A backtest can identify a good trade and still exaggerate what that trade was worth once a real order had to reach the market.
A backtest does not trade. It reconstructs what might have happened under assumptions about signals, orders, fills, timing, size, and costs.
The sharper question is not simply, “Why was live P&L worse?” It is: Did the edge disappear—or did the backtest assume an execution environment that never really existed? That distinction belongs inside The Setup because a strategy is not fully understood until the path from signal to net result is modeled realistically. The gap between theoretical edge and tradable edge is execution.
Your Backtest Did Not Actually Trade
Historical simulation usually begins with a useful abstraction: when condition X occurred, the strategy bought or sold at price Y. The trouble begins when the simulated fill is treated as an observed historical fact rather than a modeling decision. History can show that the market traded at a price; it cannot automatically show that your order existed in time, had sufficient priority, received full quantity, or paid no friction.
Signal timing comes first. If a rule says “buy when this five-minute candle closes above X,” the strategy cannot know the final closing condition before the candle has actually closed. A simulator that sees the completed bar and then gives an earlier or conveniently identical fill is creating a timing advantage, not merely low slippage.
OHLC bars can also hide the path inside the candle. If one bar trades through both a stop and a target, the bar alone may not reveal which came first. The price that confirms the signal is not automatically the price available after the signal.
Touch Does Not Equal Fill
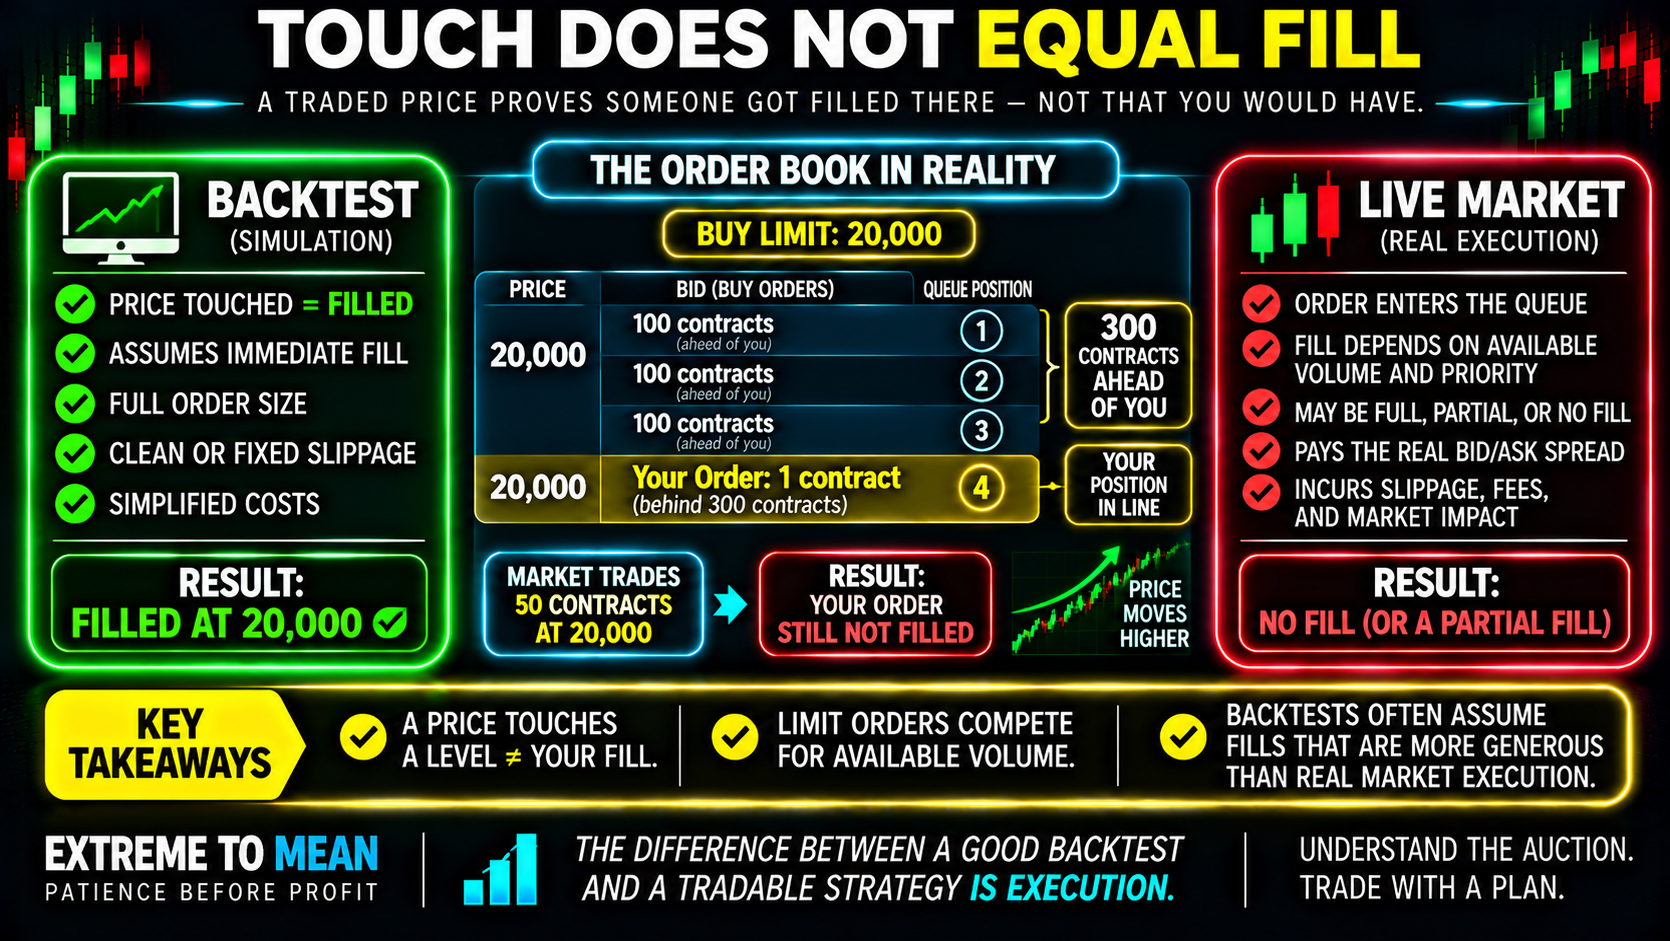
Passive limit orders create one of the largest backtest/live gaps. A generous simulator may use PRICE TOUCHED = FILLED, while a more conservative model may require trade-through or additional bid/ask and volume evidence. None can perfectly reconstruct a particular trader's queue position, but those assumptions do not have the same degree of optimism.
Suppose 300 contracts are already resting at your buy price and your one-contract order joins behind them under the market's applicable priority rules. If only 50 contracts trade there before price reverses higher, the tape proves somebody traded at your price while your order could still be waiting. A traded price proves somebody got filled there; it does not prove you would have.
Partial and missed fills change more than price. A simulator may fill twenty contracts at one level while the live market fills four and leaves, producing different exposure and management. If fast reversals are often missed while deeper moves fill and continue adversely, the simulation may receive a better mix of trades than live execution.
Market Orders Solve One Problem by Creating Another
Marketable execution reduces fill uncertainty by accepting price uncertainty. If the last trade is 20,000 while the best bid and ask are 19,999.75 and 20,000.25, the next aggressive buyer may need to pay the ask and the next aggressive seller may need to hit the bid. LAST TRADE ≠ EXECUTABLE BID/ASK.
Midpoint fills deserve the same scrutiny. The midpoint is a useful reference, but repeatedly assuming execution there without a realistic mechanism for earning that price can manufacture an advantage. A price series may be sufficient to study market behavior while still being insufficient to model execution.
The spread is therefore a cost even before a commission is charged. The smaller the expected edge per trade, the more important this becomes, because a few ticks of friction can consume a large share of the economics. What an edge actually is ultimately has to survive the cost of capturing it.
Stop Price Does Not Always Equal Fill Price
Protective stops can also be modeled too cleanly. Depending on the stop order type, reaching the trigger may activate a marketable order or a limit-style instruction, and the eventual execution can differ from the trigger price. A stop defines when an exit instruction activates; it does not always define where the market can complete the exit.
That can make friction asymmetric. Profit-taking limits may often execute near their intended price when liquidity is available, while adverse protective exits during fast movement can face a rapidly changing book. A backtest that assumes +2R winners and exactly −1R losers can therefore overstate expectancy if live adverse exits systematically average worse than −1R.
The cost stack is larger than commissions: spread, slippage, partial fills, missed fills, and market impact can all matter. The more often a strategy needs execution, the more often execution gets to charge rent.
Size and Liquidity Change the Gap
A one-contract backtest cannot always be multiplied by twenty and called a twenty-contract strategy. Larger orders may need to interact with several book levels, receive partial fills, or produce a different average execution price. Capacity is part of the strategy, not an afterthought.
Liquidity also varies with time of day, volatility, news, and market conditions. Market conditions change the quality of a setup, and they can also change the cost of executing it. Fidelity should rise as a strategy becomes faster, smaller in edge, larger in size, or more dependent on passive fills; the goal is realism, not punishment.
“Backtest Worked, Live Failed” Is a Symptom
A backtest/live gap does not automatically prove overfitting. The signal itself may have been fitted to historical noise, but the difference can also come from signal timing, unrealistic order assumptions, missing costs, regime change, implementation bugs, or the live and simulated systems taking different trades. BACKTEST/LIVE GAP ≠ AUTOMATICALLY OVERFITTING.
Before comparing P&L, verify signal parity. Are both environments identifying the same setup, using the same logical submission time, order type, size, stop logic, and target logic? If the trade sets differ, arguing about average slippage may be diagnosing the wrong problem.
This is where the trade is not ready until the risk is clear becomes a research principle too. The live order path must match the risk assumptions embedded in the simulation. Two systems that make different decisions are not simply two execution versions of the same strategy.
Reconcile the Gap Instead of Calling It Slippage
Compare each live trade with its simulated counterpart and separate the sources of divergence. What gets measured separately can be modeled separately, while one generic “slippage” number hides whether the real issue was timing, missed fills, spread, quantity, fees, or management.
| Field | Compare |
|---|---|
| Signal | Did both environments generate the same trade? |
| Intended order | Same type, size, and logical submission time? |
| Simulated fill | What price and quantity did the backtest assume? |
| Live fill | What actually executed? |
| Friction | Spread, slippage, fees, partial or missed fill? |
| Management | Did stop and target logic match? |
| Net difference | How much did each category contribute? |
Then aggregate entry and exit shortfall, missed or partial fills, stop slippage, and fees. That record can separate a weak signal from an unrealistic fill model or implementation problem. Do not call the whole difference slippage. Reconcile it.
Haircut the Assumptions, Not the Equity Curve
A blanket rule such as “subtract 20% from backtest profits” is easy to apply but difficult to defend. A better stress test uses plausible worse entries and exits, stronger evidence for passive fills, actual fees, realistic spread and slippage, quantity limits, and timing delays. Haircut the assumptions—not the final equity curve.
Use scenarios when execution is uncertain: expected, conservative, and stressed. A strategy that works only under perfect execution is relying on execution perfection as part of its edge.
The Backtest-to-Live Gap Check
Before concluding that the strategy stopped working, ask:
- Are live and backtest generating the same signals?
- Does the test wait until the signal is actually knowable?
- What evidence is required before a passive limit is counted as filled?
- Does the model account for bid/ask rather than only last trade?
- Can partial and missed fills occur?
- Can marketable and stop exits execute away from their trigger or reference?
- Do friction assumptions change with liquidity and volatility?
- Are current transaction costs included?
- Does larger size change expected execution?
- Does the edge survive conservative but plausible assumptions?
The better question is not merely, “Does the strategy work?” It is: Does the strategy remain useful after the market charges you to execute it? The ETM free tools can support structured review, but the key discipline is comparing simulation assumptions with actual fills rather than defending the backtest.
The ETM Signal → Order → Fill → Friction → Reconcile Framework
Use SIGNAL → ORDER → FILL → FRICTION → RECONCILE. Confirm the same decision, verify the same logical order, test whether the assumed price and quantity were realistically executable, measure what spread, slippage, fees, and market impact removed, and then explain the difference trade by trade. The possible responses are MODEL / ADJUST / RETEST.
The six distinctions are simple: PRICE TOUCHED ≠ YOU FILLED; STOP PRICE ≠ GUARANTEED FILL PRICE; LAST TRADE ≠ EXECUTABLE BID/ASK; SIMULATED FILL ≠ LIVE EXECUTION; GROSS EDGE ≠ TRADABLE NET EDGE; BACKTEST/LIVE GAP ≠ AUTOMATICALLY OVERFITTING. A backtest earns more trust when its assumptions become harder for reality to embarrass.
Final Thought
A backtest is useful because it tests an idea against history, but history does not contain your future queue position, guarantee a passive fill, or absorb unlimited size without consequence. If a simulation fills every touch, grants exact prices, ignores the spread, assumes full quantity, and leaves costs out, it is quietly modeling an unusually cooperative market.
The solution is not to assume live trading is always worse or to subtract an arbitrary percentage from historical profits. Reconcile the execution: match timing, model realistic orders, account for partial and missed fills, use current costs, stress liquidity, and compare the same simulated trades with actual fills. A backtest can be right about the trade and wrong about whether you could actually trade it.
A real edge should survive the cost of capturing it. If profitability disappears once execution becomes realistic, the live market did not necessarily break the strategy. It may simply have revealed what the backtest never charged you for.
Educational content only. Trading involves substantial risk and is not suitable for everyone.