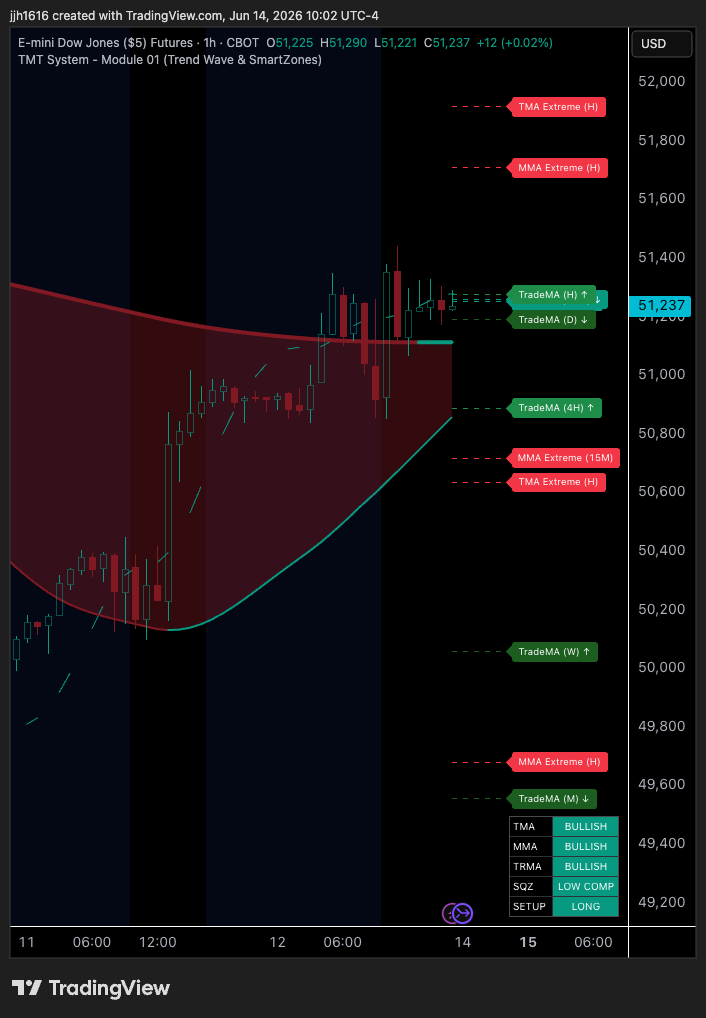
Trend Wave & SmartZones
Use this module to identify trend direction, track changing conditions, and highlight areas where price may deserve attention.
View Module 01The Foundation Stack
The Foundation Stack is the base layer of the TMT System. It helps traders frame trend direction, recognize when conditions may be changing, map likely pullback areas, and understand where price is trading before focusing on entries and exits.
Before a trader can make a cleaner decision, they need to understand the chart environment. The Foundation Stack helps answer the first questions: what direction is the market moving, where is price likely reacting, and where should the next decision be made?
Foundation Stack Snapshot
What This Stack Helps You Define
Goal: build the chart foundation before focusing on execution.
Foundation Stack Overview
The Foundation Stack brings trend, location, and session context together before execution. Use one module by itself, combine two, or keep all three in your workflow depending on the chart, timeframe, and decision you are evaluating.
Use this module to identify trend direction, track changing conditions, and highlight areas where price may deserve attention.
View Module 01Use this module to map where price is trading, avoid the middle, and focus on areas with cleaner decision potential.
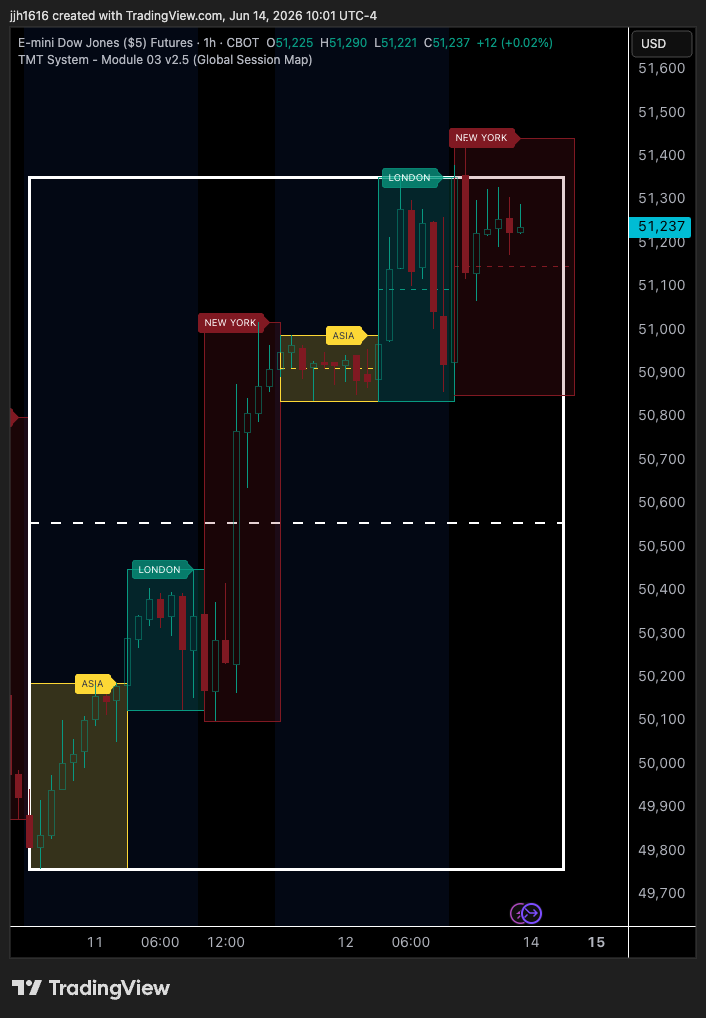
View Module 02Use this module to keep timing, range behavior, and global session context visible before judging trade quality clearly.
View Module 03Trend Wave & SmartZones is the primary chart-overlay module and foundation layer of the TMT System. It brings the TradeMA, MomoMA, TrendMA, TrendWave, SmartZones, Extreme Zones, candle context, setup labels, and dashboard status into one chart view to help traders read direction, momentum, stretch, and trade context without stacking multiple separate overlays.
This module gives traders the first read of the chart. It helps organize the active trend structure, momentum alignment, trade-level pressure, higher-timeframe SmartZone areas, and extreme-zone references so traders can better judge whether price is aligned, stretched, reverting, trending, or moving into a location where patience matters.
What it helps you see:
Use it as the primary TMT chart map before layering in location, session context, market internals, or confirmation tools.
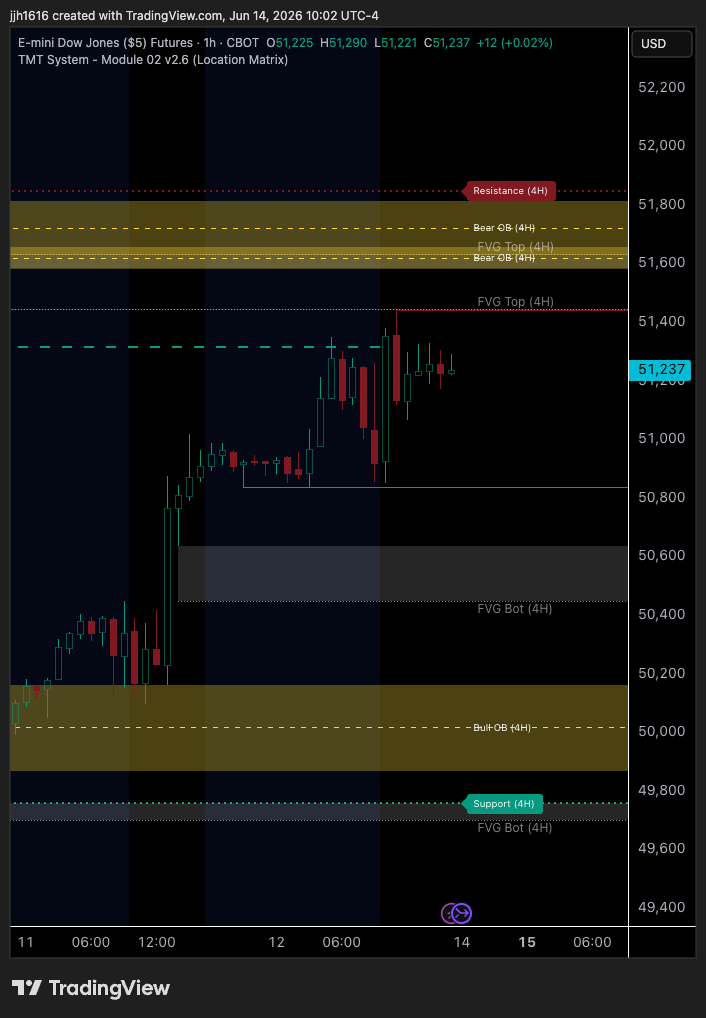
MTF FVGs, Location & Structure is the price-location layer of the TMT System. It brings together imbalance areas, higher-timeframe support and resistance, supply and demand zones, order blocks, and market structure into one chart overlay so traders can judge where price is trading before deciding what to do next.
Instead of treating every level or zone as equally important, this module helps organize the areas most likely to matter. It gives traders a cleaner way to see nearby reaction zones, structural shifts, invalidation areas, and confluence before deciding whether a setup has location — or whether price is sitting in chop.
What it helps you see:
Use it as the map for location and structure before deciding whether a setup deserves execution.
Global Session Map is the session and key-level mapping layer of the Foundation Stack. It maps the Daily Box, Asia, London, and New York session ranges, session highs and lows, midpoints, completed session structure, and major higher-timeframe reference levels directly on the chart.
The Daily Box gives traders a broader range framework for understanding the trading day. Combined with global session ranges and higher-timeframe levels, this module helps traders see whether price is rotating inside balance, expanding beyond a boundary, rejecting an important area, or moving toward a larger reference level before making a trading decision.
What it helps you see:
Use it as the Daily Box and global session map that keeps price movement grounded in time, range, and higher-timeframe context.
Build Your View
The Foundation Stack is designed to be flexible. Traders can decide which foundation tools to display, where they sit on the chart, and which layouts need trend, location, or session context.
Use one foundation tool or combine all three depending on the chart you are trading.
Place the tools where they support your process without blocking the price action.
Use different foundation tools on different charts, timeframes, or layouts.
Foundation Stack Preview

Coming Soon
The Foundation Stack is part of the TMT System. The TMT System has already been built and is being prepared for TradingView release. Join the waitlist to be notified when launch details, beta availability, and module release updates are announced.
No spam. Just launch updates, beta details, and TMT System announcements.
Founder Beta. Founder Beta access is planned as an early-access release for traders who want to test the TradingView-ready TMT modules before the broader launch. Final timing, pricing, packaging, and availability may change before release. Joining the waitlist does not create a purchase obligation or guarantee access.
Risk Reminder
TMT System modules are decision-support tools designed to help organize market context. They are not financial advice, a signal service, or a replacement for a trade plan. Trading involves substantial risk and is not suitable for everyone. Every trader is responsible for their own entries, exits, position sizing, risk management, and results.