
Traders naturally prefer precision because an exact number feels objective. A horizontal line can be marked clearly, an alert can be placed directly on it, and the plan can appear simple: if price reaches the number, the trader acts. The problem is that markets rarely behave with that level of precision.
Every market is an auction involving participants with different positions, timeframes, order sizes, expectations, and execution prices. One trader may begin buying near the upper edge of an area while another waits for a deeper test, and larger orders may be distributed across several nearby prices. Stops and breakout orders may also sit slightly beyond the most visible level, causing price to move through the line before the market reveals whether buyers or sellers can maintain control.
The result is usually an area of concentrated interest rather than one perfect price. Treating that area as a zone does not make the analysis vague or undisciplined. A useful zone can still have defined boundaries, a clear purpose, and a specific point at which the location is no longer valid.
This lesson belongs in the broader setup and risk curriculum, where location is evaluated before entry, invalidation, position size, and trade management.
Before choosing the final entry, a trader should first understand why location is the first filter. The zone identifies where the decision may become relevant, while the market’s behavior determines whether that decision should lead to a trade.
Why Exact Prices Feel So Important
Exact levels feel trustworthy because the chart displays price precisely. Every candle has a specific high, low, open, and close, while moving averages produce exact values and trading platforms record movement to the tick. That visual precision can lead traders to assume that the market itself is organized around one exact number.
A trader may identify yesterday’s low, a prior swing high, a round number, or a moving average and expect price to react directly at that figure. If the market reverses slightly before touching it, the trader feels that the opportunity was missed. If price trades slightly through it, the trader assumes that the level has failed.
Both conclusions can be premature because the broader interaction may still be valid. Price turning just before the line can represent a response to orders positioned near the area, while a brief move through the line may be ordinary auction behavior rather than proof that the location no longer matters. The exact transaction price is real, but the market’s response often develops across several nearby prices.
The exact-price mindset can also create emotional decisions. Traders enter early because price is “almost there,” chase after a reversal because the perfect number was missed, or abandon a meaningful location because price moved a few ticks beyond the line. The problem is not that the trader marked a precise reference; it is the belief that the market must treat that reference like a wall.
A Zone Represents Concentrated Interest
A location zone is an area where previous market behavior suggests that buyers, sellers, liquidity, or positioning may become more important. It can be built around a prior swing high or low, a visible range boundary, repeated support or resistance reactions, a former breakout point, a cluster of candle bodies and wicks, higher-timeframe structure, or a moving-average area. Its value comes from several pieces of evidence gathering in approximately the same place.
Suppose a market has turned higher several times between 5,190 and 5,195. One response began at 5,194.50, another started at 5,191.25, and a third briefly traded below 5,190 before recovering. Drawing a separate line through every turning price may add detail without improving the trader’s understanding of what happened.
A single zone communicates the more useful idea: sellers repeatedly struggled to maintain control within that general area. The zone does not claim that price must reverse at 5,192.00 or at any other exact number. It identifies where a change in behavior has occurred before and where another decision may become relevant if price returns.
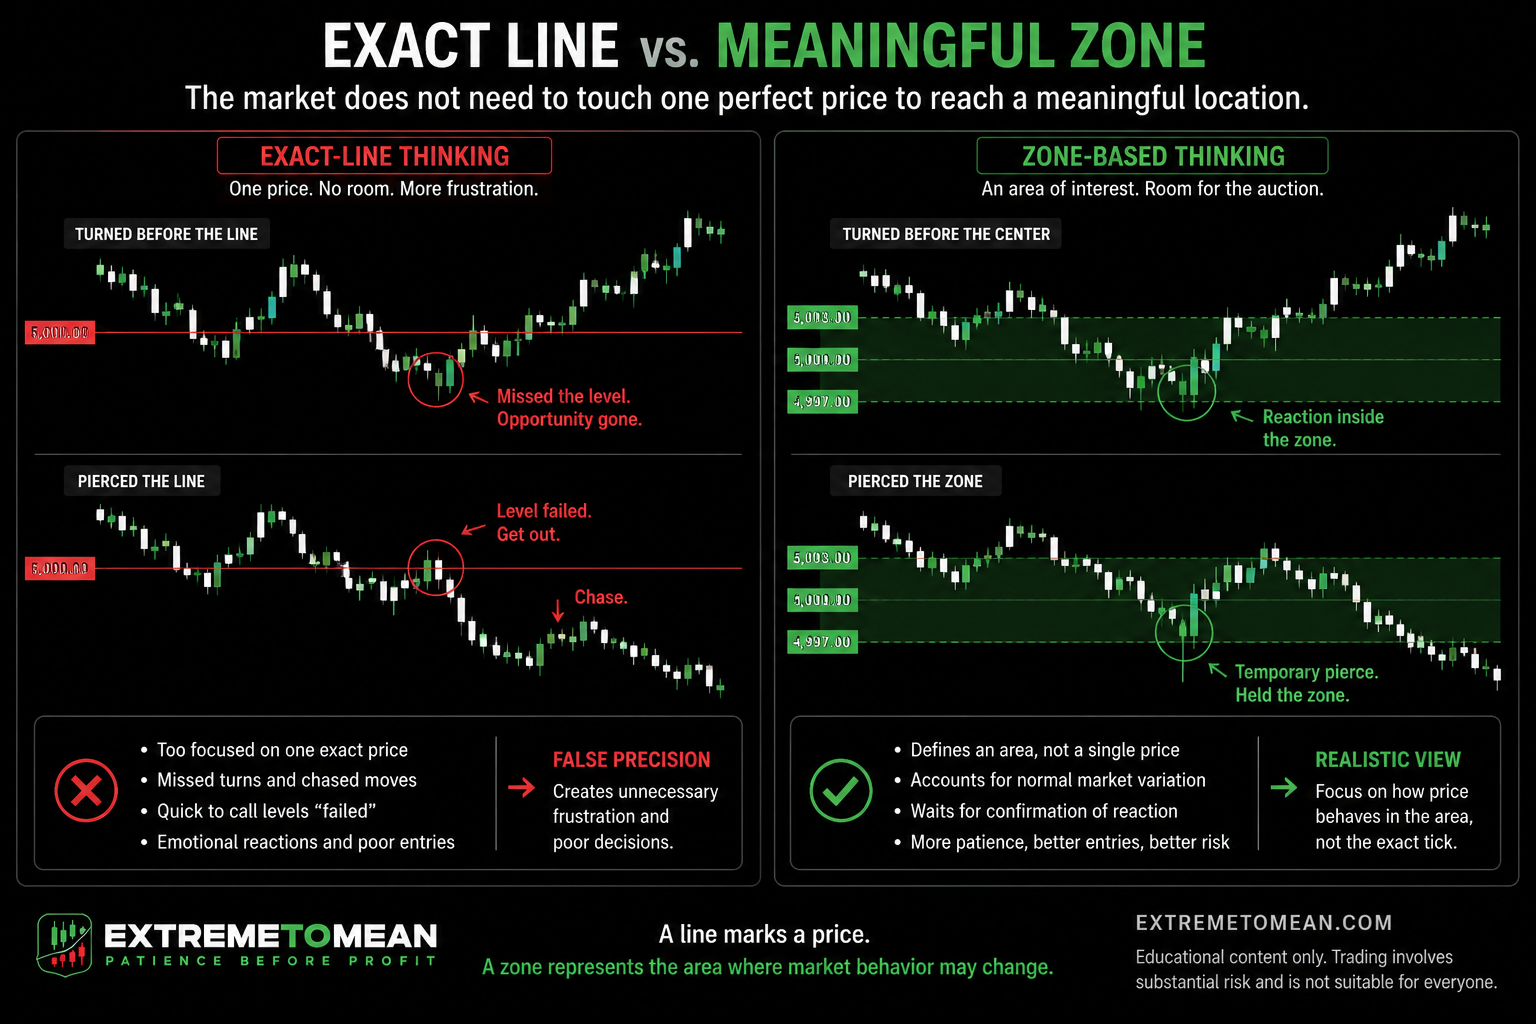
The objective is not to make the zone so broad that every outcome can be explained. It should be narrow enough to guide the decision while wide enough to represent the actual cluster of market activity. A zone that covers too much price loses meaning, but a line that ignores normal variation creates false precision.
Support and Resistance Rarely Behave Like Walls
Support and resistance are often drawn as horizontal lines because lines are easy to see and compare. In practice, meaningful support and resistance generally involve several nearby prices rather than one exact barrier. The line can remain a useful visual reference, but the trader should interpret the surrounding area.
A resistance zone may contain several swing highs, candle wicks above the closing prices, a failed breakout, and a cluster of earlier selling activity. Support might include repeated lows, several closes above the same region, and a deeper wick produced during a brief rejection. These features describe where participation changed, even when each reaction began at a slightly different number.
This is why meaningful support and resistance should be treated as areas rather than promises. When price returns, it may reverse near the edge of the zone, move into the center and pause, trade through part of the area before recovering, break through it completely, or show little response. The trader cannot know the outcome merely because the area has been marked.
The zone organizes observation rather than predicting the reaction. As price approaches, the trader can evaluate whether movement is accelerating or slowing, whether candles are expanding or overlapping, and whether buyers or sellers are producing follow-through. The location creates the question, while the market’s response supplies the evidence needed to answer it.
Previous Highs and Lows Form Areas
Previous highs and lows matter because they show where control changed before. A swing low marks the region where selling stopped producing lower prices and buyers became strong enough to move the market upward. A swing high identifies where buying failed to continue and selling pressure became more influential.
The deepest turning price is useful, but it is only one part of the structure. A swing low may form across several candles, with one candle creating the lowest wick, nearby candles closing higher, and the strongest buying beginning from a price above the absolute low. When the market returns, buyers may respond before the original wick is reached.
Instead of trying to identify one “true” support price, the trader can interpret what each part of the formation represents. The wick may show the deepest rejection, the candle bodies may show where price was accepted, and the later movement may show where buyers produced meaningful follow-through. Together, those transactions define the area that influenced the market.
Effective chart reading therefore involves outlining the behavior rather than debating the exact pixel where a line belongs. The zone should include the prices that contributed to the change in control without becoming so wide that it stops helping the decision. Its boundaries should reflect the structure that mattered, not the trader’s need to keep the idea alive.
Moving Averages Should Also Be Treated as Areas
Moving averages appear as precise lines, but they should not automatically be treated as exact execution prices. The value changes as each new candle is added, and different traders may be watching different moving-average types, lookback lengths, timeframes, session settings, or data feeds. What looks like one exact line on a chart may represent a broader area of trend or balance to the market.
Price may respond before reaching the moving average, trade slightly through it and recover, or interact with several nearby averages at once. In those situations, the important information is not whether one line was touched perfectly. The trader should instead evaluate whether price is interacting with a meaningful area of trend, momentum, or balance and what behavior is occurring there.
A moving-average interaction does not become a setup simply because the line was reached. Structure, market state, confirmation, invalidation, and available room still determine whether the location deserves risk. The moving average can guide attention, but it cannot replace the rest of the trade evaluation.
This distinction prevents the trader from turning a mathematical reference into an automatic signal. A precise value can help organize the chart while still being interpreted as part of an area. The final decision depends on the reaction, not on the line existing.
The Zone Is Not the Entry
Once traders begin thinking in zones, another mistake can appear: entering as soon as price arrives anywhere inside the area. Reaching the location is not the same as qualifying the trade. Price can enter support and continue lower, reach resistance and accelerate higher, or become more extended before any meaningful reversion begins.
The zone tells the trader where the decision may become more relevant, but it does not make the decision. A cleaner process identifies the area before price arrives and then observes how the market approaches and interacts with it. The trader can watch for slowing movement, acceleration, rejection, acceptance, a failed break, or a clean move through the area.
That response must then be evaluated against the higher timeframe and the current market state. The trader still needs a defined entry condition, a clear invalidation point, and enough room between the proposed entry and the likely target or next obstacle. Only after those parts align does the trade become definable.
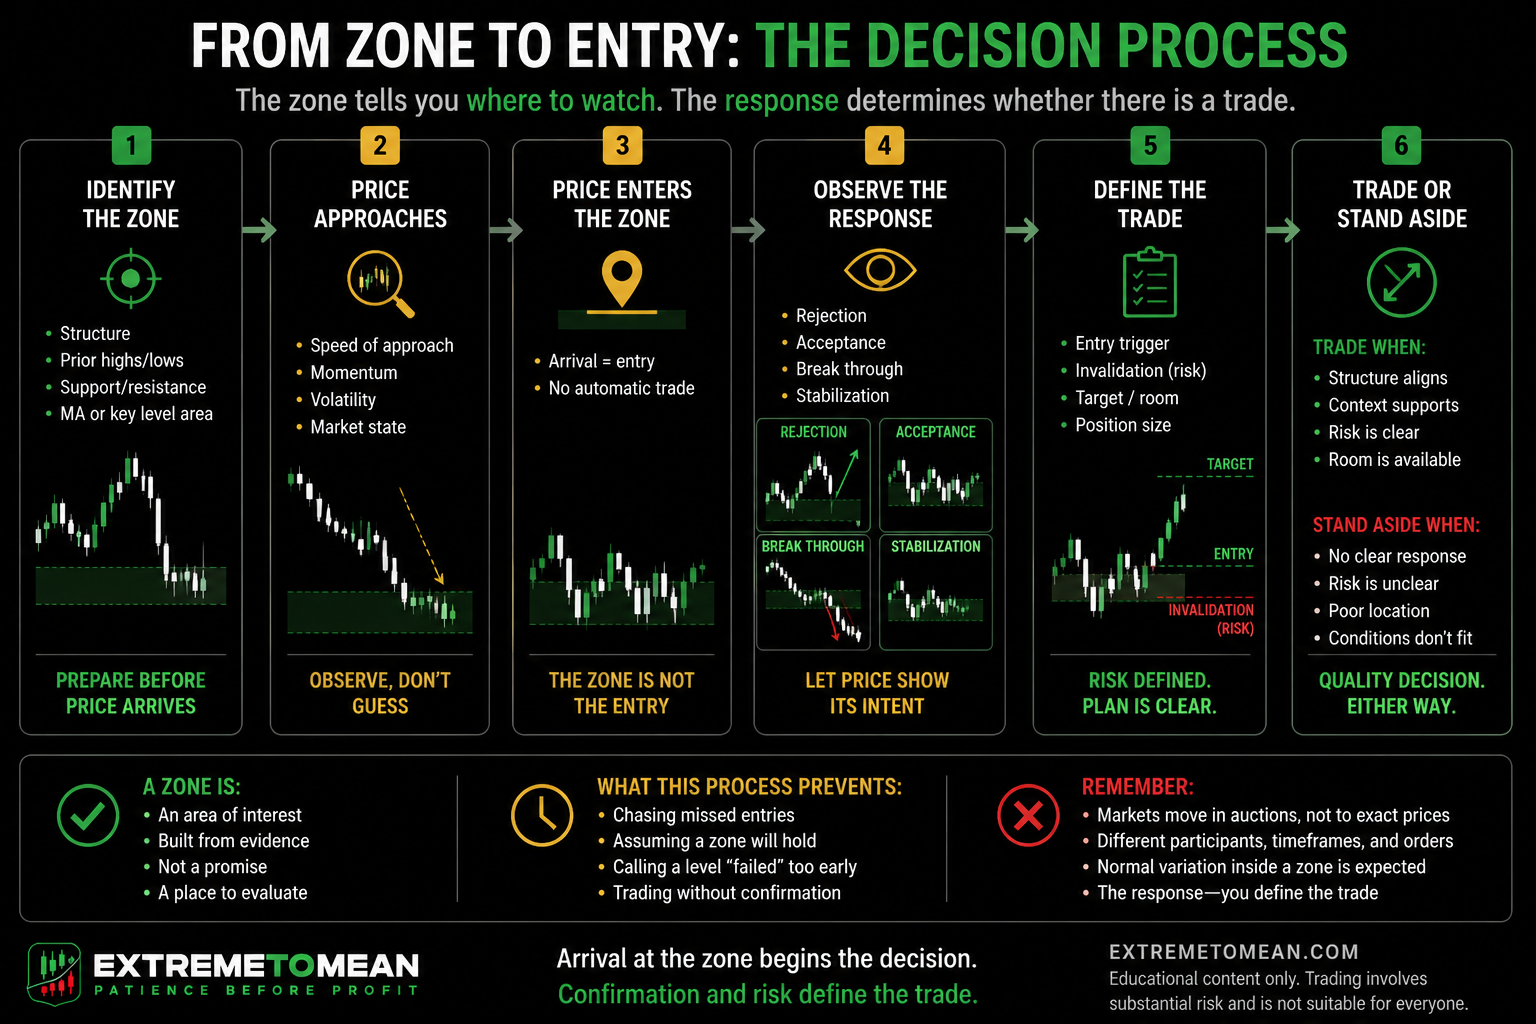
A zone creates a place to pay attention, not permission to trade. This distinction protects the trader from entering simply because price reached a familiar area. Location can earn attention while the reaction and trade structure determine whether the setup earns risk.
Zones Reduce the Need to Chase
One practical benefit of zone-based thinking is that it reduces frustration when price does not touch an exact line. Imagine a trader marks support at 5,000, but price declines only to 5,001.25 before turning sharply higher. A trader who treats 5,000 as the only valid price may believe that the market missed the level and that the planned opportunity disappeared.
That frustration can quickly lead to chasing. The trader believes the original analysis was correct, sees the move beginning without them, and enters at a worse price because they do not want to miss it. The new entry may follow the same directional idea, but it creates a different trade.
The structural stop may still belong below the original area while the late entry sits farther away from that invalidation. At the same time, the distance to the likely target has decreased. The trader is accepting more risk while pursuing less remaining opportunity.
A zone-based plan might instead have identified 4,998 to 5,003 as the area of interest. Price turning at 5,001.25 would then be recognized as an interaction with the planned location rather than a failure to reach it. That does not require the trader to enter, but it allows the reaction to be evaluated calmly without the false belief that the market broke the plan.
Zone-based thinking creates flexibility in observation, not flexibility in risk discipline. The trader can recognize a valid interaction without chasing after the move has already changed the entry, stop distance, and available room. When the remaining trade no longer makes sense, the correct decision is still to stand aside.
Zones Prevent Premature Failure Judgments
The opposite error occurs when price moves slightly beyond an exact line. Suppose resistance is marked at 4,800, but the market trades to 4,802, pauses, and then falls sharply. A trader focused solely on the line may declare that resistance failed the moment price moved above 4,800.
A zone defined in advance from 4,798 to 4,803 may produce a more accurate interpretation. Price tested the upper portion of the area, found additional selling interest, and was rejected. The move above the central line was part of the interaction rather than automatic proof that the location had lost meaning.
The important requirement is that the boundaries were established before the reaction occurred. A trader should not keep expanding the zone after price moves through it, because doing so would allow every outcome to be explained after the fact. The area must contain enough flexibility for normal auction variation while still identifying where the original location idea becomes invalid.
A useful zone therefore needs a beginning, an end, a required response, and an invalidation condition. Without boundaries, the zone becomes an excuse for remaining attached to an idea. With boundaries, it becomes a planning tool that allows normal variation without removing accountability.
The Width of the Zone Depends on Context
There is no universal zone width that works for every instrument, timeframe, or trading approach. A higher-timeframe support area may cover a much larger price distance than an intraday reference, while a volatile market may require more room than one moving slowly. A tight consolidation can create a narrow area, whereas several large overlapping candles may produce a broader one.
The controlling timeframe should influence the boundaries because a daily structure naturally contains more movement than a one-minute setup. Current volatility also matters, as expanded candles and wider ranges may require greater tolerance before the location is considered broken. Calmer conditions may allow the trader to define a tighter and more precise area.
The evidence creating the zone must also be considered. A single clean swing may justify a narrow reference, while several nearby highs, lows, candle bodies, and wicks may support a wider area. Moving averages or other dynamic references can strengthen the zone when they overlap with visible price structure, but they should not be used to stretch the boundaries without a clear reason.
The intended trade horizon remains part of the decision. A scalper and a swing trader may recognize the same general location but define and manage it differently because their stops, targets, and expected holding periods are not the same. Regardless of the horizon, the zone should lead to a clear invalidation point and should never be widened merely because the trader does not want the idea to fail.
Build the Zone Before Price Arrives
A useful zone begins with the larger market structure. The trader identifies major swing highs, swing lows, range boundaries, previous breaks, and higher-timeframe areas that could affect the next decision. Only after that broader map is understood should the trader move closer and refine the boundaries.
The next step is to look for clusters rather than isolated transactions. Several reactions near one another often communicate more than a single wick, while candle bodies and wicks can provide different information about acceptance and rejection. Dynamic references such as moving averages may add context when they align with the visible structure.
The zone and its invalidation should be established before price arrives. The trader should also define the type of response required before an entry can be considered. After the market reacts, the entry, stop, target, and position size must be recalculated according to what actually happened rather than what the trader expected to happen.
A practical zone-building review should answer five questions:
- Structure: What previous market behavior makes this area meaningful?
- Boundaries: Where does the zone begin and end?
- Reaction: What behavior must occur before an entry is considered?
- Invalidation: What would show that the location no longer matters for this idea?
- Available room: Does the final entry leave enough space before the target or next obstacle?
This process replaces the search for a perfect entry price with a more useful set of decisions. The trader is identifying the area that matters, the evidence required there, and the point at which the idea becomes wrong. Precision remains part of the plan, but it is applied to boundaries and risk rather than to an unrealistic expectation that the market must reverse at one number.
Readers can continue with why where you enter matters more than what you predict to see how location affects the final trade structure.
The free trading tools and checklists can also help turn the zone, confirmation, and risk process into a repeatable pre-entry review. The goal is not to make every area tradable, but to make each decision clear before risk is accepted.
Final Thought
Good locations are rarely perfect prices. Support, resistance, prior highs and lows, moving averages, and market extremes usually create areas where participation may change rather than exact numbers the market must touch and obey. Thinking in zones makes the analysis better reflect how an auction actually behaves.
This approach can help traders avoid entering early because price is almost at the line, chasing because the market turned just before it, or abandoning a meaningful area because price moved slightly through the central number. The zone still does not guarantee a reaction. It tells the trader where observation should become more focused.
Define the area before price arrives, establish its boundaries, and decide what response would support or invalidate the idea. Then recalculate the entry, stop, target, and exposure according to the behavior that actually occurs. When the reaction does not provide enough evidence or the remaining trade structure is poor, stand aside.
A good location earns attention. The market’s response and the final trade structure determine whether it earns participation.
Educational content only. Trading involves substantial risk and is not suitable for everyone.