
Why “I’ve Seen This Work” Is Not Evidence
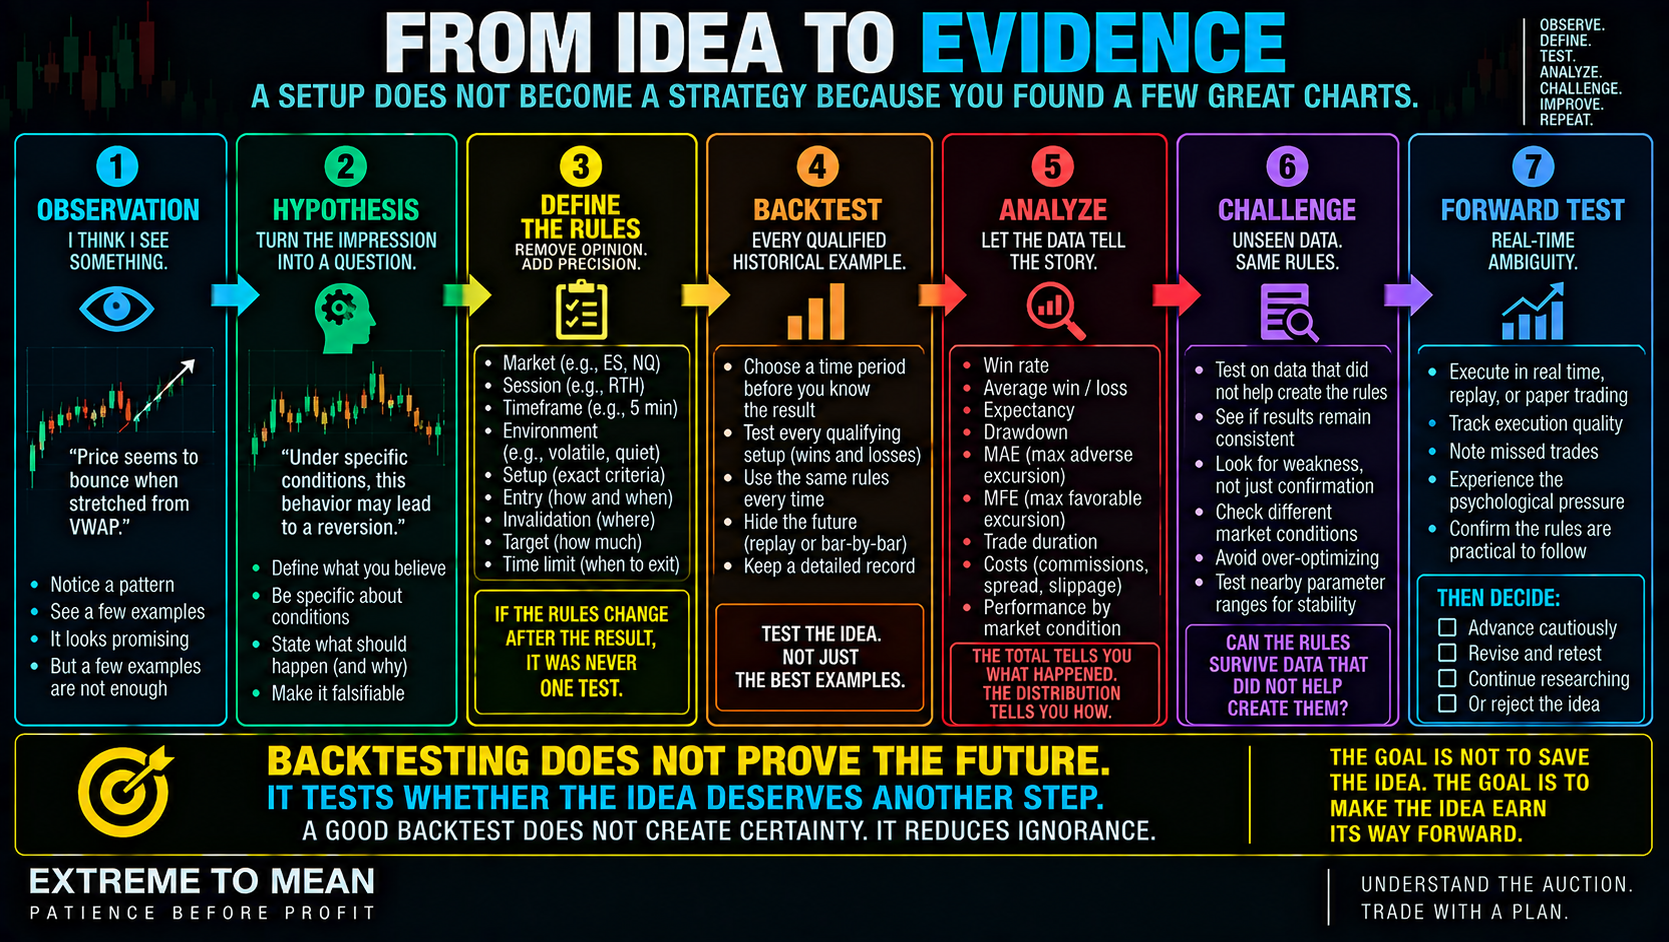
A chart pattern becomes a trading idea when you can describe it, but it becomes testable only when another person could apply roughly the same rules without needing to know what happened next. Words such as stretched, weak, clean, and ready can feel precise on a completed chart while changing meaning from example to example. Backtesting forces those impressions into definitions.
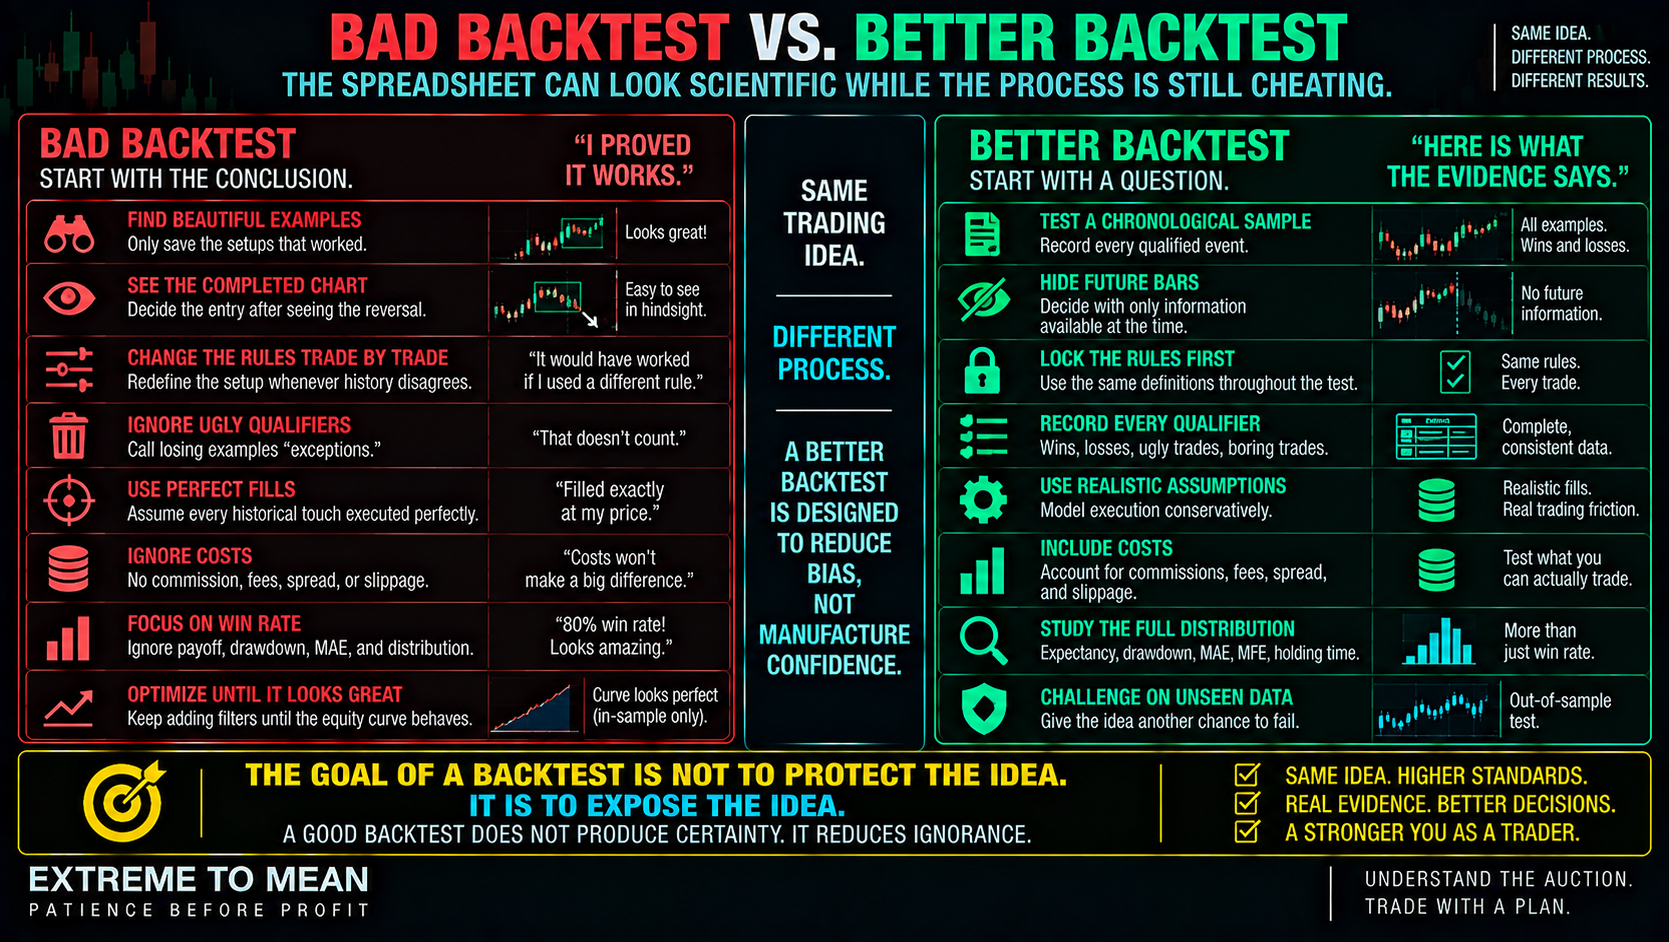
That distinction belongs at the heart of the Setup curriculum. If the setup definition changes whenever a historical example loses, the test is no longer evaluating one idea; it is evaluating a story that keeps rewriting itself to survive. A folder containing twenty beautiful screenshots proves that beautiful examples existed—not how frequently the setup failed.
The goal of a backtest is therefore not to protect the idea. It is to expose the idea to losing trades, ugly conditions, realistic risk, costs, and periods where the apparent behavior disappears. A good backtest does not produce certainty; it reduces ignorance.
Turn the Observation Into a Testable Hypothesis
“NQ seems to snap back after getting unusually stretched from VWAP” is an observation, not a backtest rule. What does unusually stretched mean, what qualifies as a snapback, which session counts, what market conditions are eligible, when does the trade begin, and when should the thesis expire? If the setup depends on words such as “usually,” “looks stretched,” or “feels weak,” the first job is to replace those words with rules.
The idea must also be capable of failing. “Buy when the market looks ready to bounce” cannot be honestly disproven because every losing chart can be reinterpreted afterward; defined conditions for market, session, timeframe, setup, entry, invalidation, target, and holding period create a historical decision that can actually be evaluated. If every losing example can be explained away after the fact, you are not testing a strategy—you are defending a story.
Define the Strategy Before You Look for Winners
The market, session, timeframe, and setup belong inside the strategy definition. ES and NQ should not be casually combined as though they are identical, an overnight futures setup is not automatically the same as one during regular U.S. equity hours, and a five-minute rule should not quietly become a one-minute rule whenever the smaller chart produces the prettier entry. The market window is part of the strategy.
Entry, invalidation, target, and maximum holding period need the same discipline. Counting a trade because price eventually reached the target while ignoring that it first moved far beyond any rational stop can make almost any reversion idea look good. The trade is not ready until the risk is clear, and the historical test should be held to the same standard.
Discretionary strategies can still be researched, but discretion needs boundaries. Another competent reviewer should be able to examine the same historical information and reach a reasonably similar conclusion about whether the setup qualified. Discretion is not the absence of rules; good discretion operates inside defined boundaries.
Choose the Sample Before You Know the Result
One of the easiest ways to fool yourself is to browse old charts and save only examples that look clean. A better process chooses a chronological period in advance and records every event that satisfies the locked rules, including losing, boring, and awkward trades. The trade you wish you could exclude is often the trade your backtest most needs.
The sample should also expose the idea to more than one kind of market. A high-frequency strategy might generate hundreds of trades during one month while experiencing only one volatility regime, whereas a slower strategy may produce fewer trades across several years and very different conditions. Number of observations and variety of environments are different questions.
This is where the lesson that market conditions change the quality of a setup becomes testable. If performance appears materially different in trends, ranges, quiet markets, or volatile markets, that may reveal something useful—but it should become another hypothesis to challenge, not a convenient explanation invented after seeing the results.
Hide the Future
Completed charts make historical entries look obvious because you already know which turns mattered. During manual testing, use replay or another process that reveals price progressively so the decision is made with only the information that would have existed at the time. If you can see the future candles while deciding whether the setup qualified, the future is already influencing your judgment.
Look-ahead bias is the technical version of the same mistake. Using a day’s final high in a morning decision, relying on a swing point that was confirmed only several bars later, or testing a repainting indicator from its cleaned-up historical display can all leak future information into the past. Do not let tomorrow help yesterday trade.
Record More Than Wins and Losses
A spreadsheet can be enough for a useful beginner backtest if the information is recorded consistently. Depending on the question, useful fields can include date and time, instrument, session, setup qualification, entry, initial invalidation, target, result, holding time, market condition, maximum adverse excursion, maximum favorable excursion, and notes. The objective is comparable data, not the largest spreadsheet possible.
Maximum adverse excursion asks how far the trade moved against the position before exit, while maximum favorable excursion asks how far it moved in the trade’s favor. Those measurements can reveal two strategies with similar win rates but completely different risk paths or available opportunity. For mean reversion especially, adverse excursion can expose the cost of entering too early even when many trades eventually return.
The distribution matters too. One enormous winner can create most of a strategy’s historical profit, while an occasional catastrophic loss can hide inside a long run of smaller winners. Total profit tells you what happened; the distribution tells you how it happened.
Win Rate Is Not Enough
An 80% win rate sounds terrific until the average winner is $50 and the average loser is $300. Eighty $50 wins equal $4,000, while twenty $300 losses equal $6,000 before costs, leaving the strategy negative despite winning four out of five trades. Win rate tells you how often you were right; it does not tell you what being right was worth.
A simple expectancy calculation helps combine frequency and magnitude:
Expected value per trade = (win probability × average win) − (loss probability × average loss)
Expectancy is still only one piece of the picture. Frequency, drawdown, losing streaks, costs, adverse excursion, and stability across different environments help explain what an edge actually is. A positive historical average is evidence worth investigating—not a promise about the next trade.
Include the Costs and Frictions Real Trading Creates
Historical charts do not charge commissions, exchange fees, spread, or slippage, but actual trading does. A strategy generating a tiny gross profit per trade can look impressive in a frictionless spreadsheet and become economically uninteresting once realistic execution assumptions are included. The market does not let you trade the backtest’s perfect theoretical price for free.
Fill assumptions matter as well. A historical touch of a limit price does not prove that your order would have filled, while fast markets can produce stop and market-order executions worse than a simplified model assumes. The goal is not to predict every fill perfectly; it is to avoid giving the historical strategy advantages the live trader would not have received.
Futures traders also need to know what historical data they tested. Contract rolls, continuous-series construction, timestamps, session definitions, missing data, and back-adjustment can matter when a strategy depends on exact prices, volume, VWAP, or other calculated references. A strategy cannot be more trustworthy than the data and assumptions used to test it.
Challenge the Result Instead of Optimizing It to Death
Small samples give luck more room to impersonate skill, but there is no universal number of trades that magically makes a result trustworthy. Sample adequacy depends on strategy frequency, variability, market regimes, and the question being studied. The useful question is not only how many trades? but also across how many different environments?
Overfitting creates a different problem. A trader gets mediocre results, adds a Tuesday-only rule, a precise indicator threshold, one exact stop distance, and several more filters until the historical equity curve finally looks magnificent. Every rule you add should solve a market problem—not merely improve a spreadsheet.
Nearby parameter behavior can be revealing. If one exact setting produces extraordinary results while values slightly above and below it collapse, the “perfect” number deserves suspicion; a relationship that remains reasonably stable across nearby settings is usually a more interesting research result. A strategy that works only at one magical setting may be telling you more about the test than the market.
Challenge the Finished Rules on Unseen Data
A clean research process separates data used to create the strategy from data used to challenge it. Develop the hypothesis on one historical block, lock the rules, and then apply those rules to another period that did not help create them. If you repeatedly peek at the supposedly unseen data while adjusting the strategy, it slowly becomes part of the development sample.
Rule changes create new versions too. If the first 100 examples use one entry rule and the next 100 use a different one, combining them into a single performance report hides the fact that two strategies were tested. Once you change the rules, you changed the strategy—label the version and test it accordingly.
The same logic applies to exceptions. You may exclude major news because the strategy contains a defined news filter, but you cannot delete a disastrous CPI trade after seeing the loss and then claim you “obviously” would never have traded it. Rules should determine which observations count before the outcome gives you a reason to dislike them.
Forward Testing Comes Next
A promising historical test earns another step, not a declaration that the strategy works forever. Forward testing through unseen replay, simulation, paper trading, or another appropriate low-risk stage exposes decision speed, execution difficulty, missed trades, discretionary ambiguity, and other problems a historical spreadsheet can hide. A backtest tests the rules against history; forward testing tests whether the process can actually be executed as designed.
Historical testing also cannot reproduce the full pressure of real money. Hesitation, overconfidence, recent losses, boredom, and urgency become part of the system once a person has to execute it in real time. A backtest can test the rules; it cannot fully backtest the person who will have to follow them.
The ETM Beginner Backtesting Framework
The objective is not to bury a beginner in statistics. It is to make it increasingly difficult for a weak idea to survive because of memory, hindsight, optimistic assumptions, or cherry-picked examples. The research process should behave more like the idea’s opponent than its defense attorney.
- Observe — What recurring market behavior have you actually noticed?
- Hypothesize — What do you believe tends to happen, under which conditions, and why might that make market sense?
- Define — Lock market, session, timeframe, environment, setup, entry, invalidation, target, and time limit.
- Sample — Choose the historical period before you know the result.
- Hide the future — Make each decision using only information available at that point.
- Record — Include every qualified observation consistently.
- Add costs — Use realistic commissions, fees, spread, slippage, and fill assumptions.
- Analyze — Look beyond win rate to expectancy, drawdown, MAE, MFE, holding time, and distribution.
- Segment carefully — Examine logically relevant conditions without creating endless filters.
- Challenge — Test the locked rules on data that did not help create them.
- Forward test — See whether the process survives real-time ambiguity and execution.
- Decide — Reject, revise and retest, continue researching, or cautiously advance the idea.
The condensed sequence is Observe → Define → Test → Record → Challenge → Forward Test → Decide. The better question is not, “Can I prove that this setup works?” Ask, “Have I designed a test where this idea is genuinely allowed to fail?”
Final Thought
A failed backtest can be an excellent research outcome. Discovering that a favorite setup has no meaningful historical advantage, collapses after costs, depends on one market regime, or fails on unseen data can prevent the trader from paying much more for the lesson later. Finding out an idea does not work before risking money is one of the best trades you can make.
A mixed result can be valuable too. Perhaps the idea performs poorly overall but behaves materially differently under one logically explainable market condition; that result creates another question to test rather than permission to declare a new rule true. A backtest can generate a hypothesis, but it should not automatically turn the story explaining the result into a fact.
Backtesting is a filter for turning vague observations into evidence. Define the idea before you know the outcome, record every qualifier, include the frictions real traders pay, challenge the rules on data that did not build them, and then forward test the process. A good backtest does not tell you what the next trade will do; it tells you whether the idea has earned the right to keep asking questions through the broader Extreme to Mean system.
Educational content only. Trading involves substantial risk and is not suitable for everyone.