
What the Index Can Hide
A trader sees the S&P 500 rising and naturally concludes that the market is strong. Yet an index is an aggregate, so one powerful sector can pull the headline higher while several economically sensitive groups weaken underneath it. Another session may look flat while financials, industrials, and discretionary are quietly improving.
That is why sector analysis belongs in the broader Market curriculum. The goal is not to replace price with eleven sector ETFs, but to understand which parts of the equity market are helping or resisting the move. Price tells us what the market is doing; sector rotation helps explain the composition of that behavior.
What Sector Rotation Actually Means
Sector rotation is a change in relative leadership among groups of companies with similar economic characteristics. Those groups respond differently to growth, rates, inflation, commodities, credit, and consumer behavior, so their relative performance changes through time. As some groups gain strength and others lose it, leadership rotates.
The word “rotation” can tempt traders into saying money literally flowed from one sector into another, but price performance alone does not prove a dollar-for-dollar transfer of capital. Unless actual fund-flow data is available, what we can directly observe is relative leadership and repricing. That is enough to improve context without inventing a story about who moved the money.
Leadership Is the Snapshot. Rotation Is the Change.
Leadership asks which sectors are strongest and weakest right now; rotation asks how that ranking is changing. Technology remaining number one for another day is leadership, but financials, industrials, and discretionary steadily climbing while technology loses ground is a changing leadership structure. Rotation therefore requires comparison through time, not merely today's winner.
That matters because one heatmap snapshot can make temporary noise look important. A sector that jumps to the top for five minutes and then falls back has not necessarily established durable rotation. A momentary move is not the same thing as persistent change in leadership.
Risk-On, Risk-Off, and Relative Performance
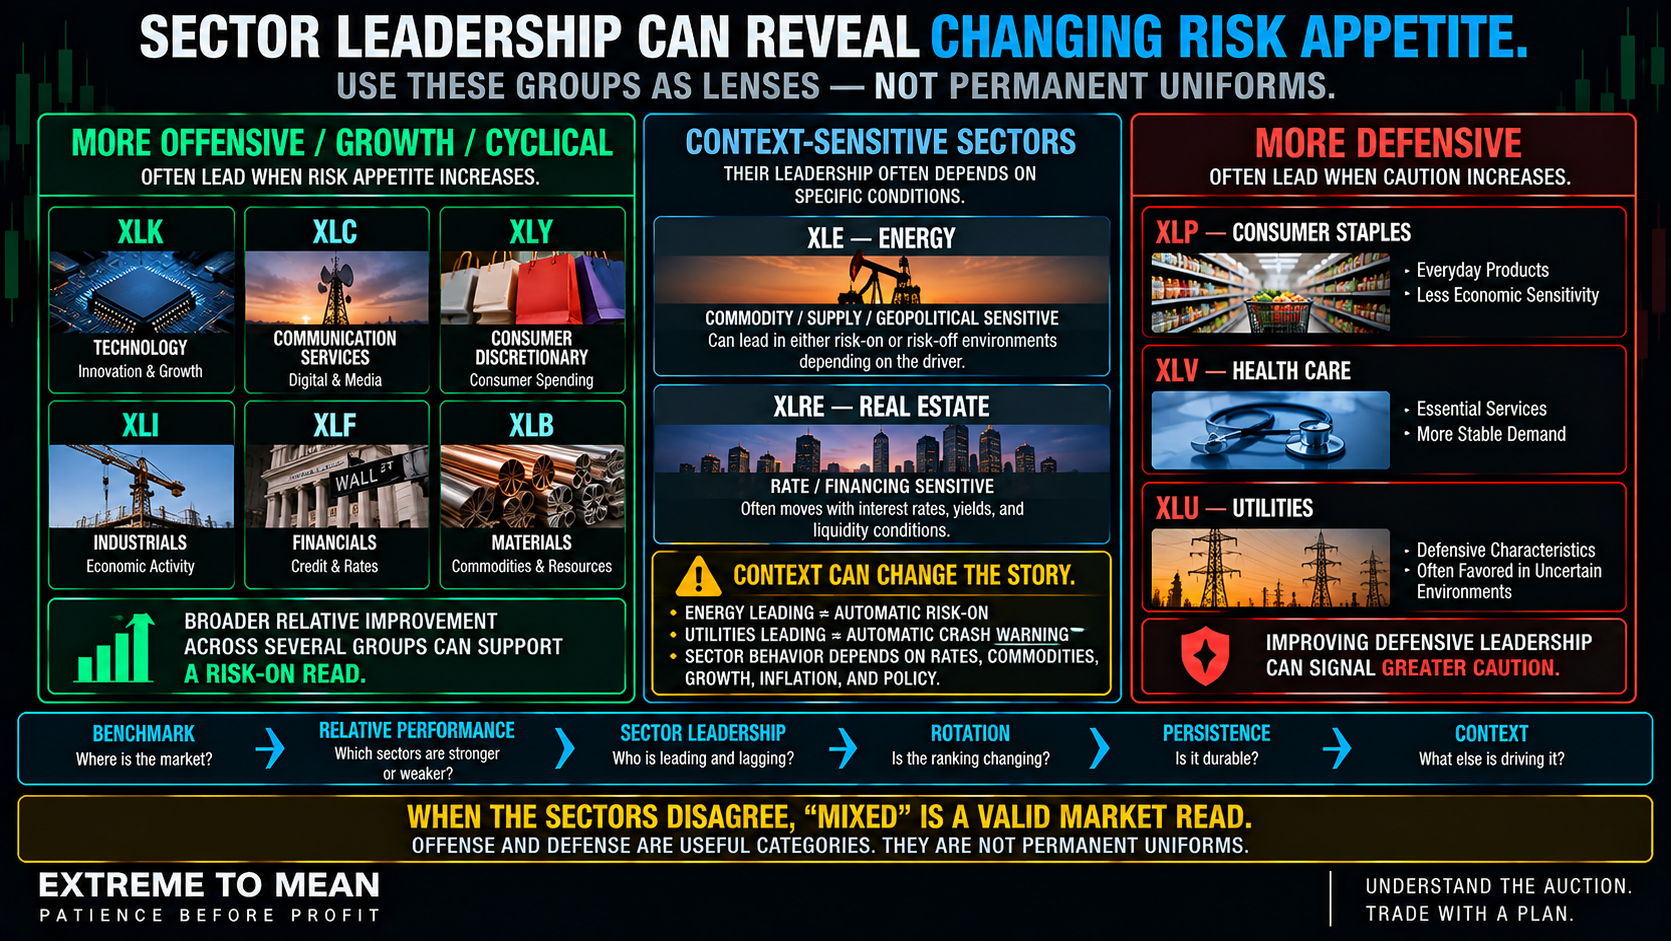
For teaching purposes, technology, communication services, discretionary, financials, industrials, and materials are often treated as more offensive or cyclical, while staples, health care, and utilities are commonly viewed as defensive. Energy and real estate are especially context-sensitive because commodities and rates can dominate their behavior. These are useful lenses, not permanent sector personalities.
A cleaner risk-on rotation often appears when several economically sensitive groups improve together while defensive sectors lose relative leadership. A cleaner risk-off rotation appears when staples, health care, or utilities climb in relative rank while growth and cyclical groups deteriorate. Neither pattern requires every sector in the group to move in the same absolute direction.
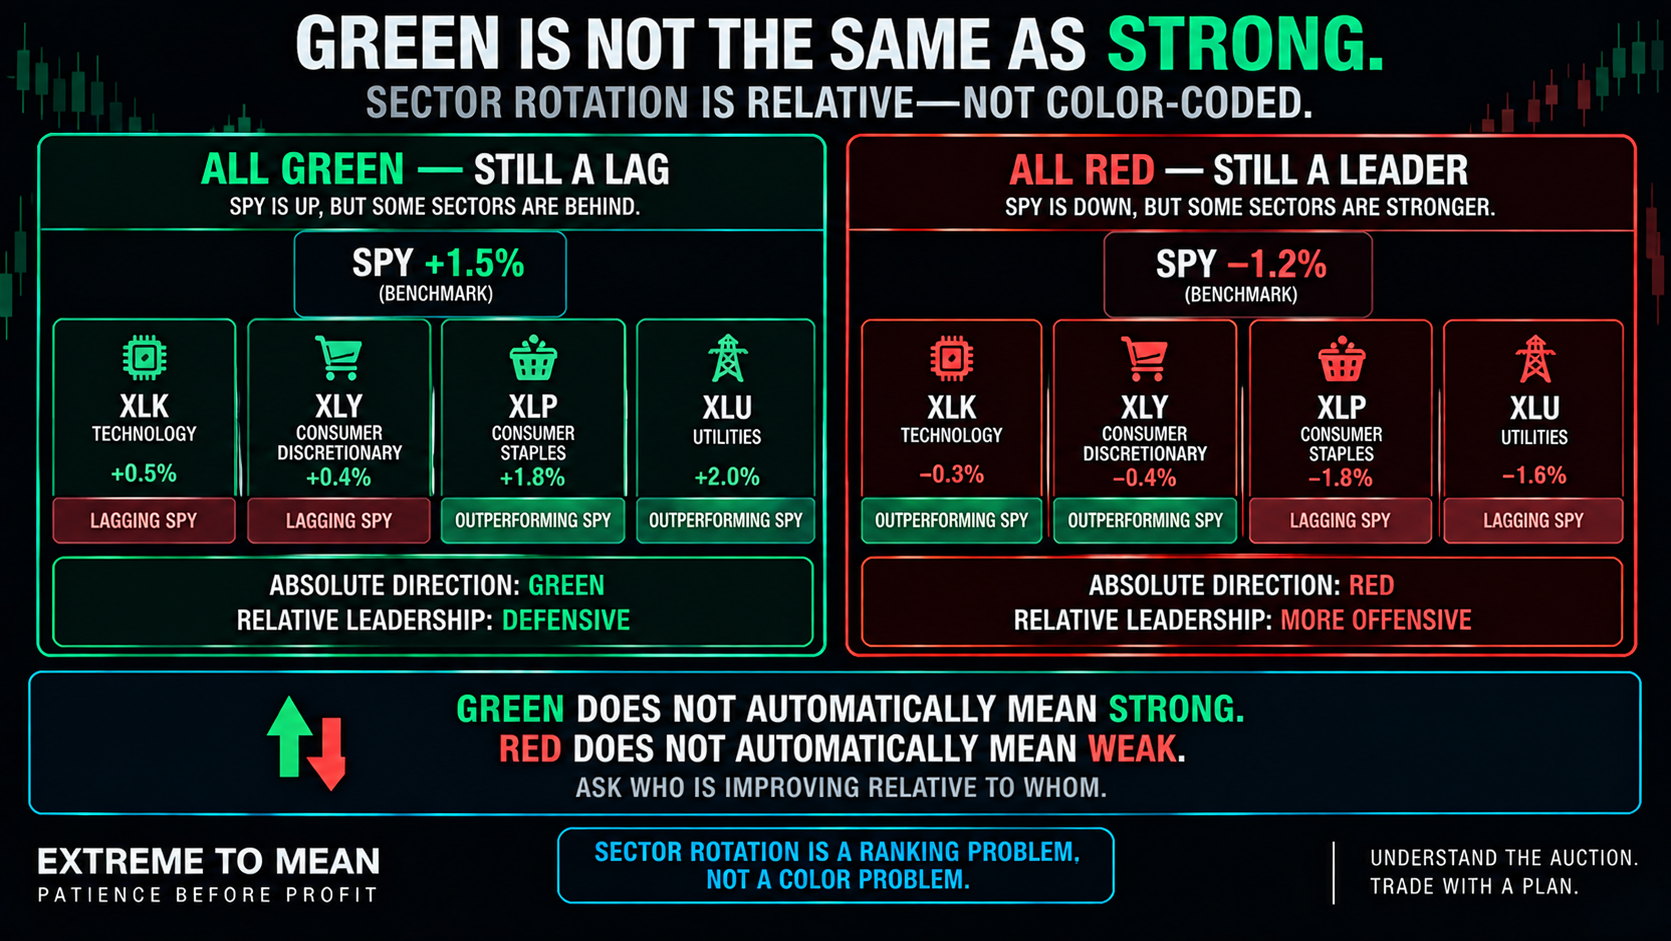
Suppose SPY is up 1.5% while XLK is up only 0.5%. Technology is green but lagging the benchmark; if SPY is down 1.2% while XLK is down only 0.3%, technology is red but outperforming. Green does not automatically mean strong, and red does not automatically mean weak.
Here, relative strength does not mean the RSI indicator. We simply mean performance compared with a benchmark or another sector, whether measured through return differences or a ratio such as sector ETF divided by SPY. Those comparisons are observational tools, not mechanical buy-or-sell signals.
Sector Rotation Is a Ranking Problem
A heatmap encourages binary thinking because green feels bullish and red feels bearish. Rotation becomes more useful when we ask where each sector ranks relative to the benchmark and whether that ranking is changing. The question is not “Is XLK up?” but “Is technology strengthening or weakening relative to the rest of the market?”
Broad leadership is more informative than one star sector. A cap-weighted index can rise on concentrated strength even while several cyclical groups lag. One strong sector can lift an index; a rotation tells us whether leadership is spreading.
Risk-On and Risk-Off Are a Spectrum
Real markets do not always organize themselves into a clean offensive-versus-defensive split. Technology may lead while utilities perform well because yields are falling, energy may dominate because of oil, or financials may strengthen while industrials lag. When the sectors disagree, mixed is a legitimate market read.
Mixed rotation is not analytical failure; it is information that the internal message remains unresolved. Traders often feel pressure to label every session risk-on or risk-off, but forcing a clean story onto contradictory sectors creates certainty the market has not earned. Sometimes the correct answer is simply that leadership is fragmented.
Sector Exceptions Need Context
Consumer discretionary versus consumer staples is one of the cleaner comparisons. Persistent XLY outperformance versus XLP can be consistent with improving risk appetite, while persistent XLP strength can point toward greater defensiveness. Even that pair remains one lens rather than a complete market signal.
Financials, energy, utilities, and real estate require more care because rates, credit, commodities, or geopolitical shocks can dominate their behavior. Sector leadership tells you what is moving; context helps tell you why.
Rotation Can Explain ES, NQ, and YM Divergence
If technology weakens while financials and industrials strengthen, NQ can lag, YM can hold up better, and ES can sit between them. That does not automatically mean the entire equity market has turned risk-off. Sometimes weakness in one index is broad market weakness, and sometimes leadership is simply moving somewhere else.
That is one reason market conditions change the quality of a setup. NQ weakness means something different when the rest of the market is deteriorating than when strength is rotating toward other groups. Sector context can explain the divergence without turning it into a prediction.
Do Not Turn Rotation Into a Fund-Flow Story
A rising sector ETF does not prove a specific quantity of money flowed into that ETF or identify institutions as the buyers. ETF price performance and actual fund-flow data are different evidence, so the cleaner language is that a sector is gaining relative leadership or being repriced more favorably. Sector rotation should reduce storytelling—not give us more material for it.
Persistence and Time Horizon Matter
Rotation can happen intraday, across several sessions, or over many weeks, so the observation horizon should match the decision. One sector jumping after a headline is not the same as several groups steadily improving relative to the benchmark, and a longer-term leader can lag briefly without losing its broader leadership. A momentary move is not the same thing as persistent rotation.
Use Rotation to Answer a Market Question
Sector rotation becomes useful when it answers a question you already have. If ES is breaking higher while technology, discretionary, financials, and industrials improve and defensives lag, the sector read can support the risk-on thesis without guaranteeing the breakout. If ES makes a new high while defensive groups climb the ranking and major cyclicals deteriorate, the move has weaker sector confirmation than the index alone suggests.
That does not mean “short immediately.” It means the market question deserves more scrutiny, which is consistent with the market comes first. Use sector rotation to confirm, contradict, or explain price—not to manufacture a trade.
Rotation Is Not Breadth, Volatility, or Trend
Sector rotation asks which groups are leading or lagging, while market breadth asks how many individual stocks are participating. Those questions can reinforce one another, but they are not interchangeable, and the next lesson will combine them more fully. P049 should stay focused on changing sector leadership.
Volatility is different because it describes the magnitude and pace of movement rather than relative sector preference. A market can have offensive leadership in either a low- or high-volatility regime, which is why volatility deserves its own framework. Trend is different again: price structure tells us what the index is doing, while sector rotation tells us which groups are helping or resisting that move.
The ETM Sector-Rotation Framework
Start with the benchmark, compare sectors relative to it, and identify the leaders and laggards before asking whether the ranking is actually changing. Then decide whether the shift looks offensive, defensive, or mixed and whether it persists long enough to matter. Only then should the sector read influence an already-defined market thesis.
- Benchmark: What is the broader index doing?
- Relative strength: Which sectors are outperforming or underperforming it?
- Leadership: Which groups rank near the top and bottom?
- Rotation: Is that ranking changing from the recent pattern?
- Grouping: Is leadership broadly offensive, defensive, or mixed?
- Persistence: Is the change durable enough for this decision horizon?
- Context: Could rates, oil, growth expectations, or another force explain an exception?
- Confirmation: Does the sector read support or challenge the index?
- Trade relevance: Does it improve an already-defined setup or tempt you to chase?
- Risk: Where is the actual trade wrong regardless of the sector read?
The condensed version is Index → Relative Strength → Leadership → Rotation → Persistence → Confirmation. That is cleaner than treating every green box as bullish and every red box as bearish. The trader's job remains evaluate → qualify → define risk → decide.
Final Thought
Sector rotation gives us a look beneath the headline index. It shows which parts of the equity market are gaining relative strength, which are losing it, and whether leadership is shifting toward offense, defense, concentration, or something mixed in between. That context can make ES, NQ, and YM behavior easier to understand.
It still does not tell us what the next trade must be. Rotation can lead price, coincide with it, or become obvious afterward, and even a strong sector read can accompany a losing trade. Context improves the question; it does not guarantee the answer.
Rank the sectors, compare them relatively, watch how leadership changes, demand persistence, and understand the mechanism behind the exceptions. Then use the sector read as one more piece of evidence about the market you are already evaluating, not as permission to chase the current winner. That evidence-first approach is part of the broader Extreme to Mean system.
Educational content only. Trading involves substantial risk and is not suitable for everyone.