
The Same Market Can Feel Completely Different
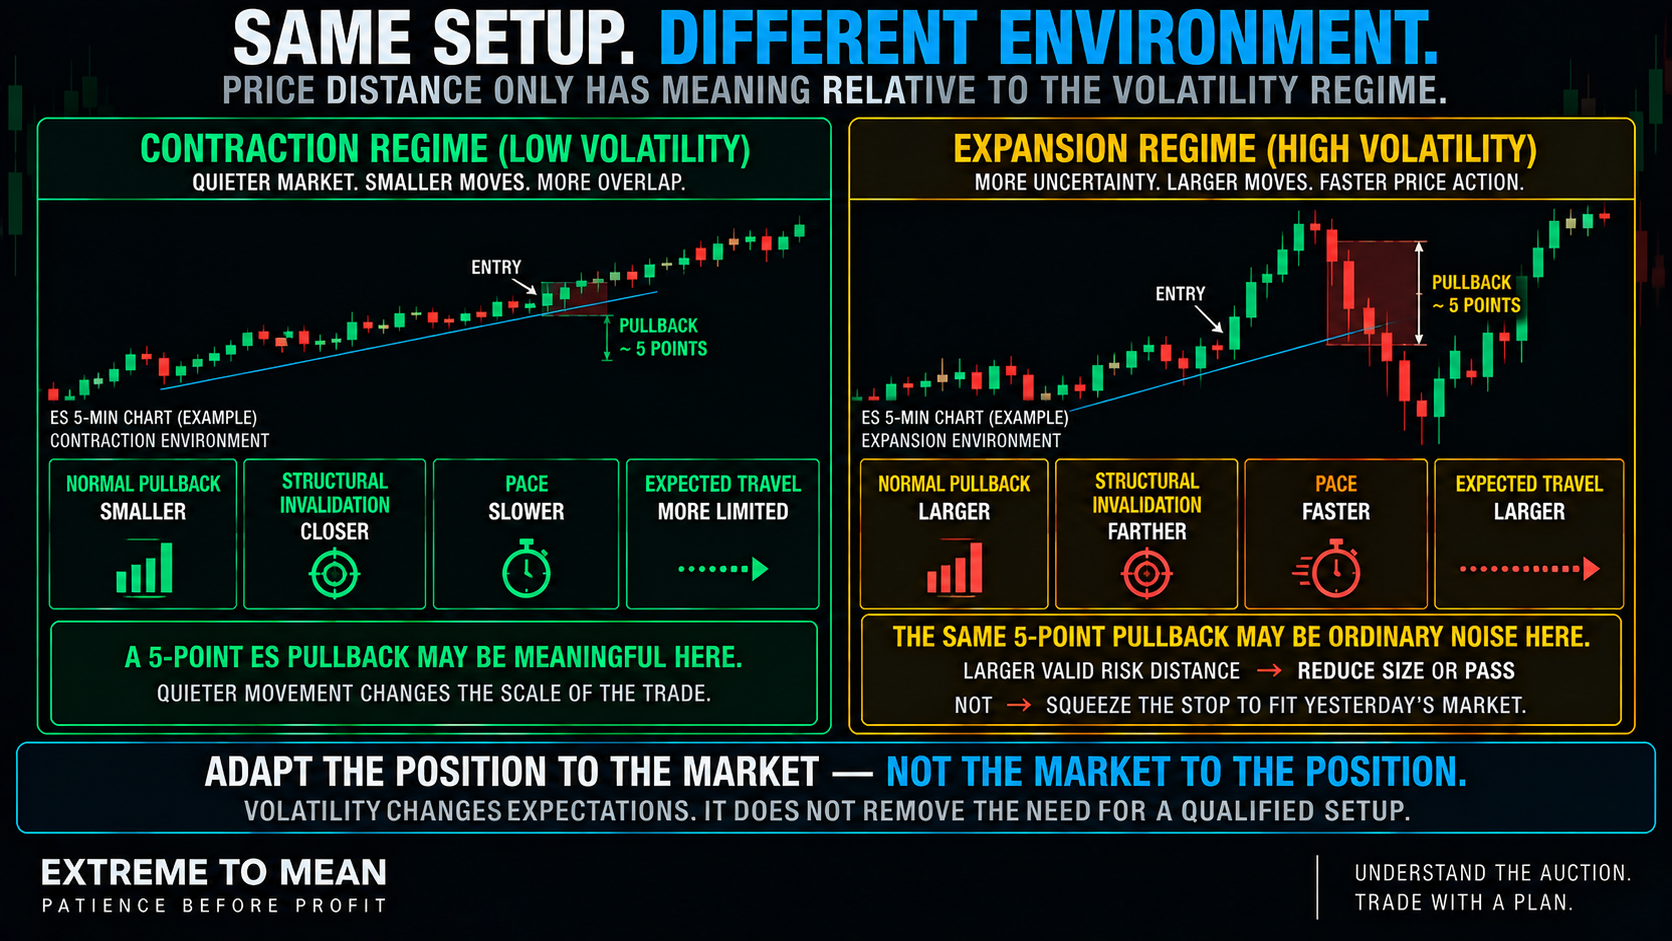
On a quiet morning, a ten-point ES move may feel important because price has spent hours rotating through a much smaller area. Pullbacks are shallow, candles overlap, and breakout attempts struggle to create distance. A stop several points away might sit comfortably outside normal movement.
On a more active day, ten points can become routine noise. Bars widen, pullbacks become deeper, price travels through levels faster, and yesterday’s stop distance may suddenly sit directly inside normal fluctuation. The instrument did not change, but the environment did.
That is the problem traders often miss. We build expectations from what the market has been doing and then keep using them after conditions have changed. The broader Market curriculum matters because entries only make sense inside the environment producing them.
What Volatility Actually Means
For our purposes, volatility is a broad description of how much price is moving and how widely prices are dispersing over a period of time. Higher volatility generally means larger or faster movement, while lower volatility generally means movement has become more contained. The measurement can be sophisticated, but the basic idea does not need to be.
Volatility does not mean bearishness, panic, or falling prices. A market can become highly volatile while rallying, selling off, or violently moving in both directions without making sustained directional progress. Volatility describes the size of movement—not the direction of movement.
Volatility Is Not Trend—or Volume
Trend describes directional structure, while volatility describes the magnitude and pace of movement. A strong uptrend can unfold through huge bars or through a slow staircase of smaller ones, and a range can be quiet or violently two-sided. A market can move aggressively without going anywhere for very long.
Volume is different too because it tells us how much actually traded. Heavy volume can produce surprisingly little movement when deep liquidity is available, while modest activity can move price quickly when opposing liquidity is thin. Volume measures activity; volatility measures movement; liquidity helps connect the two.
What Volatility Contraction Looks Like
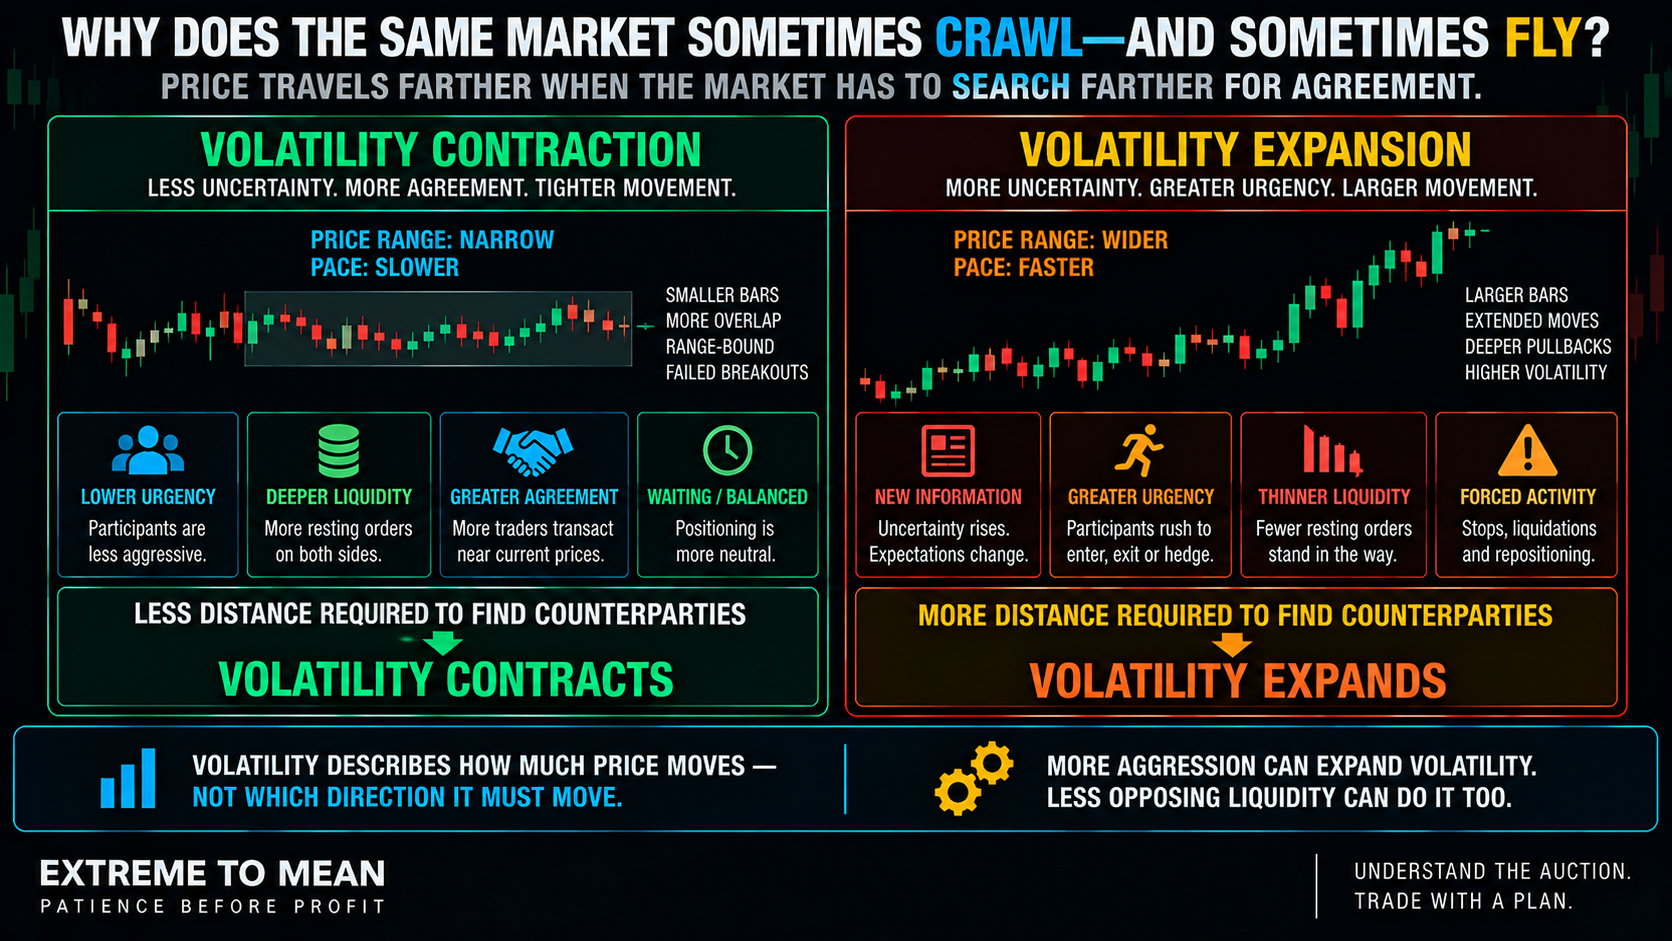
Volatility contraction means recent price movement is becoming relatively compressed. Traders may see smaller ranges, tighter candles, more overlap, slower movement, shorter rotations, and less distance traveled over the same amount of time. None of that means the market is broken or that “nothing is happening.”
The auction may simply require less movement to facilitate trade. Buyers and sellers may be relatively comfortable transacting around the current area, participation may be quieter, or traders may be waiting for new information. Deep enough opposing liquidity can also allow considerable business to occur without forcing price very far.
What Volatility Expansion Looks Like
Volatility expansion is the opposite shift: price begins covering more distance or moving through that distance faster than it had recently. Bars may widen, pullbacks grow, rotations become larger, breakouts travel farther, and price may move through references that previously contained it. The important word is relative.
A twenty-point NQ move can be meaningful in one regime and ordinary in another. Volatility therefore cannot be reduced to one fixed number that works across every market, timeframe, and session. We are comparing current behavior with the recent environment that gives that behavior context.
Volatility Changes in Regimes
Markets do not flip neatly from “low volatility” to “high volatility” at one obvious moment. Conditions can slowly compress, suddenly expand, remain highly active, calm only slightly, or transition several times during one session. Volatility is better treated as a changing regime than an on/off switch.
Quiet conditions also do not guarantee that an explosion is about to begin. Compression can persist much longer than expected, while elevated volatility can remain elevated across many sessions. The useful observation is that movement changes; the difficult part is that the current regime does not tell us exactly when the next one begins.
Why Volatility Contracts and Expands
Contraction often develops when the market can conduct business without traveling very far. Uncertainty may be relatively low, positioning may be balanced, participation may be less urgent, and enough liquidity may exist on both sides to absorb incoming activity. Price keeps finding willing counterparties close to where it is already trading.
Expansion develops when that balance changes. New information, greater uncertainty, aggressive repositioning, forced exits, or thinner liquidity can require price to travel farther before enough opposing interest appears. Price moves farther when the market has to search farther for agreement.
That connection becomes much clearer after understanding passive and aggressive orders. Aggressive traders demand execution, but the distance price travels depends partly on the liquidity available to meet them. Volatility can rise because more traders suddenly want to act—or because fewer traders are willing to stand in the way.
The Same Order Flow Can Produce Different Movement
Imagine two sessions with similar aggressive buying. On the first day, sell liquidity is deep and keeps replenishing, so buyers transact heavily while price rises only gradually. On the second day, offers are thin, so similar buying can consume several price levels and push the market much farther.
This is why large price movement does not automatically prove enormous aggressive volume. Market movement comes from the interaction between urgency and available liquidity, not one side of the equation alone. The broader auction-and-liquidity framework helps explain why identical activity can create very different price responses.
Why News Can Change Volatility So Quickly
Ahead of scheduled information, some participants may become less willing to leave resting orders exposed because the market’s value could change rapidly. When the release arrives, expectations can shift, marketable activity can surge, stops can trigger, hedges can adjust, and available liquidity may already be thinner. That combination can create rapid repricing.
The headline itself is not the entire story. A modest surprise can produce an outsized reaction when traders were positioned for the opposite outcome, while seemingly important news can create little movement when it was already expected. Reaction size depends on information, expectations, positioning, participation, and liquidity together.
Expansion Can Feed on Itself—Temporarily
Fast movement can create additional activity because stops trigger, traders reduce exposure, hedges change, and uncertainty increases. At the same time, some liquidity providers may become less willing to stand in front of the move. More urgency combined with less opposing liquidity can temporarily accelerate the expansion.
That process cannot intensify forever. Positions adjust, forced activity decreases, fresh liquidity arrives, and participants gradually become more comfortable trading around a new area. As two-sided trade improves, the amount of distance required to find agreement can begin shrinking again.
High Volatility Does Not Mean Clean Trend
A market can rally sharply, sell off even farther, and then rally again while remaining inside a broad range. That is high volatility with weak directional persistence, which can be brutal for a strategy expecting clean continuation. More movement does not automatically mean easier trading.
Low volatility is not automatically bad either. A market can climb steadily through smaller bars and controlled pullbacks without producing dramatic expansion. What matters is whether the movement fits the assumptions behind the strategy being traded.
One-sided and two-sided volatility therefore deserve different treatment. One-sided expansion produces large movement with relatively limited retracement, while two-sided expansion produces large movement in both directions and can create whipsaw. More movement creates more opportunity only when the movement fits the strategy.
Volatility Changes Strategy Fit
The same setup can be reasonable in one volatility regime and poorly matched in another. A breakout strategy may struggle when the market repeatedly returns to balance, while a mean-reversion idea can become dangerous when expanding volatility allows price to extend much farther than recent history suggested. That is why market conditions change the quality of a setup.
| Market Environment | Practical Challenge |
|---|---|
| Low volatility + range | Breakouts may struggle for follow-through |
| Low volatility + orderly trend | Movement can be slow but structurally clean |
| High volatility + trend | More directional distance, but larger pullbacks and structural risk |
| High volatility + range | Large two-sided movement can create whipsaw |
| Transitioning volatility | Old expectations can become unreliable quickly |
The table does not rank one environment as good and another as bad. It asks a more useful question: does the current environment fit what this strategy was designed to exploit? Volatility is context, not permission to trade.
Volatility Changes What “Normal” Looks Like
A five-point ES pullback can be meaningful during a compressed session and ordinary noise when ranges have tripled. Price distance only has meaning relative to the environment around it. Using a fixed definition of “large,” “small,” “extended,” or “normal” ignores the market that produced the movement.
That matters for stops as well. The answer to expanding volatility is not automatically to widen every stop; invalidation still belongs where the trade thesis is actually wrong. If that structurally valid distance becomes much larger, the trader then has to decide whether position size can be reduced or whether the trade should simply be passed.
Targets change too because realistic travel changes with the regime. A huge fixed target can become unrealistic during contraction, while a tiny fixed target may no longer make sense if valid risk distance has expanded dramatically. The goal is not to improvise rules after entry; it is to know what environment the strategy was built and tested to handle.
Volatility Changes Risk Before It Changes Opportunity
Rapid movement attracts attention because every candle appears to contain more opportunity. The less exciting truth is that expanding volatility can also mean larger normal fluctuations, more slippage, faster adverse movement, and less time to correct execution mistakes. Opportunity may expand, but so can the cost of being wrong.
This is why quantity becomes such an important lever. If the market now requires substantially more structural distance, keeping the same contract size can increase financial risk even though the setup itself has not changed. The cleaner process is define invalidation first → measure the required distance → size or pass accordingly.
Volatility also changes the cost of chasing. During rapid expansion, a short hesitation can leave the trader dramatically farther from the original location, with worse target room and awkward invalidation. The move becoming more exciting does not make the late entry better.
High Volatility Creates Urgency. Low Volatility Creates Boredom.
Expanding markets can create FOMO because waiting suddenly feels expensive. Traders see price travel quickly, assume every move must be captured, and start reacting instead of evaluating. The speed of the market begins dictating the quality of their decisions.
Compressed markets create the opposite pressure. Traders become bored, tiny fluctuations start looking important, and standards gradually fall because they want the market to provide something to do. High volatility creates urgency; low volatility creates boredom, and both can pressure a trader into bad decisions.
Sometimes the discipline problem therefore begins with an expectation problem. The trader expects yesterday’s calm stop and target behavior in today’s expansion, or yesterday’s huge movement in today’s compression. Recognizing the regime earlier can prevent the emotional reaction from becoming the first clue that something changed.
You Do Not Need an Advanced Volatility Model
ATR can help quantify how large recent ranges have been, but it should not become a directional forecast. Traders can also compare bar size, session range, overlap, pace, pullback depth, and how easily price is moving through important levels. Observation should come before dependence on one indicator.
VIX is another useful but different concept because it reflects options-implied expectations for S&P 500 volatility rather than simply reporting the current intraday ES range. Time of day matters too because participation and liquidity can change between overnight trade, major releases, the U.S. open, midday, and the close. None of those references replaces watching what price is actually doing now.
The ETM Volatility Framework
The goal is not to label volatility perfectly. It is to notice when the assumptions behind the trade no longer match the environment. A simple review can keep the decision centered on observable behavior.
- Range: Is price traveling farther or less than it has recently?
- Pace: Is it moving through those prices faster or slower?
- Overlap: Are bars compressing together or expanding away from one another?
- Participation: Has market activity meaningfully changed?
- Liquidity: Does price move easily through levels or repeatedly stall?
- Catalyst: Is news, a session transition, positioning, or another event changing behavior?
- Regime: Does the market look compressed, normal, expanding, or transitional?
- Strategy fit: Does the current behavior support the strategy being considered?
- Risk: Has normal movement changed the structural distance the trade requires?
- Expectations: Are the target, pace, frequency, and pullback assumptions still realistic?
The condensed sequence is Range → Pace → Liquidity → Regime → Strategy Fit → Risk. It deliberately puts volatility before the trading decision rather than turning volatility into the decision itself. That keeps the hierarchy consistent with the ETM principle that the market comes first.
The better question is not, “Is volatility high or low?” Ask, “Compared with the recent environment, how is movement changing—and does my strategy still fit what the market is doing now?” That question is far more useful than trying to predict the exact moment contraction becomes expansion.
Final Thought
Volatility expands and contracts because the market’s need to reprice keeps changing. When uncertainty rises, positioning shifts, aggression increases, or opposing liquidity becomes thinner, price may need to travel farther and faster to find willing counterparties. When information becomes better understood and two-sided liquidity improves, movement can compress again.
Neither environment is automatically good or bad. Expansion can produce clean directional movement or violent whipsaw, while contraction can produce frustrating chop or an orderly trend. Movement and tradability are not the same thing.
Recognize the environment before demanding that a setup behave the way it did yesterday. Adjust expectations, let invalidation determine the required distance, adapt exposure when necessary, and pass when the environment no longer fits the strategy. That market-first approach is part of the broader Extreme to Mean system.
Educational content only. Trading involves substantial risk and is not suitable for everyone.