
Volume Profile can make a chart look wonderfully organized. POC, VAH, VAL, high-volume nodes, and low-volume nodes give traders clear references to mark, but the danger begins when every reference is automatically converted into a future support or resistance line. A level does not become tradable merely because the indicator drew it.
Volume Profile tells you where the market did business. Current price action tells you whether that history still matters now.
Volume Profile reorganizes market activity by price rather than simply showing when volume occurred. That makes it useful for seeing where significant business was conducted, where activity was relatively light, and how volume was distributed across a selected session or range. What it does not do is promise what the next auction must do when price returns.
That distinction belongs inside the broader Market curriculum. The useful sequence is PROFILE → PRIOR ACTIVITY → CURRENT CONTEXT → APPROACH → RESPONSE → TRADE DECISION, not PROFILE LEVEL → BUY / SELL. The profile gives the trader a historical reference; the current market still has to tell you how that reference should be interpreted.
Volume Profile Is a Map, Not a Collection of Magic Lines
Traditional volume bars mainly organize trading activity by time. Volume Profile reorganizes that information across price, helping the trader see where more or less activity took place during the period being measured. For futures, high volume tells you that many contracts changed hands there; it does not tell you by itself that buyers defended the price or sellers controlled it.
That first guardrail matters because traders often attach directional stories to volume that the data itself does not prove. Heavy trading at a price means substantial participation occurred, but every completed transaction involved both a buyer and a seller. The market's later behavior is needed to determine whether that old participation area still matters and in what way.
A cleaner way to read the profile is to ask, “What does this area tell me about the previous auction?” Then ask a second question when price returns: “What is the current auction doing with that information?” Context comes before the candle, and it also comes before assuming that a historical volume reference must produce a specific reaction.
What POC, VAH, VAL, HVNs, and LVNs Actually Tell You
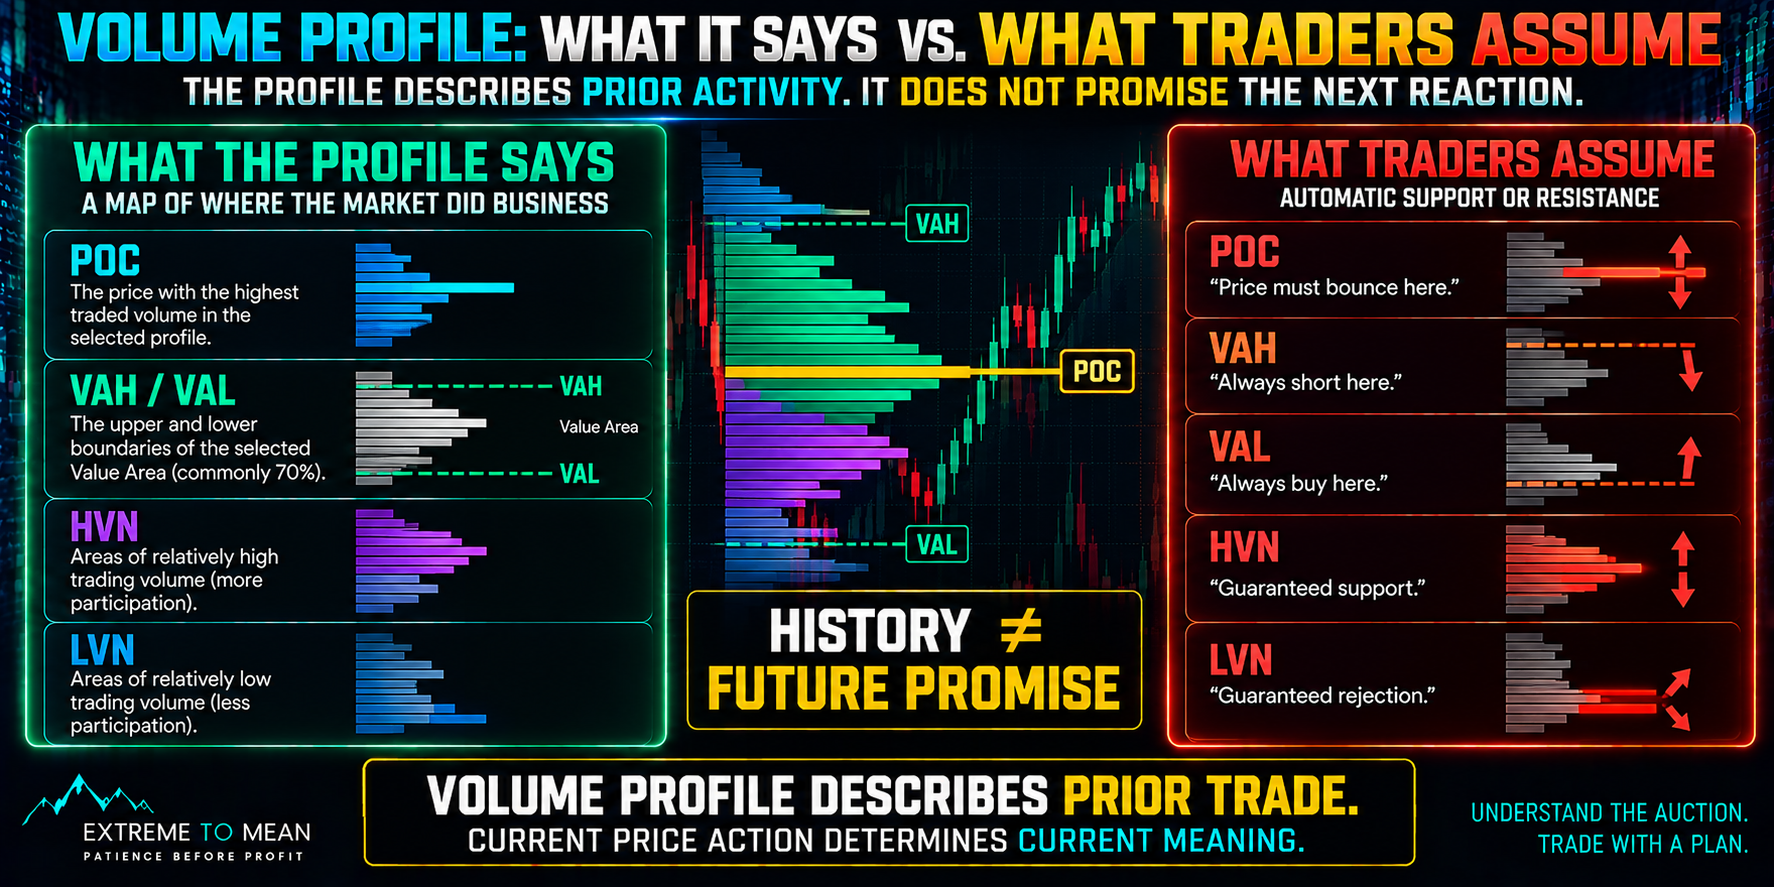
POC, or Point of Control, identifies the price level with the greatest traded volume inside the selected profile. It tells you where the most business occurred during that defined period. It does not automatically tell you that buyers own the level, sellers own the level, price must return there, or price must bounce when it does.
VAH and VAL are the upper and lower boundaries of the selected Value Area calculation. With a commonly used 70% setting, that area contains roughly the selected share of the profile's volume, but the percentage itself is configurable rather than a natural law of the market. The boundaries are interesting because they separate areas of prior participation, not because VAH must become resistance or VAL must become support.
High-volume nodes, or HVNs, show areas where relatively heavy trading previously occurred. That can suggest prior acceptance or two-sided participation, but it does not guarantee that the market will defend the same area on another visit. A new auction under different conditions may trade directly through yesterday's heavy-volume area.
Low-volume nodes, or LVNs, show areas where comparatively little activity occurred inside the chosen profile. Price may previously have moved through those areas quickly, which can make them useful contextual references between heavier participation zones. An LVN describes how the market behaved there before; it does not dictate whether the next visit must reject, accelerate, or reverse.
The Profile Depends on the Period You Chose
There is no single universal POC floating inside the market. There is the POC of a particular profile, which might represent one session, several sessions, a fixed range, a visible chart range, or some other defined period. Change the period and the distribution can change with it.
The same question applies to VAH, VAL, HVNs, and LVNs. VAH of what period? VAL of what period? High volume relative to what range? Before asking whether a profile reference matters now, ask what market period created it and why that period is still relevant.
This is also why platforms can produce somewhat different-looking profiles. Data source, session definition, selected range, row size, resolution, and calculation settings can influence exactly where the histogram and boundaries appear. Treat the output as a structured measurement of a chosen period, not as an exact physical barrier embedded permanently in the market.
Read the Approach Before You Read the Level
Suppose yesterday's VAH sits above current price. The beginner sees the line and thinks, “VAH equals resistance, so I should short when price gets there.” That skips the most important information: how the current market is arriving.
Price approaching slowly inside a balanced session is different from price driving upward with expanding range and persistent directional pressure. A late-stage extension into the same area can also be different from a fresh breakout that is just beginning to reprice the market. Market conditions change the quality of a setup, even when the historical reference itself is identical.
So read the approach before deciding what the level means. Is price trending, balancing, accelerating, slowing, or chopping through the area repeatedly? The label on the level may be the same; the auction arriving at it may not be.
Acceptance and Rejection Matter More Than the Touch
A touch of a profile level is only an interaction. What happens around the area can be far more informative than the fact that price reached it. The trader should watch whether the market rejects the area, accepts beyond it, passes directly through it, reclaims it, or begins building activity around it.
Consider prior VAH. Price briefly trades above it, returns quickly below, and fails to conduct meaningful business above the prior boundary; that behavior may support a rejection interpretation. If price instead moves above VAH, remains there, and continues trading comfortably above it, the old boundary may be losing its meaning as resistance.
A two-candle pause is not enough to declare resistance confirmed simply because it happened at VAH. The better question is, “Did the market reject prices above VAH, or is it beginning to accept them?” Location is the first filter, but location still requires current behavior before it becomes a trade.
Too Many Profile Levels Destroy Their Usefulness
Volume Profile makes it easy to create a chart full of references. Today's developing POC, yesterday's POC, weekly POC, VAH, VAL, several HVNs, several LVNs, prior-session profiles, and composite profiles can quickly cover almost every area of price. Once enough lines exist, hindsight can make nearly every reversal look as though it happened “at a level.”
That creates a serious interpretation problem. A chart with enough levels will always have a level near the reversal, but proximity does not prove causation or relevance. The trader needs hierarchy based on the period, current structure, market condition, direction of approach, and actual response.
Old levels also should not remain important merely because the platform can extend them indefinitely. New value can develop, news can reprice the market, a different balance can form, or price can repeatedly trade through the old reference until it carries little useful information. Historical relevance should be earned again by current behavior.
A Volume Profile Level Can Be Useful Even When It Fails to Hold
Suppose yesterday's session develops a clear POC around 6000. The next morning price opens above it and trends lower, while a beginner has labeled 6000 SUPPORT simply because it was yesterday's highest-volume price. When price reaches 6000, the trader buys immediately expecting the POC to produce a bounce.
Instead, price trades through 6000, remains below it, and continues conducting business there. The trader concludes that “Volume Profile failed,” but the profile did exactly what it was supposed to do: it identified where the most volume occurred yesterday. It never promised today's market would defend that price.
A second trader sees the same POC but asks different questions. How is price arriving? What happens at 6000? Does the market reject the area or accept below it? When the market trades through and continues building activity underneath, the old POC still supplied useful information because it helped reveal that today's auction was willing to conduct business below a previously important participation area.
That is one of the most useful mindset shifts in Volume Profile analysis. A profile level can be informative even when price does not bounce from it. The goal is not to make every historical reference hold; the goal is to understand what the market's response to that history is telling you now.
A Profile Level Is Context, Not a Setup
A historical profile area can improve a trade idea without being the trade itself. Price may arrive at meaningful prior participation, reject it cleanly, and still fail to produce the actual setup, invalidation, or acceptable risk your process requires. Profile location supports qualification; it does not replace qualification.
This is the same distinction behind a setup not being just a signal. POC, VAH, VAL, an HVN, or an LVN is one piece of information, not complete entry permission. The trader still needs to evaluate the broader environment and decide whether there is a coherent thesis with a place where that thesis is wrong.
The profile should therefore narrow attention, not automate action. When price reaches a meaningful area, the trader's job changes from “there is a line here” to “what is the market telling me at this location?” That shift turns Volume Profile from chart decoration into a contextual tool.
The ETM Volume Profile Context Framework
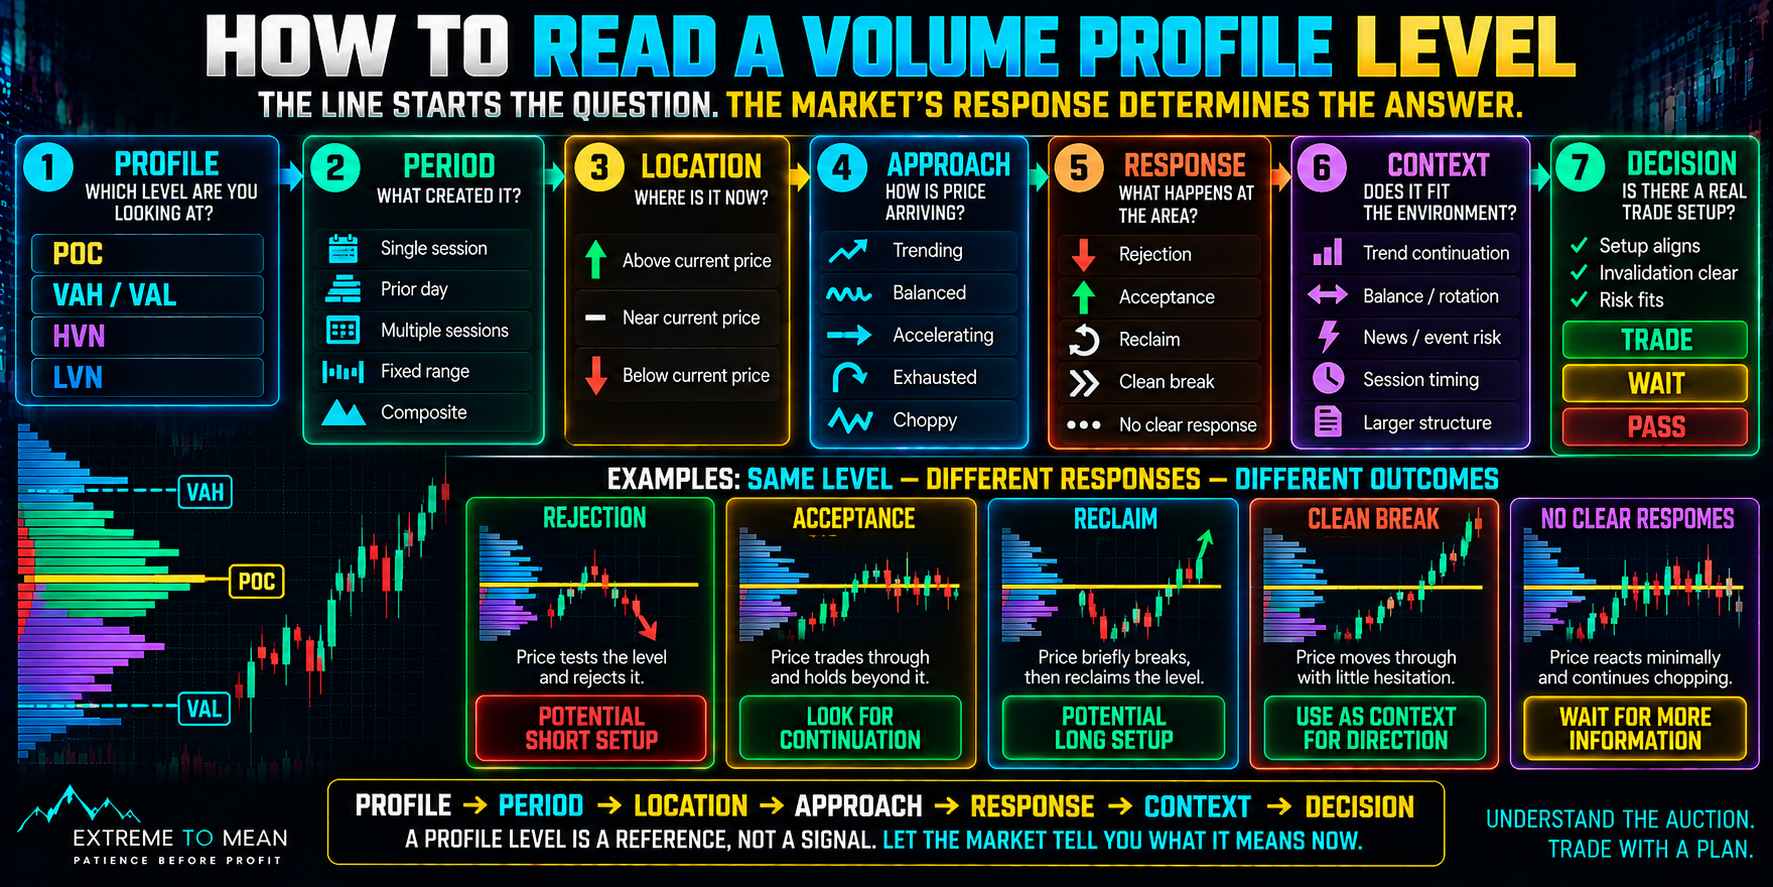
Use this sequence before treating any profile reference as actionable:
- PROFILE — What am I looking at: POC, VAH, VAL, HVN, or LVN?
- PERIOD — What session or range created it?
- LOCATION — Where is the area relative to current structure?
- APPROACH — How is price arriving: trend, balance, acceleration, exhaustion, or chop?
- RESPONSE — Is price rejecting, accepting, reclaiming, passing through, or consolidating?
- CONTEXT — Does that behavior make sense inside the broader market condition?
- DECISION — Does an actual setup with clear invalidation and acceptable risk exist: TRADE / WAIT / PASS?
The framework prevents a historical level from making the decision by itself. It also forces the trader to identify which period produced the reference instead of accumulating POCs and Value Areas without hierarchy. The level provides the question. Price behavior provides the answer.
Before acting, ask one final question: “Am I trading because the market is responding meaningfully here, or because a line happened to be drawn here?” If the only reason for the trade is the label beside the level, the analysis is incomplete. When a profile-heavy chart begins encouraging trades everywhere, trading the chop can easily masquerade as sophisticated market analysis.
Final Thought
Volume Profile becomes more useful when you stop asking whether every line is support or resistance. POC, VAH, VAL, HVNs, and LVNs describe where the market previously did—or did not do—business during a defined period. Their relevance today comes from how the current market approaches and responds to that history.
Use the profile to identify areas worth watching, not outcomes you believe the market owes you. Let current acceptance, rejection, structure, setup quality, and risk determine whether the historical reference becomes worth trading. Do not trade the line because the market cared about it yesterday; watch what the market tells you when it gets there today.
Educational content only. Trading involves substantial risk and is not suitable for everyone.