
Many beginners look at a chart and see candles, colors, indicators, and constant movement. Price rises, price falls, and every push can appear important when it is viewed by itself. Without structure, the chart can feel like a collection of unrelated movements rather than a sequence that can be understood.
Market structure gives that movement a basic language. Instead of asking only whether the latest candle was green or red, the trader begins examining whether price is forming higher highs, higher lows, lower highs, or lower lows. The trader can then recognize whether the existing pattern is continuing, weakening, or beginning to break.
Smart Money Concepts Explained builds on these observable structure ideas while separating them from assumptions about who caused a move.
At Extreme to Mean, this belongs in the market context lessons because structure comes before setups. Before a trader studies entries, indicators, or reversion-to-mean opportunities, they need to understand what price is doing within the broader sequence. A setup has more meaning when the trader knows the structure surrounding it.
Market Structure Starts With Swings
Price rarely moves in a perfectly straight line. Even during a strong trend, it tends to advance in waves by pushing, pausing, pulling back, and then pushing again. The visible turning points created by those movements are commonly called swing highs and swing lows.
A swing high forms where price pushes upward and then turns lower, while a swing low forms where price moves downward and then turns higher. These swings reveal the rhythm of the market and provide reference points that can be compared with one another. Once the trader sees those turning points, the chart becomes easier to organize.
The exact method for identifying a swing can vary by trader, timeframe, and strategy. A beginner does not need to debate every small turn or label every candle. The first goal is simply to recognize the most visible areas where price changed direction.
Once those swings are identified, the trader can begin asking whether the highs are moving higher or lower and whether the lows are holding or breaking. Those questions provide more context than reacting to each candle independently. A single candle can look dramatic, but a sequence of swings shows whether price is actually making progress.
This connects directly to the Extreme to Mean principle that context comes before the candle. A candle becomes more meaningful when the trader understands where it appears within the larger structure. Without that context, ordinary movement can easily be mistaken for a significant change.
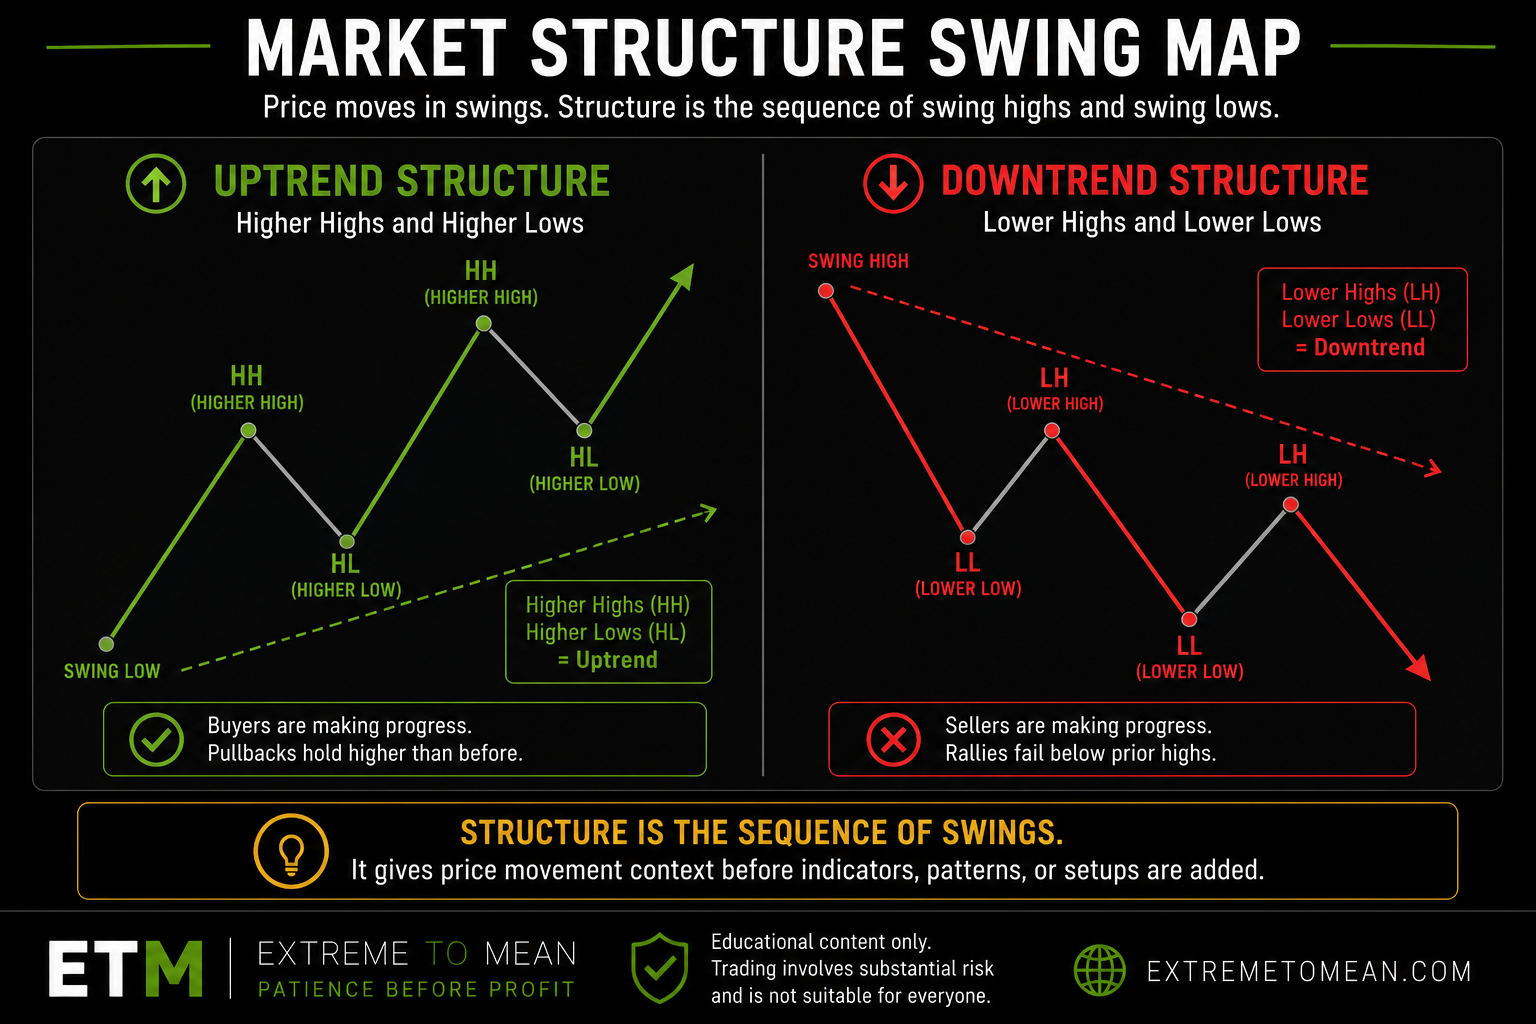
Higher Highs and Higher Lows Show Uptrend Structure
An uptrend is commonly described as a sequence of higher highs and higher lows. A higher high forms when price pushes above the previous swing high, while a higher low forms when the next pullback holds above the previous swing low. Together, those movements show that buyers are continuing to make progress.
The sequence usually develops as price advances, pulls back without breaking the prior important low, and then pushes above the previous high. If that pattern continues, each pullback holds at a higher level and each advance reaches a higher level. The market is not moving upward in a straight line, but its swings are gradually progressing higher.
This does not mean price will continue rising forever or that the next pullback is guaranteed to hold. Market structure describes the pattern currently visible; it does not promise what will happen next. The trader still needs to watch whether the sequence remains intact.
For beginners, the important lesson is that an uptrend is more than a group of green candles. A market can produce one strong bullish candle inside a weak or declining structure, just as it can produce several red candles during a normal pullback inside an intact uptrend. Candle color describes a small piece of movement, while structure explains how that movement fits into the broader sequence.
The better question is therefore not simply, “Was the last candle bullish?” It is, “Is price still producing higher highs and higher lows, or has that pattern begun to weaken?” That shift helps the trader evaluate the market instead of reacting to its most recent move.
Lower Highs and Lower Lows Show Downtrend Structure
A downtrend is commonly described as a sequence of lower highs and lower lows. A lower low forms when price breaks beneath the previous swing low, while a lower high forms when the next bounce fails below the previous swing high. Together, those movements show that sellers are continuing to make progress.
The sequence develops as price declines, bounces without reclaiming the prior important high, and then breaks to a new low. If that pattern continues, each rally fails at a lower level and each decline reaches a lower level. The structure shows that buyers have not yet regained enough control to reverse the broader movement.
As with an uptrend, this pattern does not guarantee that price will continue falling. It only describes the structure currently guiding the market. A trader should use the sequence as context rather than treat it as a prediction.
This matters because a bounce is not automatically a reversal. A rally inside a downtrend may feel strong while it is happening, but if it fails beneath the prior swing high, the larger bearish structure may still be intact. Traders who focus only on the speed of the bounce can mistake temporary movement for a complete change in direction.
That is one reason traders become trapped chasing price. A fast move upward can feel like the beginning of a new trend, even when it is only forming another lower high. Structure slows the decision down by forcing the trader to evaluate where the move sits within the larger pattern.
Trend Continuation Means the Structure Is Still Holding
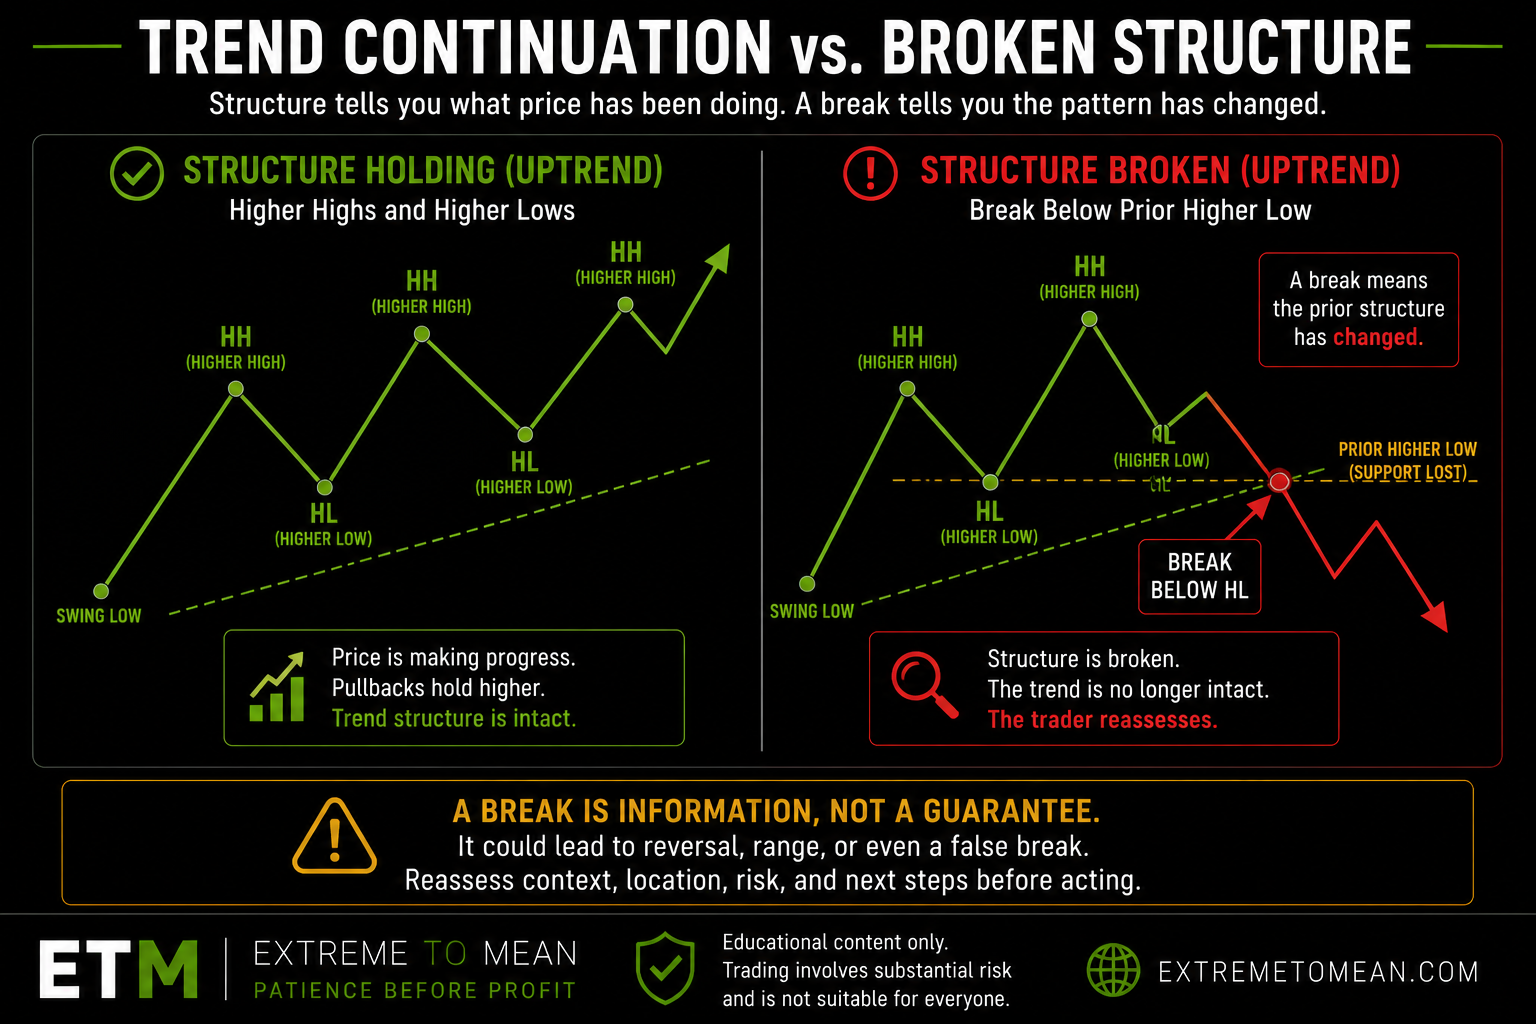
Trend continuation occurs when price continues respecting the swing pattern that defines the trend. In an uptrend, price continues forming higher highs and higher lows, while a downtrend continues producing lower highs and lower lows. The trend is not determined by one candle or one short burst of movement; it is determined by whether the sequence remains intact.
This is why pullbacks and bounces need to be viewed in context. A pullback against an uptrend can preserve a continuation structure if it forms another higher low and buyers regain control. In the same way, a bounce within a downtrend does not automatically create a reversal if it forms another lower high and sellers resume control.
Beginners often struggle with these counter-moves because they can feel more important than they are. A sharp pullback can make an uptrend appear finished, while a strong bounce can make a downtrend appear reversed. Sometimes those moves become early signs of change, but many are simply normal movement within the existing structure.
Patience matters because the trader does not need to label every move immediately. The market can be allowed to show whether the prior structure holds, weakens, or breaks. Waiting for that information is often more useful than trying to predict the meaning of the first counter-move.
This is also why the lesson explaining that the market comes first matters. The same candle pattern or setup can carry a different meaning depending on whether it appears inside an uptrend, a downtrend, a range, or a developing structure break. The surrounding market condition changes how the signal should be interpreted.
A Broken Trend Means the Pattern Has Changed
A trend break occurs when price stops respecting the sequence that had been guiding the move. In an uptrend, an early warning may appear when price fails to produce another higher high. A stronger warning develops when price breaks below a prior higher low that had been supporting the bullish structure.
In a downtrend, an early warning may appear when price fails to produce another lower low. The warning becomes more meaningful when price breaks above a prior lower high that had been containing the rallies. In both cases, the original trend structure has been challenged.
A broken trend is not the same as an automatic reversal. Price may reverse, move sideways into a range, form a larger pullback, or briefly break structure before returning to the previous direction. The break provides new information, but it does not guarantee what the next structure will become.
Beginners often want a structure break to provide an immediate and final answer. They want the chart to confirm that the old trend is over and the opposite trend has begun. Markets are rarely that clean, so the more disciplined response is to reassess rather than assume.
Extreme to Mean thinking does not require the trader to chase every break. The trader instead asks whether the change is significant enough to alter the broader context, invalidate the previous expectation, or require a different risk plan. A break matters because it changes the information available, not because it promises an easy reversal trade.
Structure Gives Context Before Indicators
Indicators can help organize market information, but they should not replace the ability to read basic price structure. Moving averages, oscillators, and tools like the ones covered in our mean-reversion indicators roundup may highlight momentum, direction, or potential extremes, yet price remains the foundation beneath those readings. If the trader cannot identify whether price is trending, ranging, pulling back, or breaking structure, the indicator can become a distraction rather than a guide.
This is especially important for beginners because indicators often present clear visual signals. A line crosses, a reading becomes oversold, or a tool changes from red to green. Without market structure, however, the trader may not understand whether that signal is occurring with the trend, against the trend, near an important swing, or in the middle of an unclear range.
Structure encourages the trader to examine whether price is making real progress, whether pullbacks are holding, whether rallies are failing, and whether an important prior swing has been broken. It also helps separate one emotional candle from the broader sequence surrounding it. These observations do not predict the future, but they provide a clearer description of the current market condition.
That understanding prepares the trader for more advanced setup work. Before studying why location is the first filter, the trader needs to recognize the structure surrounding that location. A level has more meaning when price is approaching it from an intact trend, a weakening trend, a balanced range, or a recent structure break.
A Simple Market Structure Filter
Before making a decision from a chart, a beginner should slow down and identify the visible structure. The goal is not to label every minor fluctuation, but to understand the sequence that is most relevant to the timeframe being traded.
A useful market structure filter includes the following questions:
- Where are the most recent meaningful swing high and swing low? These points provide the basic reference levels for evaluating the current move.
- Is price forming higher highs and higher lows? If so, buyers are still making progress and the uptrend structure may remain intact.
- Is price forming lower highs and lower lows? If so, sellers are still making progress and the downtrend structure may remain intact.
- Has price broken an important prior swing? A meaningful break may signal that the previous structure is weakening or has changed.
- Is the current move continuation, a pullback, a range, or a possible structure change? The trader should understand how the move fits within the broader sequence.
- Am I reacting to one candle or evaluating the full pattern? One dramatic candle should not replace the context provided by several swings.
- Does the visible structure support the decision I am considering? The trade idea should make sense within the market condition surrounding it.
- What would prove my structural reading wrong? The trader should know what price would need to do to invalidate the current interpretation.
The better question is not merely, “Is the chart moving up or down right now?” It is, “What structure is price building, and what would have to happen for that structure to change?” That question turns random-looking movement into a sequence that can be observed and evaluated.
For newer readers, the best next step is to start with the beginner trading path before moving into deeper lessons on market context, setup quality, and trade location. Structure becomes more useful as it is connected to the rest of the trading process rather than treated as an isolated chart pattern.
Final Thought
Market structure is the basic language of price movement. Higher highs and higher lows describe an uptrend, while lower highs and lower lows describe a downtrend. When those sequences stop holding, the market may be weakening, balancing, or beginning to build a different structure. The recurring behaviors behind that shift are broken down in the four core price action principles that recur across setups.
That does not make price predictable. Structure cannot guarantee continuation or reversal, but it gives the trader a way to understand what the market has been doing before deciding what deserves attention. The goal is not certainty; it is clearer context.
The better trader does not ask only what the last candle did. They ask what structure price is building, whether that structure is still intact, and whether the current context supports a clean decision. That is how market structure becomes part of a more patient and organized trading process.
Structure becomes even more useful when traders understand how structural highs and lows become support and resistance areas and why liquidity often gathers around prior highs and lows. Those concepts help explain why important swings can continue influencing price after they form.
Educational content only. Trading involves substantial risk and is not suitable for everyone.