
Mean reversion is easy to understand when it is drawn on a clean diagram. Price stretches away from balance, reaches an extreme, and then returns neatly toward the mean. Real markets rarely owe traders such a clean path.
The tendency may be real while the timing remains uncertain.
Mean reversion describes a tendency for price, under some conditions, to move back toward a central reference or area of balance after becoming meaningfully extended. It does not tell you exactly where the extension will end, which candle will begin the return, how many legs the move will take, or whether the return will reach your preferred target. Recognizing reversion as a market tendency is not the same as predicting the next path of price.
That distinction belongs naturally inside the broader Market curriculum. Extreme to Mean is built around observing extension and return-to-balance behavior, but the concept becomes dangerous when the trader quietly changes “this is worth watching” into “this has to come back now.” The market can be extended without being finished.
Mean Reversion Is Usually Taught Too Neatly
The cartoon version of mean reversion looks like a rubber band. Price moves far from the middle, tension supposedly builds, and eventually the rubber band snaps directly back toward balance. That metaphor can help explain extension, but it becomes misleading when the trader starts believing the market has a known snapping point.
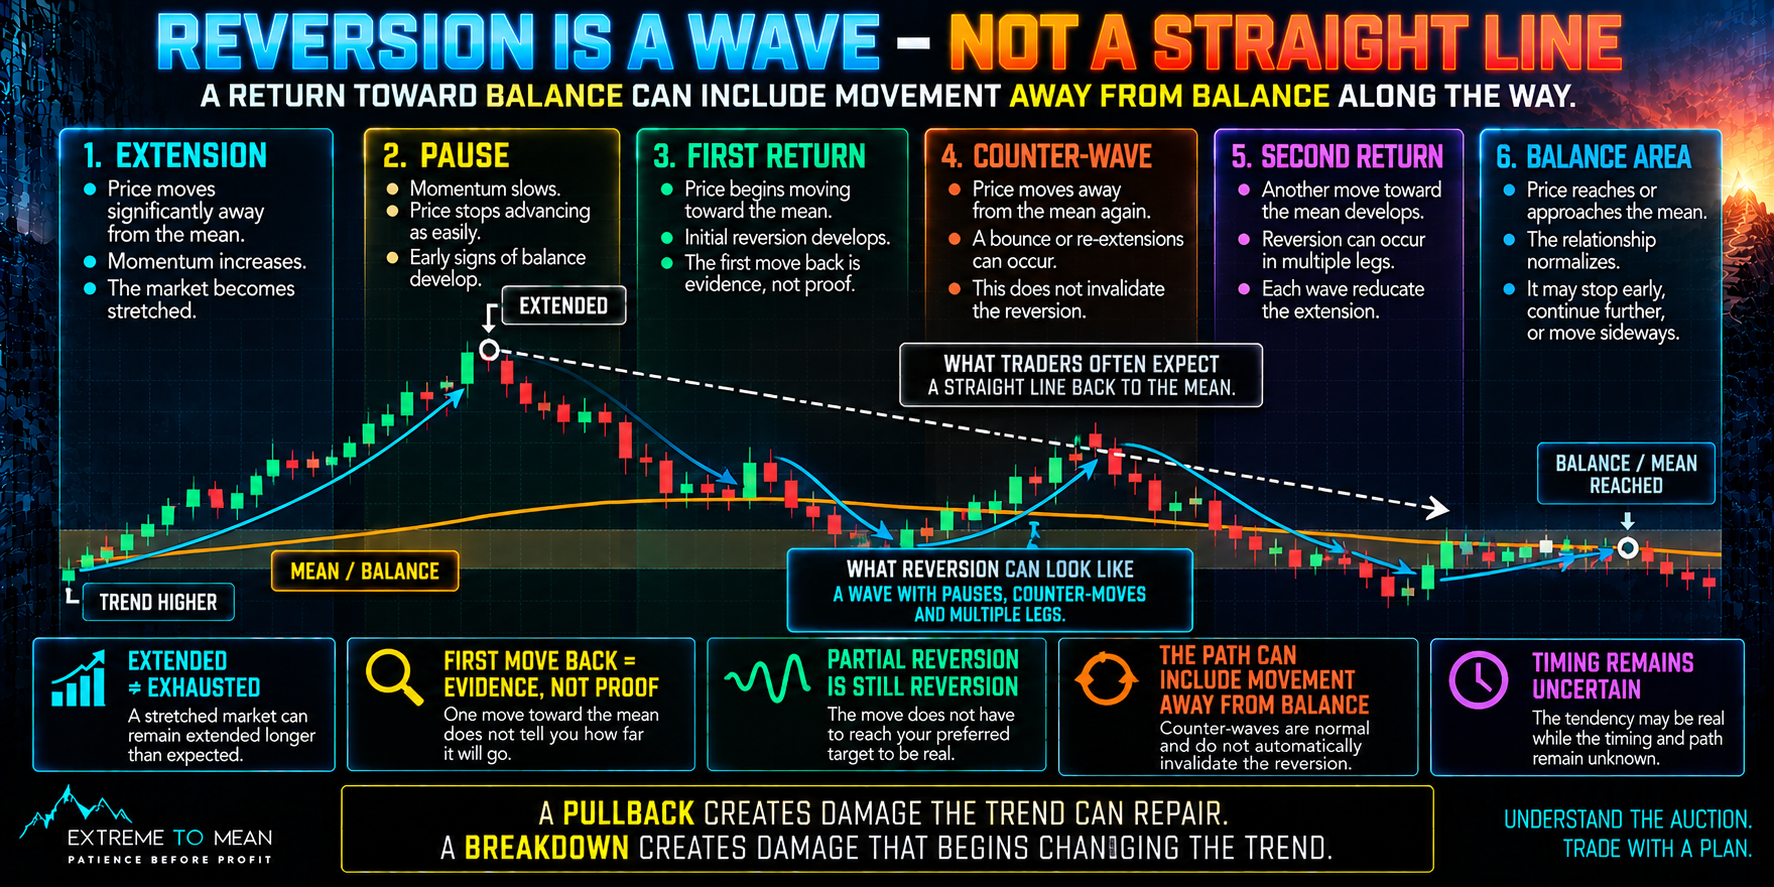
Real price can remain extended, extend even farther, pause, consolidate, return partially, move away again, or approach balance through several separate legs. Sometimes the dramatic snapback traders expect never arrives at all because price simply stops advancing while the reference gradually catches up. Mean reversion is not a rubber band with a known snapping point.
This is why understanding what the mean really is matters. The mean is a reference for thinking about balance or central tendency, not a fixed destination exerting physical force on price. The mean is a reference point, not gravity.
Why “Wave” Is a Better Mental Model Than “Snapback”
Calling reversion a wave does not mean every chart forms one specific wave pattern. It means the return toward balance can unfold through alternating periods of movement, slowing, counter-movement, renewed return, and another pause. A trader should expect a process rather than demand a straight line.
Imagine price has stretched far above a meaningful reference. It pauses, falls halfway toward balance, bounces sharply, stalls again, and then makes another move lower. The reversion was not invalid merely because one part of the path temporarily moved away from the mean.
The path back toward balance can contain movement away from balance along the way. That is one of the most useful expectations a trader can carry into a reversion setup because it reduces the temptation to treat every counter-wave as proof that the idea has failed. It also prevents the opposite mistake of assuming that once the first leg begins, the rest of the return is guaranteed.
Extension Creates Attention—Not an Entry
A meaningful stretch away from balance can create an interesting location. It tells the trader that something unusual may be developing and that the market deserves closer observation. It does not automatically create permission to risk money.
The distinction is simple: STRETCH = condition worth observing. SETUP = evidence that may justify risk. Distance from the mean can create opportunity without creating permission, especially when strong momentum is still expanding and no evidence of stabilization has appeared.
This is why not every extreme is a trade. Price can become stretched, then more stretched, then dramatically stretched while the trader repeatedly thinks, “Surely this is far enough.” The market does not know that the trader has decided it is far enough.
Extended does not mean exhausted. Strong directional movement can remain extended much longer than a trader expects, and the desire to be early often turns a useful market observation into premature prediction. The cleaner process is to treat extension as a reason to pay attention rather than a reason to immediately fade the move.
The First Move Back Is Evidence, Not Proof
Suppose NQ has accelerated well above a balance reference and finally prints a strong red candle. The trader who has been waiting for mean reversion sees the candle and thinks, “There it is—the reversal has started.” But one move back toward the mean cannot tell us the entire future path.
That candle might represent profit-taking, temporary counterflow, a pause in the trend, or the beginning of a more meaningful reversion. All of those possibilities can initially look similar. The first wave toward the mean tells you something changed; it does not tell you how far that change will carry.
This is where context comes before the candle. A countertrend candle inside a powerful repricing environment should not be interpreted the same way as a similar candle after momentum has already slowed, extension has stopped increasing, and the market is beginning to stabilize. Behavior matters because the extreme alone cannot tell the trader whether pressure is actually changing.
The goal is therefore not to predict whether the first move will become a complete reversion. The trader should ask whether the developing behavior is beginning to support a qualified reversion thesis and whether that thesis has clear invalidation. A tendency earns attention. A setup still earns risk.
Partial Reversion Is Still Reversion
Traders often imagine that a mean-reversion move is successful only if price touches the exact reference they had in mind. The market may reduce a significant extreme without completing that textbook journey. Price can travel halfway back toward balance, reduce volatility, stabilize, and then resume the larger trend.
That does not mean no reversion occurred. The relationship between price and balance still normalized meaningfully even though the trader’s preferred target was never reached. Reversion does not have to complete your preferred target to have occurred.
Beginning to revert also creates no obligation to finish reverting. A move can stall, fail, reverse direction, or transform back into trend continuation after an initial return. Beginning to revert does not create an obligation to finish reverting.
That distinction protects the trader from staying in a trade simply because the original idea was temporarily correct. Being right about the beginning of a move does not make the eventual destination inevitable. The market has to keep earning the thesis as the wave develops.
Sometimes the Mean Moves Toward Price
Price does not always do all the traveling. If the relevant mean is dynamic, price can move downward while the reference moves upward, allowing the distance to close from both directions. The relationship can normalize even faster than the raw price move suggests.
A second possibility is even less dramatic. Price becomes highly extended, stops advancing, and spends time moving sideways while the mean slowly rises toward it. The extreme shrinks through time rather than through a sharp countertrend price move.
Sometimes price returns to the mean. Sometimes the mean catches up to price. Often both happen together. This is another reason a trader should avoid thinking, “Price must fall 100 points because that is how far it is from the mean right now.” The reference itself may not remain where it was when the trade idea first appeared.
Sometimes the market corrects through time instead of a dramatic move in price. That may look unsatisfying to a trader waiting for a dramatic reversal, but it still changes the relationship between price and balance. Reversion should be understood as normalization, not only as a specific number of points traveled.
Reversion Can Happen Inside a Larger Trend
Mean reversion does not automatically mean the entire directional structure has reversed. An uptrend can accelerate, become stretched, pull back toward balance, and then resume higher. The return toward the mean was real even though the larger trend never ended.
Price can revert toward balance without changing the larger directional structure. This is the distinction developed more fully in Reversion Is Not Reversal, but it matters here because the wave model makes the relationship intuitive. Reversion can be one phase of a trend rather than the opposite of the trend.
Time horizon makes this even more important. A three-minute chart may show a sharp reversion lower while the thirty-minute structure remains strongly bullish. A reversion on one horizon can be nothing more than a pullback on another.
Momentum and reversion can therefore coexist rather than being mutually exclusive labels. Strong momentum can create the stretch that later makes reversion worth watching, and the reversion itself can eventually develop momentum in the opposite direction. What matters is which behavior is dominant on the horizon the trader is actually trying to trade.
Mean Reversion Becomes Prediction When Evidence Gets Skipped
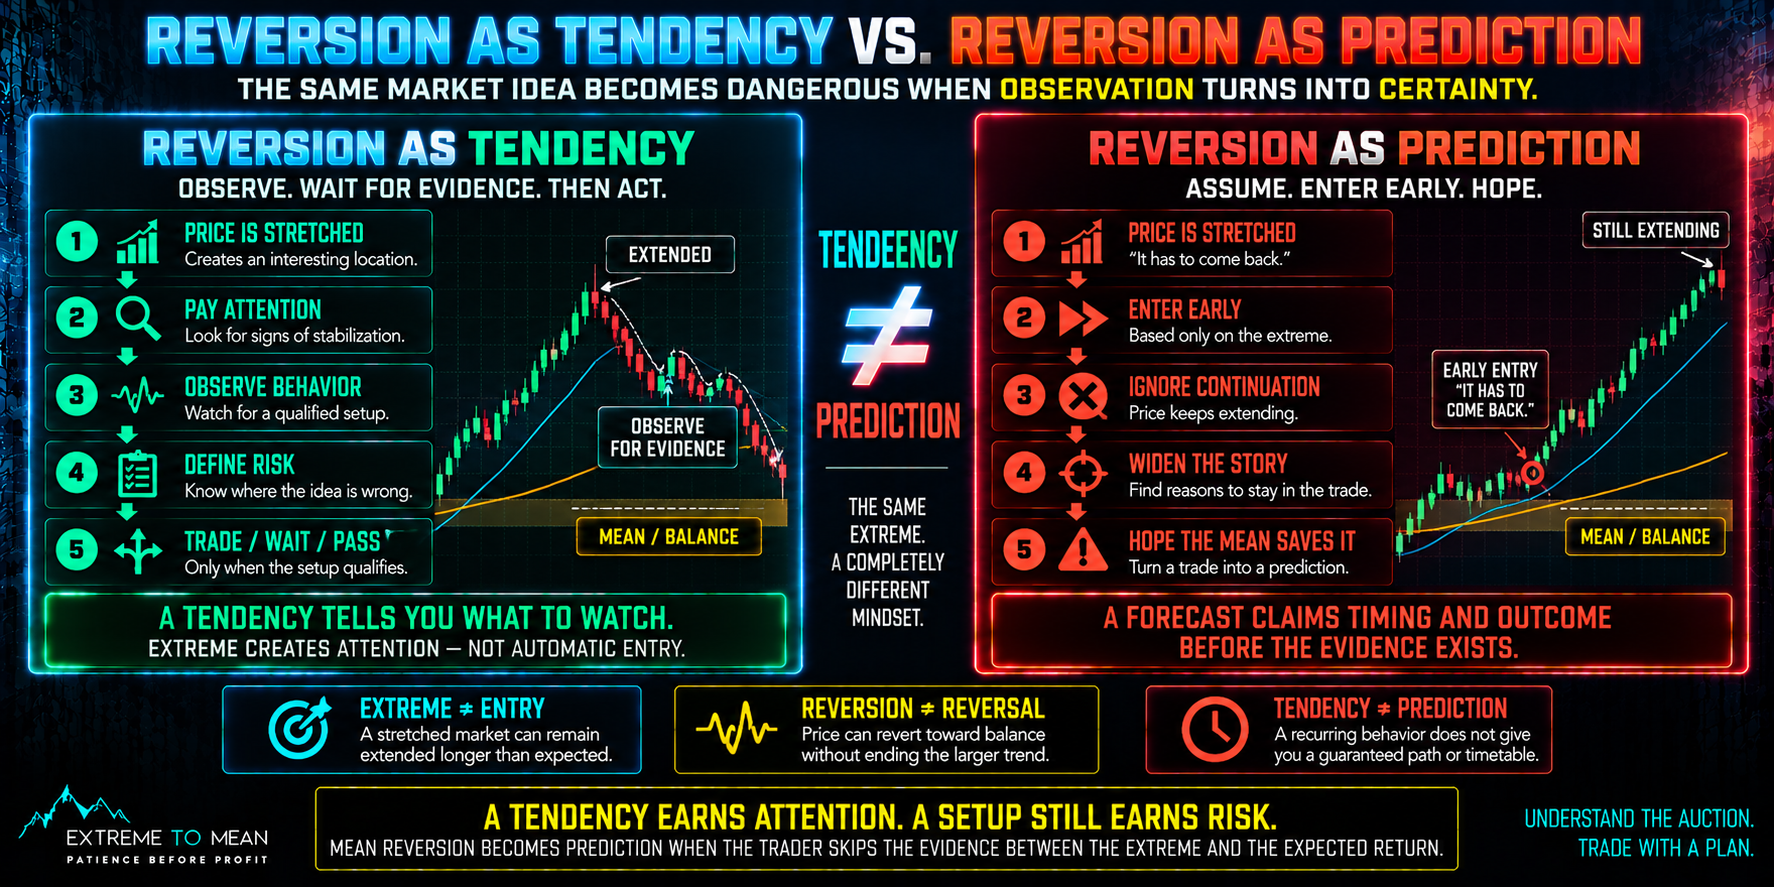
Mean reversion naturally tempts traders to forecast because an extreme immediately suggests a destination. The trader sees price well above balance and mentally completes the rest of the story: “This is too high, so it will fall back.” The market has provided location, but the trader has jumped directly from location to future outcome.
The missing middle is behavior. Has the market stopped accelerating? Has the extension begun to stabilize? Has a qualified setup actually formed, and can the trader define where the idea is wrong?
Mean reversion becomes prediction when the trader skips the evidence between the extreme and the expected return. A cleaner sequence is OBSERVATION → QUALIFICATION, not EXTREME → FORECAST. You do not need to know that price will revert; you need to know what would make a reversion trade worth risking.
This also explains why market conditions change the quality of a setup. The exact same amount of extension can mean different things in a balanced session, a mature trend, or a powerful repricing environment. Distance without context cannot answer whether the reversion thesis is improving or becoming more dangerous.
One NQ Move, Several Waves of Evidence
Imagine NQ has been trending higher through the morning and accelerates significantly above a chosen balance reference. A beginner looks at the distance and immediately shorts because the market appears “way too stretched.” Price keeps climbing, and the extension becomes even larger.
Eventually the upward momentum slows and price stops making easy progress. That is Stage 1: Extension becoming Stage 2: Stabilization—useful information, but still not automatic entry. When a counter-move begins, Stage 3: Initial Return tells the trader that reversion behavior may now be developing.
Price then bounces sharply before reaching the mean. Instead of assuming the reversion failed or immediately adding another short, the disciplined trader treats the bounce as Stage 4: Counter-Wave and reassesses whether the return-to-balance thesis still has support. The next stage could be another wave toward balance or renewed trend continuation.
The trader did not predict the wave. The trader updated as the wave developed. That is the practical advantage of the wave model: it replaces the need to forecast every crest and trough with a process for responding to new evidence. The trader can remain flexible without rewriting the original trade story after the fact.
The Reversion Reality Check
Before turning extension into a reversion trade, ask:
- WHAT IS PRICE EXTENDED FROM? — Use a meaningful reference, not simply “it looks far.”
- WHAT TIME HORIZON AM I TRADING?
- IS THE MARKET STILL ACCELERATING AWAY? — Do not confuse extreme with exhaustion.
- HAS PRICE ACTUALLY BEGUN TO STABILIZE OR RESPOND?
- DID A SETUP FORM—or am I entering because price looks extreme?
- IF REVERSION BEGINS, AM I EXPECTING A STRAIGHT LINE?
- CAN THE REVERSION STALL OR FAIL WITHOUT DESTROYING MY PROCESS?
- WHERE IS THE IDEA INVALID?
- AM I TREATING THE MEAN AS A REFERENCE OR A GUARANTEED DESTINATION?
That final question may be the most important. If the mean has become something the trader believes price must eventually reach, risk management can quietly disappear because every adverse move is reinterpreted as temporary. Being right eventually is not enough if the path to “eventually” violates the trade's risk.
If the trader cannot explain where the idea becomes invalid, having unclear risk is the more immediate problem. A mean-reversion thesis should remain falsifiable even when the broader tendency toward balance makes intuitive sense. No invalidation means the trader is relying on prediction rather than a trade plan.
The ETM Stretch → Stabilize → Respond → Reassess Framework
Use this process:
- STRETCH — Price moves meaningfully away from a relevant reference. This creates attention, not entry.
- STABILIZE — Is the one-way pressure beginning to change?
- RESPOND — Does market behavior begin supporting a possible move toward balance?
- REASSESS — Is the reversion continuing, stalling, or failing as each new wave develops?
- DECIDE — Only with a qualified setup and defined risk: TRADE / WAIT / PASS
This is a framework for organizing observation, not a mechanical sequence every chart must follow. Some reversions will begin without a perfect pause, others will stop after one partial leg, and some stretched markets will simply continue away. A framework should organize observation—not force every chart into the same story.
The simple mental comparison is TENDENCY vs. FORECAST. “Extended markets sometimes move back toward balance” is a tendency that tells you what deserves attention; “this market is too extended and will return to the mean now” is a forecast that claims direction, timing, and outcome. A tendency earns attention. A setup still earns risk.
Final Thought
Mean reversion becomes dangerous when a useful market tendency turns into a prediction. Price can become stretched and remain stretched, begin returning toward balance and pause halfway, re-extend, or normalize while the mean itself moves closer. None of those possibilities make mean reversion useless; they make process necessary.
Treat extension as a reason to pay attention rather than a reason to enter. Let context, behavior, location, setup quality, and risk tell you whether the idea has earned participation, then keep updating as the move develops. The path back toward balance can contain movement away from balance along the way.
Reversion may behave like a wave, but you do not have to predict every crest and trough to trade with patience. You only need to stop pretending that recognizing the possibility of a return means you already know its timing, path, or destination. The trader does not need to predict the wave; the trader needs to update as the wave develops.
Educational content only. Trading involves substantial risk and is not suitable for everyone.