Traders who learn reversion-to-mean almost always run into the same wall early on. Price drops sharply. It looks extended. It looks like the kind of move that should snap back. So they step in — and the market keeps going. This is what traders mean when they say they "caught a falling knife," and it doesn't just damage accounts. It quietly erodes confidence in a system that actually works when used correctly.
The problem isn't the strategy. The problem is a missing filter — the habit of treating location alone as permission to enter. Not every move that looks extreme qualifies as a trade setup, and understanding why is one of the most important things any process-driven trader can internalize.
What "Extreme" Actually Means — and What It Doesn't
There's a real difference between price being "down a lot" and price being in a true extreme zone. These are not the same thing, even though they can look identical on a chart.
In a reversion-to-mean framework, an extreme isn't defined by how dramatic a candle looks or how much distance has been covered in a short time. It's defined by location — where price sits relative to the structure we use to measure meaningful reversion distance. That structure has to be respected in context. A 30-point move in the E-mini means something different in a slow, low-range session than it does during a news-driven, high-volatility environment. The number alone tells us almost nothing without the context around it.
When we skip that context check and trade off optics — "price looks extended, so this must be the spot" — we're reacting to appearance, not reading a condition. That habit is the entry point for most falling knife situations.
When News and Events Create the Illusion of an Extreme
Economic data releases, Fed announcements, geopolitical headlines, earnings surprises — these events can move markets hard and fast, in ways that have nothing to do with normal price rhythm. When a major data print surprises the market or a headline breaks during a thin liquidity window, price can spike or drop dramatically within minutes.
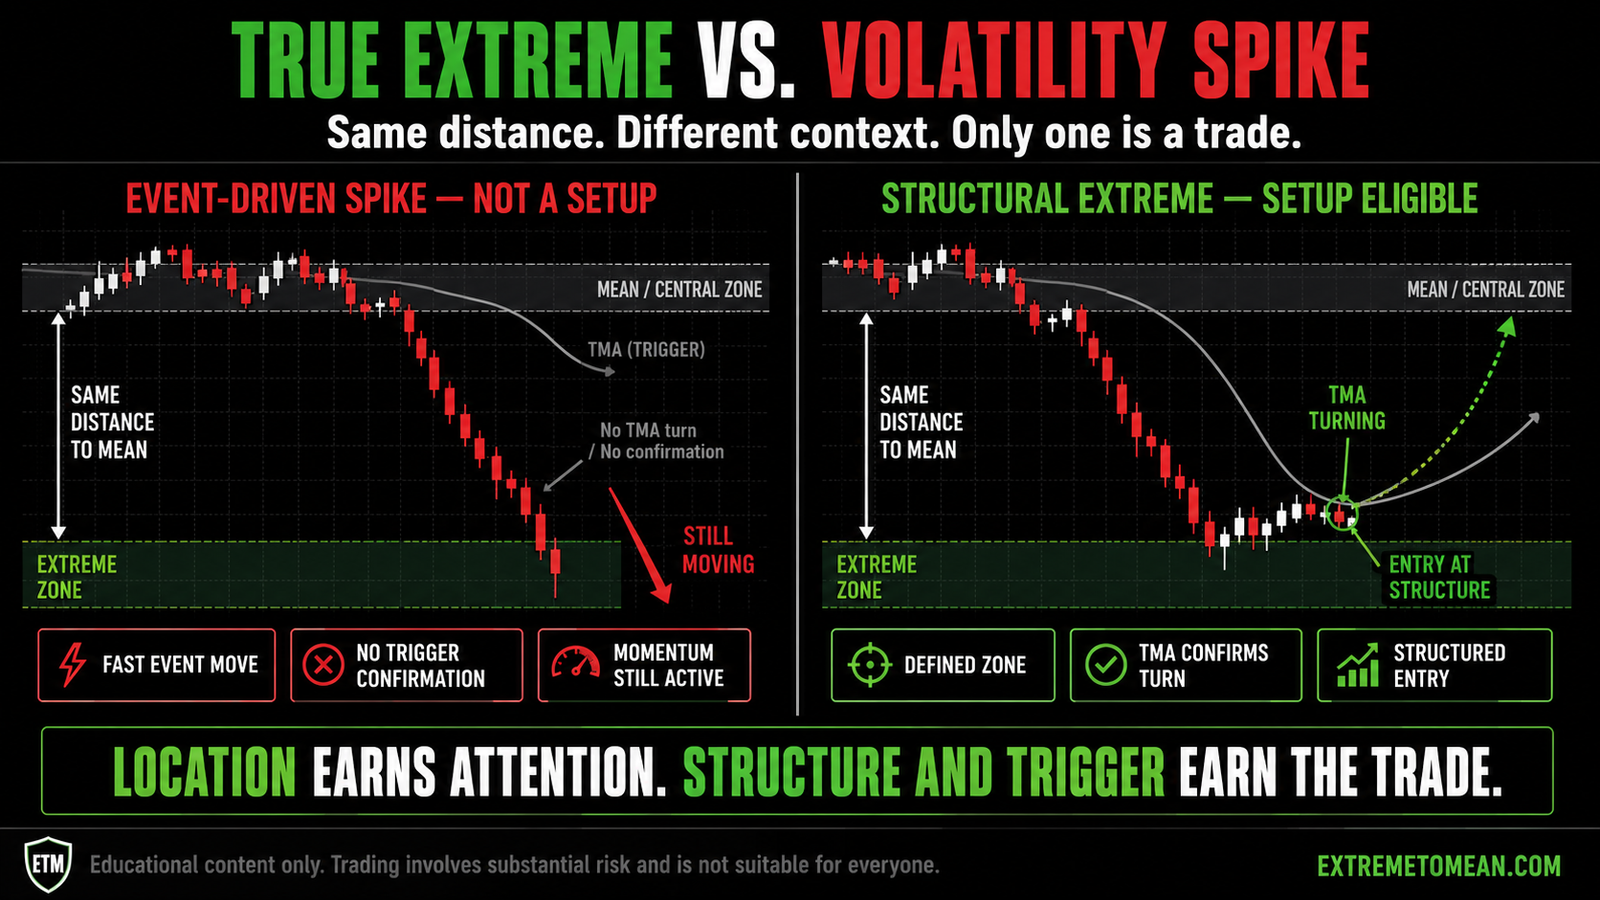
From a distance, that move can look exactly like a textbook extreme. It hits a visual area. It looks "too far, too fast." The instinct fires: this is the spot. But the market at that moment is processing new information — information that hasn't been fully absorbed or priced in yet. The move might extend another full leg before price even begins to consider reversing. Or it might snap back with such speed that there's no clean entry window at all.
We've seen this pattern repeat consistently: a sharp drop occurs, a trader identifies it as "extended," steps in looking for the bounce, and watches the market continue lower as the event-driven move plays out over the next several candles. The extreme looked real. The logic felt sound. But the context was wrong — external forces were driving that move, not the normal back-and-forth of price behavior that reversion-to-mean relies on.
Volatility and velocity created by news are not the same as a structural extreme. They can occupy the same space on a chart, which is exactly what makes them dangerous.
Why the Falling Knife Feels Like a Trade
The falling knife is seductive because the underlying logic isn't wrong — it's incomplete. Reversion-to-mean works. Price does come back toward the mean. If it's moved this far, a return to equilibrium is coming eventually. The problem is that word: eventually. The market doesn't care about our timing or our rationale. It moves based on structure, momentum, and active participants — and none of those things align with us simply because we think the move has gone far enough.
What makes the falling knife particularly costly isn't just the first entry. It's what happens next. A trader steps in early and price continues lower. The narrative shifts: I was right about the zone — I just need to add. So they re-enter at a lower level. Sometimes a third time. What started as a single setup becomes a laddered position in a move that hasn't stopped. That's when small, manageable losses turn into account-damaging ones.
The falling knife almost never gets caught cleanly. It usually gets caught with both hands.
What the Higher Timeframe Is Actually Telling You
Before we can even evaluate whether a move represents a true extreme, we need to understand what the bigger structure looks like. This is the step that many traders skip — and it costs them repeatedly.
If we're reading a 15-minute chart and price appears to be in a deep reversion zone, but the 4-hour chart shows a defined downtrend still in progress, then what looks extreme on the lower timeframe is simply normal behavior within a larger directional move. Price is doing exactly what it's supposed to do in the context of the move it's already in. The "extreme" isn't an extreme — it's just continuation.
Zooming out doesn't make us miss setups. It tells us whether we're in the right neighborhood to be looking for one at all. A reversion-to-mean entry is most structurally sound when higher timeframes show us we're at a meaningful level within a broader context that supports the move — not when we're reaching for a reversal against a trend that hasn't shown any sign of exhaustion.
Higher timeframe context is a filter. It doesn't tell us exactly when to enter. It tells us whether we're reading the right chart for the trade we think we see.
The TMA — Why the Trigger Is Non-Negotiable
This is the part of the Extreme to Mean framework that separates a trade from a position based on hope. Identifying a potential extreme zone is the beginning of the process, not the end. The TradeMA — the TMA — is the mechanism that tells us whether the move has actually begun to stabilize and shift direction.
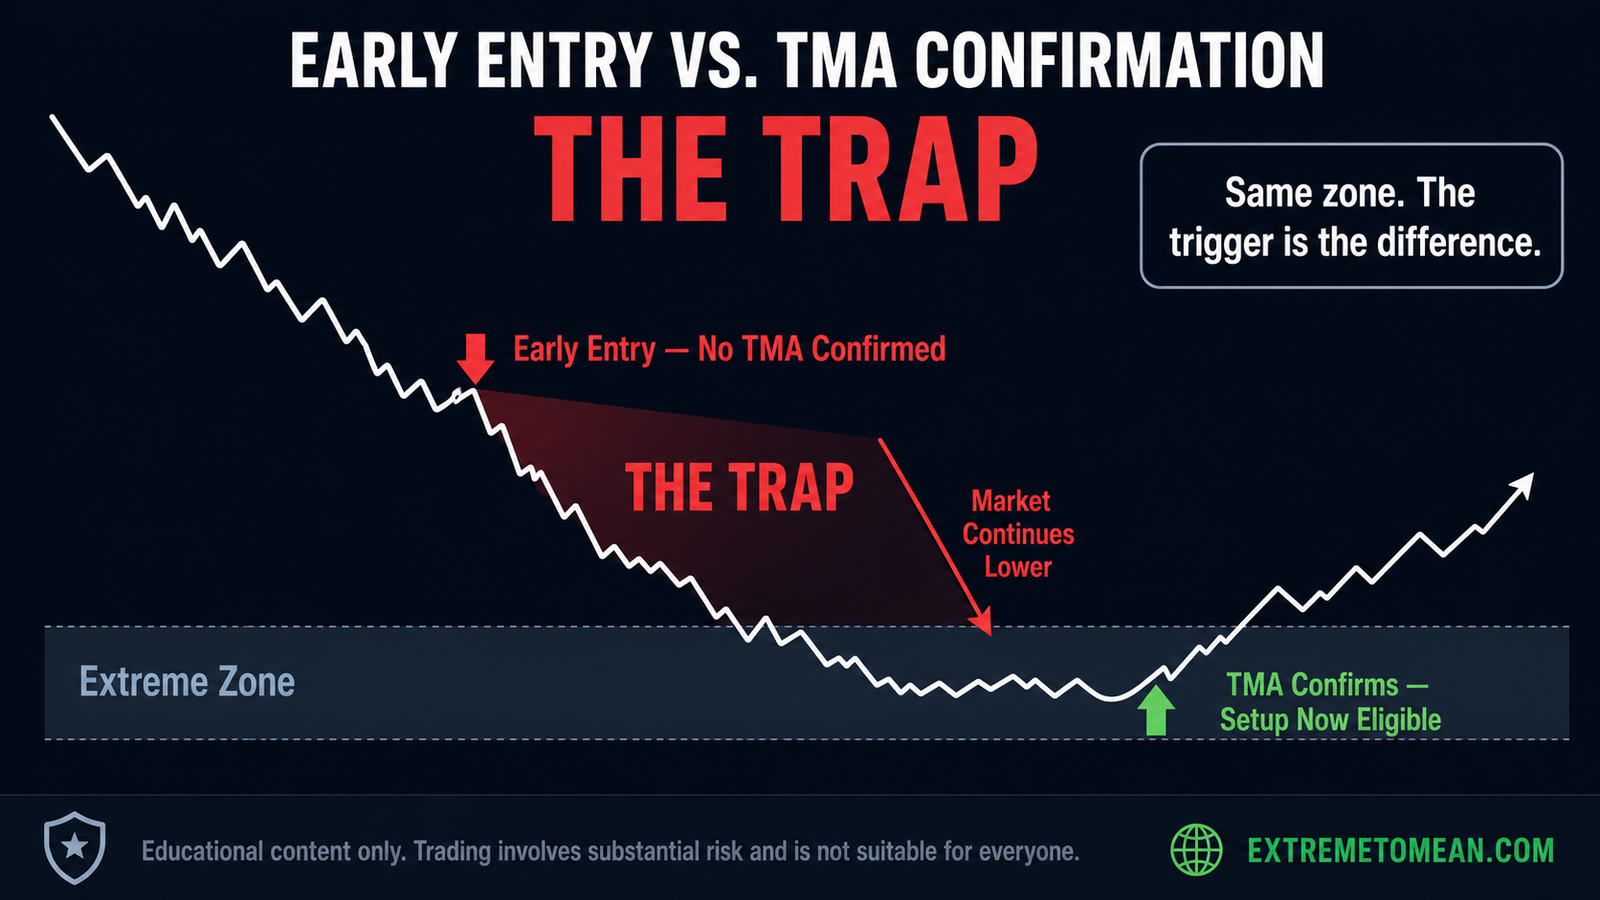
We do not enter because price is in a zone. We enter when the TMA confirms a directional shift within that zone.
This distinction matters more than almost anything else in the system. The TMA is reactive to real price behavior. It doesn't predict where the market is going. It reflects what the market is doing right now — and when it turns and confirms direction in alignment with the zone we've already identified, we have something concrete to trade against. A defined direction. A risk level. A reason that isn't just "price looks extended."
Without that trigger, we're entering a market that hasn't told us it's ready. We're standing in front of a vehicle that's still moving and hoping it stops. With the trigger confirmed, we're stepping in after the vehicle has slowed, turned, and shown us a new direction. That's a fundamentally different action, even if the entry price looks similar.
The trigger is not optional. It's the structural difference between a trade and a gamble.
A Better Filter Before You Pull the Trigger
Before entering any setup that presents as an extreme, run it through these questions honestly:
- Is this extreme defined by our structure, or does it just look dramatic on the chart?
- What is the higher timeframe showing? Is there a trend context that makes a reversion less likely right now?
- Was there a recent news event, data release, or external catalyst driving this move?
- Has the TMA confirmed a directional shift, or is price still in free-fall?
- Do we have a clearly defined risk level — a specific point where we're wrong — or are we entering without one?
If we can't answer those cleanly, the setup isn't ready. That's not a problem with the system. That's the filter doing exactly what it's supposed to do.
The better question — the one that protects us most — is not "how far has price fallen?" It's "has the market shown me that the fall is over?"
As You Can See
Not every extended move is a trade. Some are events. Some are continuation. Some are the market doing exactly what it should be doing in the direction it's already going. A true extreme in a reversion-to-mean framework requires more than distance — it requires location, context, and a confirmed signal that the move has shifted.
The TMA trigger exists for this reason. It's our line between observation and action. The patience to wait for it isn't passive — it's the most active, disciplined decision a trader can make. Letting a move play out without chasing it, watching for structure to confirm, and only stepping in when the setup is complete — that's the process that keeps us in the game long enough to take the setups that actually qualify.
We don't predict the bottom. We wait for the market to show us where the bottom was.
Educational content only. Trading involves substantial risk and is not suitable for everyone.