
The Reversal That Looks Too Easy
Short-term reversals are attractive because they occur frequently enough to become familiar. Price pushes higher, stalls, and retreats; minutes later, another move appears to follow a similar sequence. Once a trader begins looking for these events, it can feel as though the market repeatedly offers small, predictable opportunities.
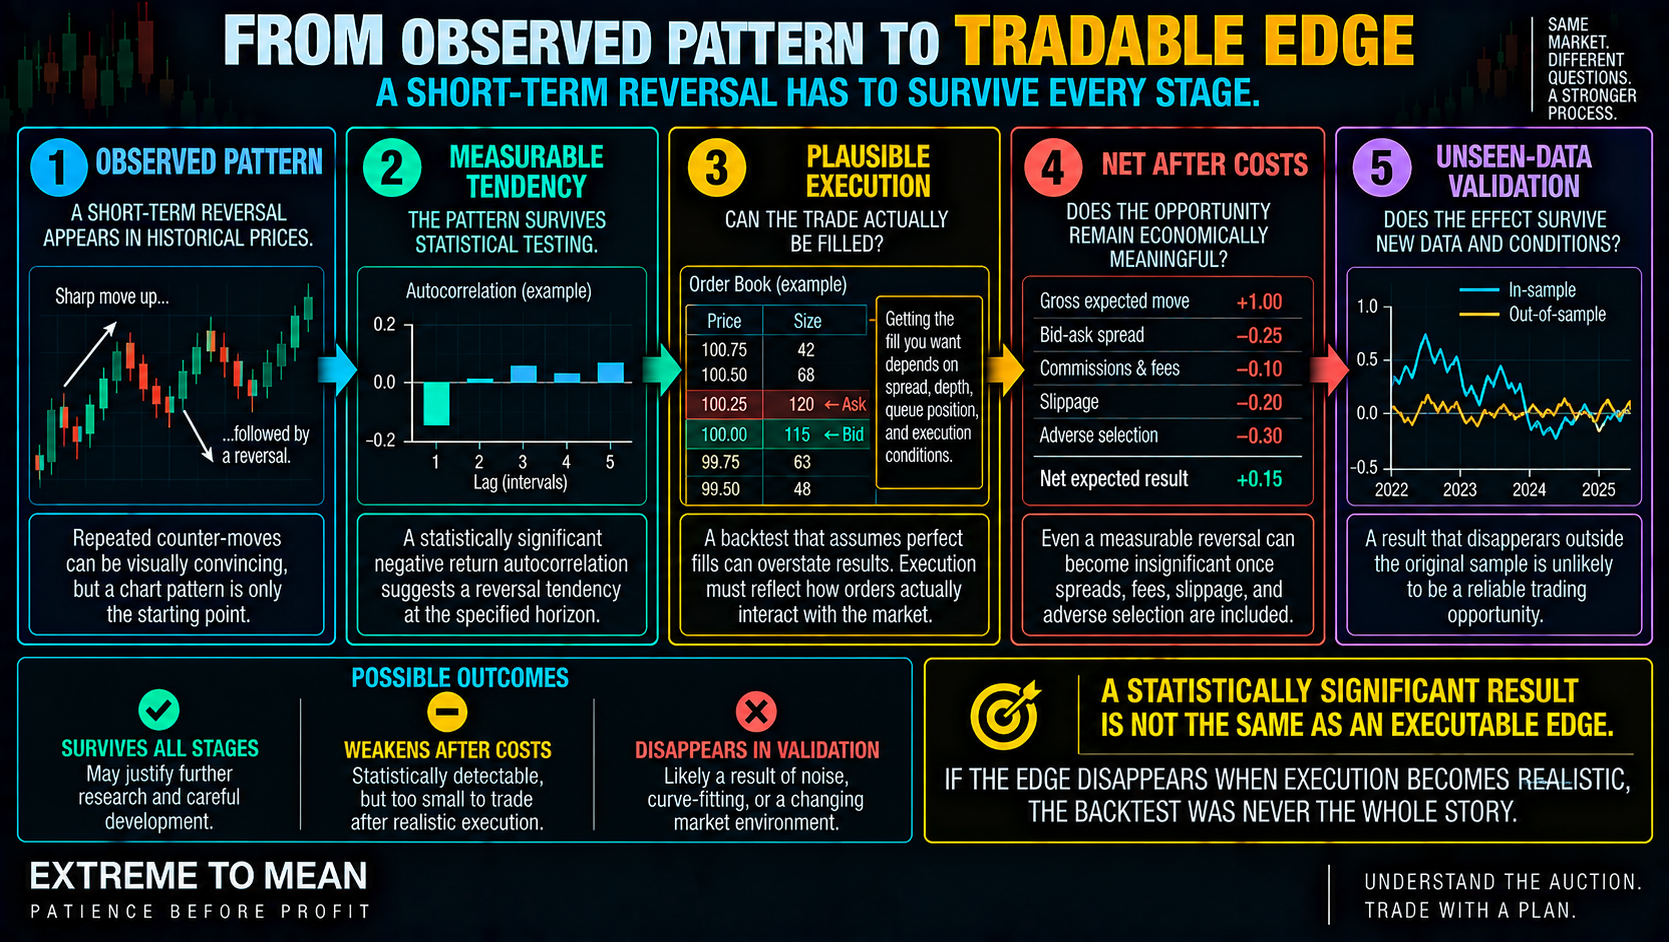
The difficulty is that historical charts record prices, not the full experience of trading them. They do not necessarily show whether an order could have been filled at the desired level, how much liquidity was available, or whether execution costs would have consumed the movement. A pattern that looks profitable when marked on completed candles can behave very differently when tested using executable prices.
This distinction matters throughout the Setup curriculum, where an observed pattern must become a defined, qualified trading idea before it deserves risk. With very short-term reversals, that transition is especially important because the expected movement may be small relative to the cost of entering and exiting. The smaller the apparent opportunity, the less room there is for unrealistic assumptions.
What Short-Term Reversal Actually Measures
In statistical terms, short-term reversal describes a tendency for movement during one defined interval to be followed by movement in the opposite direction during another. Researchers may investigate this through negative return autocorrelation, which means that positive returns tend to be followed by negative returns, and vice versa, at the observation horizon being studied. The measurement describes a relationship between successive returns; it does not automatically identify a chart pattern worth trading.
The observation interval can substantially change the answer. Reversals measured between consecutive transactions may reflect different forces from reversals measured using one-minute, five-minute, or hourly returns. A relationship detectable in transaction-level data may weaken, disappear, or change when prices are sampled less frequently.
Short-term reversal is also different from a sustained trend reversal or a broader mean-reversion strategy. A sequence of alternating transactions does not necessarily indicate that market structure has changed, while a movement back toward an intraday reference may involve a much longer trading horizon. Before researching any reversal, the trader must define exactly which movement is being measured and how much time the supposed opportunity allows.
Why Prices Can Appear to Reverse
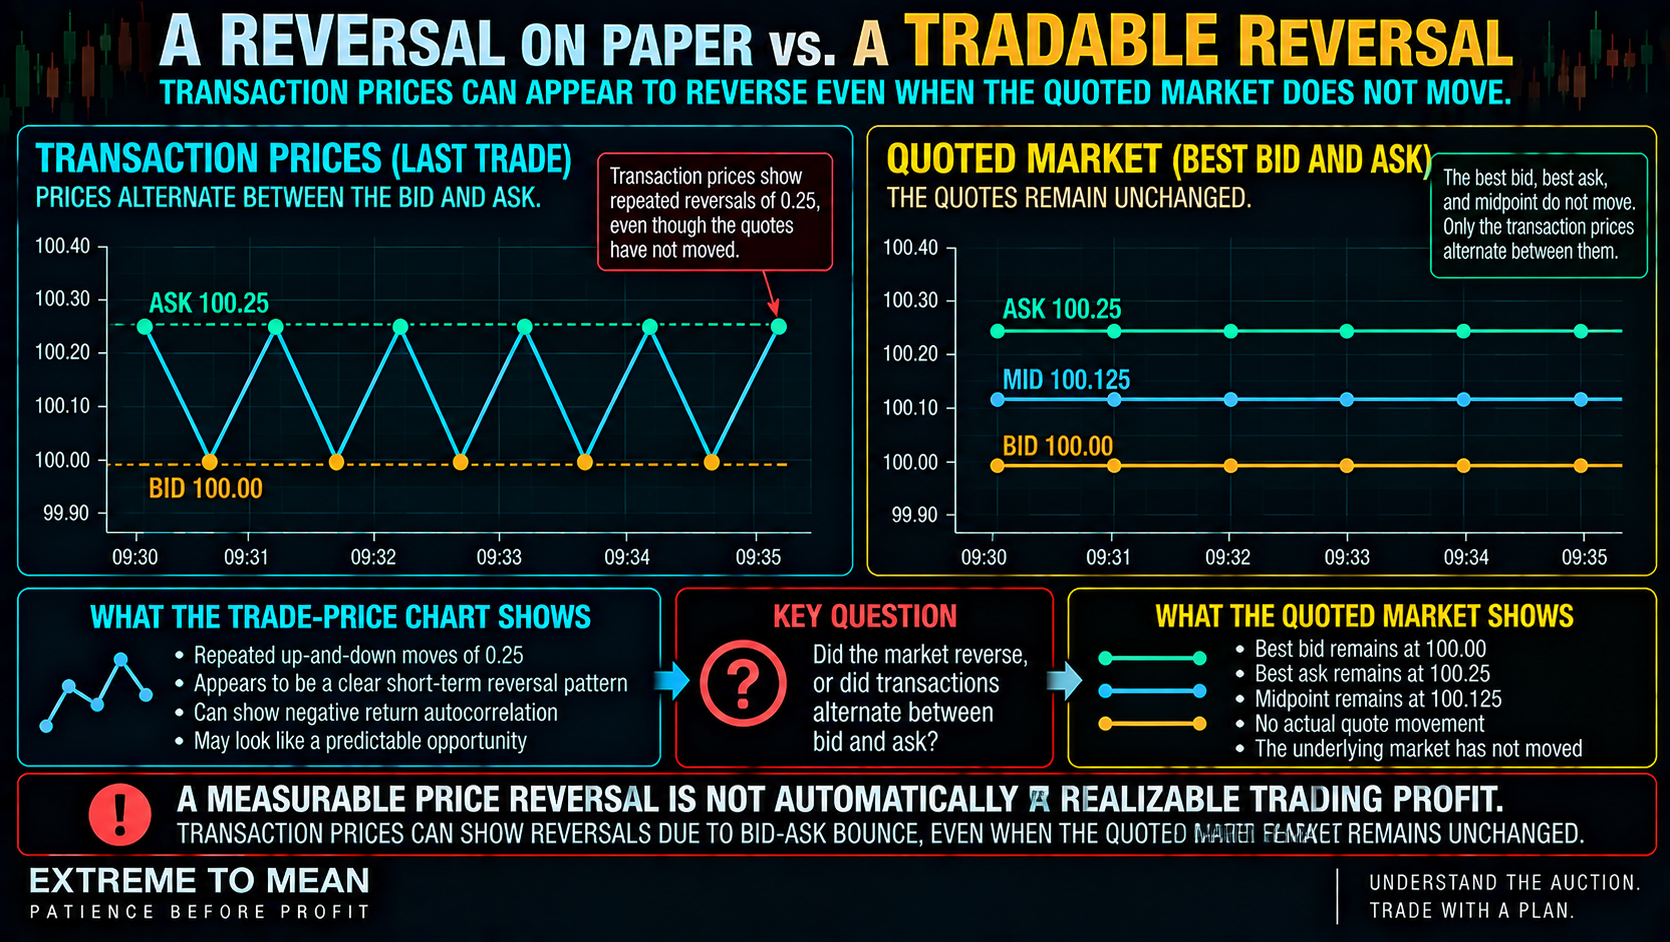
Some apparent reversals arise from the way transactions occur rather than a meaningful change in the underlying market. A buyer seeking immediate execution may trade at the available ask, while a seller seeking immediate execution may trade at the bid. If those transactions alternate, the recorded transaction price can rise and fall even when the best bid, best ask, and their midpoint remain unchanged.
Consider a hypothetical market with a fixed best bid of 100.00 and best ask of 100.25. One transaction occurs at the ask, the next at the bid, and subsequent transactions continue alternating between the two prices. A transaction-price chart displays repeated 0.25-point movements in opposite directions, despite the quoted market having remained stationary.
This is called bid-ask bounce, and it can create apparent negative serial dependence in recorded transaction-price changes. The movement is genuine in the sense that transactions occurred at different prices, but it is not necessarily evidence that the market's underlying valuation repeatedly changed. Richard Roll's 1984 market-microstructure research established this distinction under explicit assumptions, including informational efficiency and stationary price-change behavior.
Real Price Adjustment or Microstructure Noise?
Bid-ask bounce is not the only explanation for short-term reversal. Temporary buying or selling pressure can push price away from its recent level, after which liquidity replenishes or the initial order-flow imbalance subsides. In those cases, some of the observed movement may reflect genuine temporary pressure rather than merely transactions alternating between unchanged quotes.
Liquidity providers may also adjust their quotes as they manage inventory, while changes in available opposing liquidity can influence how much price moves in response to aggressive orders. These mechanisms can produce different patterns depending on the instrument, time of day, trading activity, and prevailing market conditions. They belong within the broader auction-and-liquidity framework, but their presence does not establish that every resulting counter-move is predictable.
Other movements reflect genuine repricing. A new economic release, changing expectations, or persistent directional participation may move the market to a different level where participants are willing to trade. A trader assuming that every sharp movement is temporary can repeatedly fade legitimate price discovery rather than identifying an exploitable reversal.
Comparing transaction prices with quoted bid, ask, and midpoint data can help separate some of these explanations. If the trade-price series repeatedly reverses while the midpoint barely moves, the researcher should question how much of the result comes from transaction mechanics. If the midpoint also moves and subsequently reverses, there may be more economically meaningful price adjustment to investigate, although that still does not establish a trading edge.
Why a Measurable Pattern May Not Be Tradable
The most important practical question is what happens when the trader attempts to capture the apparent movement. Return calculations based on historical transaction prices can unintentionally assume entries and exits that were unavailable to someone actually placing orders. The difference between a recorded price and a plausible execution price becomes critical when the entire expected opportunity amounts to only a few ticks.
Return to the hypothetical 100.00 bid and 100.25 ask. A backtest may detect repeated quarter-point movements by measuring transactions alternating between those prices, but a trader demanding immediate execution would ordinarily buy at the ask and sell at the bid. If the quotes remain unchanged, that round trip loses 0.25 points before commissions, fees, or additional slippage.
A trader providing liquidity might instead try to buy at the bid and sell at the ask. However, earning the spread requires actual fills, suitable queue position, and the ability to manage inventory while prices and available liquidity change. A historical chart showing that both prices traded does not demonstrate that the trader could have executed both sides when needed.
There is also the problem of adverse selection. A resting buy order may be filled precisely when selling pressure is increasing and the market is about to move lower, while an apparently favorable order may never execute because price reverses before the trader receives a fill. A backtest that assumes every favorable touch produces execution while ignoring unfavorable fills can produce results that are not achievable in practice.
Commissions, exchange fees, the bid-ask spread, slippage, delays, and missed opportunities all affect the result. A reversal tendency can remain statistically detectable across thousands of observations while generating too little realizable movement to justify those costs. Statistical significance and economic profitability answer different questions, and confusing them can turn a legitimate research finding into an unsupported trading claim.
How Market Conditions Change the Pattern
A short-term reversal tendency should not be assumed to behave identically across market environments. During orderly, liquid trading, quotes may remain relatively stable and temporary imbalances may be absorbed quickly; during volatile or stressed conditions, available liquidity can change rapidly while spreads, price travel, and execution uncertainty increase. The same visually familiar counter-move may represent a different market process under each condition.
Persistent momentum creates another important distinction. A sharp intraday extension can reflect temporary liquidity pressure, but it can also reflect information that the market is still incorporating or demand that remains strong. This is why market conditions change the quality of a setup: the reversal pattern cannot be evaluated independently of the environment that produced the preceding movement.
Sampling frequency matters here as well. A tendency measured between consecutive transactions may be heavily influenced by microstructure effects, while a similar study using longer intervals may capture more substantial price adjustment. Neither measurement is inherently the correct one; the research question and the intended execution horizon determine which is relevant.
How to Research Short-Term Reversal Honestly
A useful investigation begins by defining the observation before looking for attractive historical examples. Specify the instrument, session, data type, sampling interval, reversal condition, entry and exit methodology, maximum holding period, and relevant market conditions. Without those definitions, it is too easy to count successful reversals using one interpretation and quietly exclude unsuccessful examples using another.
The next step is to test the same hypothesis using more than one appropriate price series. Where reliable data are available, compare transaction-price results with quote-midpoint results, then evaluate what happens when the strategy is modeled using plausible bid and ask executions. A pattern that disappears when the analysis moves from last-traded prices to midpoint data deserves a very different interpretation from one that survives both measurements.
Execution modeling deserves particular attention because historical trading data rarely reveal a hypothetical order's exact place in the queue. Marketable orders should account for the available prices, depth, and potential slippage, while passive limit orders require defensible assumptions about execution probability and adverse selection. The research should not award the strategy fills simply because the historical market touched a favorable price.
Imagine a hypothetical researcher who discovers a measurable short-term reversal effect in a particular instrument and session. After applying estimated costs in the original sample, the effect remains positive, creating a reason to continue the investigation rather than declare success. The researcher still needs to test the locked methodology on unseen data, assess whether execution assumptions are realistic, and determine whether a small number of unusually favorable sessions produced most of the result.
This is where P057's broader backtesting discipline becomes essential. Rules must be defined before outcomes are known, tests should include every qualifying observation, and changing the rules should create a new research version rather than silently altering historical results. The objective is to discover whether the apparent relationship survives serious attempts to challenge it, not to construct the most attractive equity curve.
The ETM Short-Term Reversal Framework
Short-term reversal research becomes more useful when the trader separates the observation, the underlying market mechanism, and the actual trading opportunity. Those stages must be examined in order because passing one does not establish that the next has also been satisfied. A clearly observed pattern can fail statistical testing, and a statistically validated tendency can still fail the execution and risk test.
- Observation — What short-term reversal behavior have you actually noticed?
- Horizon — Which transaction or time interval defines the movement and its subsequent reversal?
- Price series — Does the pattern appear in transaction prices, quoted midpoint data, or both?
- Mechanism — Could bid-ask bounce, temporary pressure, liquidity replenishment, or genuine repricing explain the behavior?
- Definition — Can the reversal condition and trading rules be identified consistently before the result is known?
- Execution — Which entry and exit prices could realistically have been obtained?
- Costs — What remains after spreads, commissions, fees, slippage, delays, and missed fills?
- Context — Does the relationship change across relevant liquidity, volatility, and directional environments?
- Validation — Does the effect survive unseen periods and defensible execution assumptions?
- Decision — Is there sufficient evidence of a realistic trading opportunity to justify additional research, or should the idea be rejected?
The condensed framework is Observe → Measure → Explain → Execute → Price the Costs → Validate → Decide. The better question is no longer, “Does price usually bounce after this movement?” It is, “After realistic execution and costs, is there enough consistent, repeatable behavior left to justify taking the risk?”
Final Thought
A short-term reversal can be visible on a chart, statistically measurable in historical data, and still be economically useless to a trader. Bid-ask bounce provides a particularly clear example because the transaction-price series can appear to reverse even when the quoted market remains unchanged. Measuring the pattern correctly is only the beginning of understanding what created it.
Other short-term reversal effects may involve genuine temporary price pressure and could remain meaningful under particular conditions, instruments, or execution methods. Whether those effects provide a trading opportunity is an empirical question that requires defensible measurement, realistic trading assumptions, appropriate costs, and validation beyond the data that originally revealed them. The research must be willing to find either a potentially useful result or no practical opportunity at all.
The distinction is central to what an edge actually is. An observation becomes more valuable when it survives increasingly realistic tests, but even promising historical evidence cannot remove execution uncertainty or guarantee future results. The trader's job is to evaluate the opportunity through the broader Extreme to Mean system, not assume that every measurable reversal is something worth trading.
Educational content only. Trading involves substantial risk and is not suitable for everyone.