
In trading education, SMT usually means Smart Money Technique divergence: two related markets reach comparable swings, one makes a new extreme, and the other fails to confirm it. ES might make a lower low while NQ holds above its comparable low, or NQ might make a higher high while ES fails to exceed its own. The useful observation is straightforward; the predictive story layered on top of it deserves more caution.
That makes SMT a natural fit inside The Market, because the concept is really about context between markets. The sharper question is not simply “Did SMT appear?” It is: Did this defined intermarket disagreement add useful evidence to a trade thesis that already makes sense?
What Is SMT Divergence?
SMT divergence is best understood as intermarket non-confirmation. Two markets that normally share important economic drivers approach corresponding highs or lows, but only one confirms the new extreme. The market that refuses the lower low shows relative strength, while the market that fails to make the higher high shows relative weakness.
For example, suppose ES trades below a prior comparable low while NQ holds above its own. Traders commonly call that a bullish SMT divergence because NQ refused to confirm the new downside extreme. Reverse the relationship at the highs and the pattern is commonly described as bearish SMT.
The durable definition is therefore not a rigid “higher high versus lower high” template. It is ONE MARKET TAKES A COMPARABLE EXTREME; THE OTHER DOES NOT. Failure to confirm is evidence of disagreement—not proof that the move must fail.
Strip Away the Branding: It Is Intermarket Non-Confirmation
The underlying observation is not controversial or unique to one trading framework. Finance has long studied correlation, relative strength, dispersion, lead-lag relationships and the timing of local extremes across related markets. What SMT adds is a particular trading-language interpretation of that disagreement.
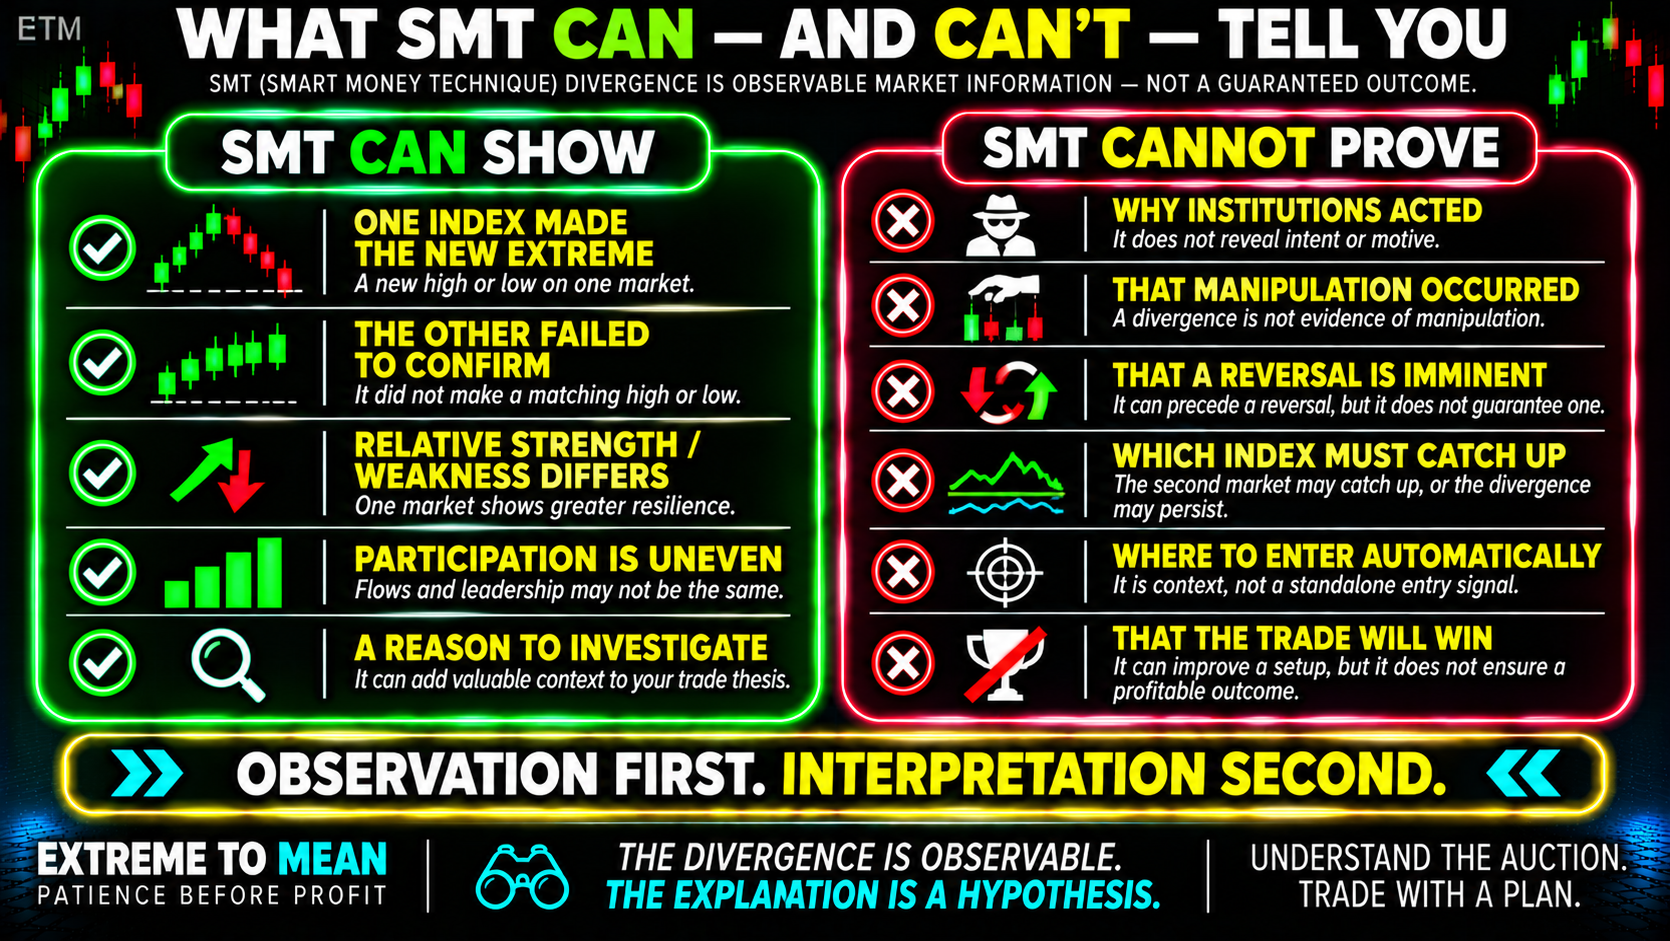
That distinction matters because DIVERGENCE ≠ MANIPULATION. If NQ makes a new high while ES does not, the charts establish that the two indexes behaved differently at that moment. They do not establish who caused the divergence, whether institutions deliberately engineered it, or whether one market was manipulated to trap traders.
The observable fact is disagreement. The identity and intent of whoever created the underlying order flow are usually unknowable from the chart alone. SMT is easier to defend as a relative-strength observation than as proof of hidden institutional intent.
Why ES and NQ Are Useful Markets to Compare
ES and NQ are sensible comparison markets because both represent major U.S. equity benchmarks and often respond to many of the same macroeconomic forces. Their relationship can be strong without the indexes being identical, which is exactly what makes intermarket comparison possible. SMT needs relationship without identity.
The S&P 500 and Nasdaq-100 contain different constituent universes and weighting exposures, so sector leadership can naturally make one benchmark stronger than the other. Strong technology participation, for example, can allow NQ to make a new high while ES lags. Divergence does not require anything to be “wrong”; different baskets can simply receive different flows.
This is why context comes before the candle even when two charts are being compared. A divergence around a technology-specific catalyst, major constituent earnings or sector rotation may be telling you about leadership rather than exhaustion. Before fading disagreement, ask whether there is a legitimate reason the indexes should currently behave differently.
Bullish and Bearish SMT Examples
Consider a bullish example. ES has a prior low at 6,000 and later trades to 5,995, while NQ reaches the comparable impulse and holds above its own prior low. ES has confirmed a new downside extreme while NQ has not, so NQ is displaying relative strength.
That does not mean “buy ES” or “buy NQ.” It means the downside move lacks uniform confirmation across the pair. RELATIVE STRENGTH ≠ ENTRY.
A bearish example works in reverse. NQ makes a fresh high while ES fails to exceed its comparable high. ES is showing relative weakness relative to NQ, but NON-CONFIRMATION ≠ REVERSAL; NQ can reverse, ES can catch up, both can consolidate, or the relative strength can persist.
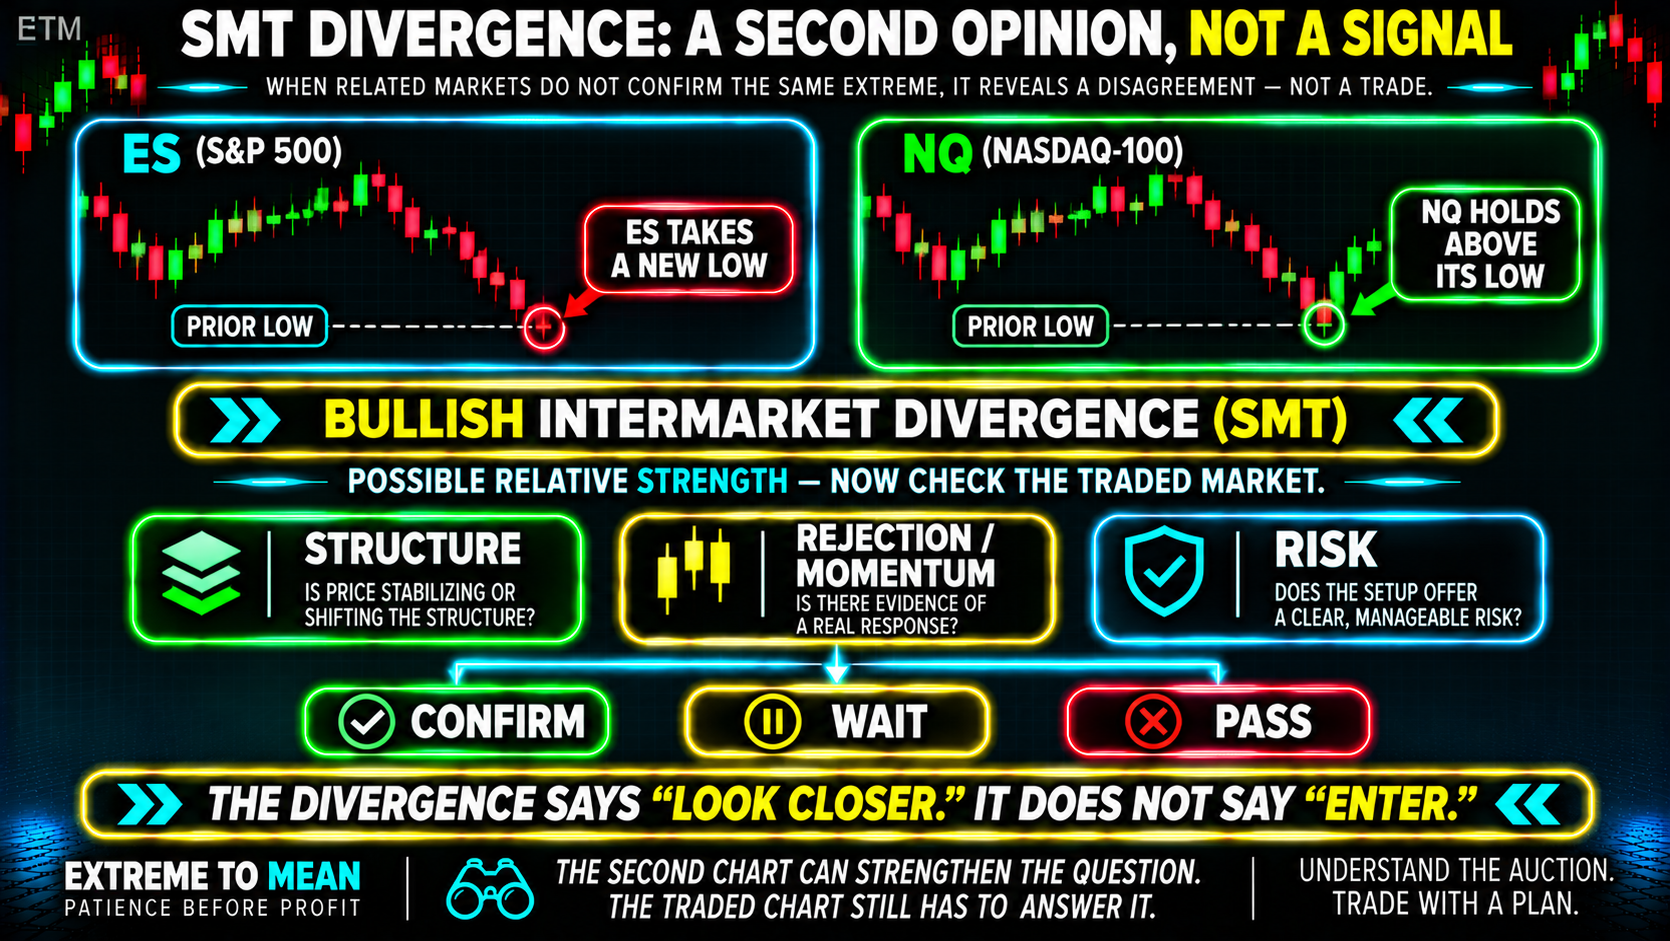
The divergence says look closer. It does not say enter. The second chart can strengthen the question; the traded chart still has to answer it.
Alignment Matters Before Interpretation
Two charts cannot disagree about the same event if you are comparing different events. A Tuesday morning NQ swing should not be paired with a Monday afternoon ES swing simply because the levels create a visually attractive divergence. Use the same timeframe, corresponding timestamps and genuinely comparable impulses.
Futures contract alignment matters too. Compare corresponding ES and NQ contract months, particularly around quarterly roll periods, because mismatched expirations can create price offsets that manufacture apparent divergence. Back-adjusted continuous charts also deserve care when the analysis depends on exact highs and lows.
Define the swing rule before interpreting the result. It might be a prior session high or low, a confirmed pivot or another objectively defined swing, but whatever rule is used should remain stable. If “close enough” has no rule, the chart can always be made to fit afterward.
Why Divergence Can Disappear—or Persist
One of SMT's biggest practical limitations is that the second market can simply catch up. NQ may break a high while ES initially fails, only for ES to exceed its own high five minutes later. The original divergence was real at 10:00 and gone at 10:05 without producing a reversal.
The opposite can also happen: relative strength can persist. If large Nasdaq constituents are leading the session, NQ may continue making new highs while ES continues lagging. TEMPORARY DIVERGENCE ≠ REQUIRED CONVERGENCE, and correlation describes tendency—not a deadline for the two indexes to meet again.
That is also why a daily correlation statistic should not be converted mechanically into a five-minute trading rule. Correlation changes with the measurement horizon, and highly correlated markets do not need to make every intraday swing at the same moment. CORRELATION ≠ PERFECT SYNCHRONIZATION.
Where SMT Can Add Useful Confirmation
SMT becomes more useful when it adds context to an idea that already has a reason to matter. Intermarket disagreement around a meaningful prior high, low, session extreme or other objectively defined decision area may deserve more attention than a tiny mismatch buried in random mid-range noise. The divergence can qualify attention; it does not qualify execution by itself.
The traded market still needs its own evidence. Depending on the strategy, that might include rejection, structural stabilization, momentum change or the reclaim or loss of a relevant level. The article on how market conditions change the quality of a setup reinforces the same principle: a pattern does not escape the environment in which it appears.
The cleaner hierarchy is LOCATION / SETUP → SMT CONTEXT → PRICE CONFIRMATION → RISK. SMT CONTEXT ≠ PRICE CONFIRMATION. If removing the SMT label leaves no trade thesis, the divergence may be inventing the trade rather than confirming one.
The Hindsight and Cherry-Picking Problem
SMT is especially vulnerable to hindsight because almost every busy session contains small moments when related markets do not match perfectly. After a reversal has already happened, it is easy to search backward until one mismatched ES/NQ swing appears and label it “perfect SMT.” The divergences that disappeared, persisted or preceded nothing memorable tend to be forgotten.
Adding more comparison markets can worsen the problem. A trader watching ES/NQ, ES/YM, NQ/YM, ES/RTY and NQ/RTY gives themselves many opportunities to find some disagreement after the fact. The more pairs you watch, the easier it becomes to find the divergence you wanted to see.
Prospective testing is cleaner. Define the markets, contract months, timeframe, swing criteria, time tolerance and invalidation before reviewing the outcome, then record every qualifying event under the same rules. The market comes first, and the research process should not change its definition simply because one chart produced a compelling screenshot.
What the Evidence Does—and Does Not—Show
There is a legitimate empirical foundation for studying relationships between correlated markets. Academic work has documented lead-lag behavior and timing differences around local extrema among related instruments, while CME research shows that major U.S. equity indexes can be highly correlated and still experience dispersion because their composition differs.
That does not establish the specific ICT-style claim that an SMT divergence reliably predicts reversal. Public educational material is extensive, but rigorous public validation of one standardized SMT definition remains limited, and different educators use different swing, timing and confirmation rules. POPULAR CONCEPT ≠ VALIDATED EDGE.
The better research question is not “Can I find examples where SMT appeared before a reversal?” Of course those examples exist. Ask instead: Does a predefined SMT event materially change reversal or continuation outcomes compared with otherwise similar situations where no divergence occurred?
That is the difference between storytelling and testing. Test every signal the rule generates—not just the screenshots worth posting. If the concept cannot define what qualifies, what invalidates it and what comparison group matters, it is not yet a clean research claim.
The SMT Confirmation Checklist
Before treating ES/NQ disagreement as useful evidence, ask:
- Are the two markets related enough for the comparison to make sense?
- Am I comparing the same contract month?
- Are the charts using the same timeframe, timezone and corresponding timestamps?
- What exact swing or level am I comparing?
- Did one market genuinely make a new extreme while the other failed?
- Could index composition, sector leadership or current news explain the divergence?
- Has the second market already caught up and erased the divergence?
- Is the disagreement occurring at a meaningful location or random noise?
- Has the market I actually plan to trade produced its own confirmation?
- Would I take this trade if I removed the SMT label?
That last question is the most useful filter. If the answer is no, SMT may be supplying a story rather than supporting a trade. The ETM free tools can help structure that kind of review, but no checklist turns context into an automatic entry.
The ETM Relationship → Align → Divergence → Confirm → Invalidate Framework
Use RELATIONSHIP → ALIGN → DIVERGENCE → CONFIRM → INVALIDATE. RELATIONSHIP asks whether the markets are meaningfully connected; ALIGN ensures the same contract cycle, time and comparable swing; DIVERGENCE records the objective failure to confirm. CONFIRM asks whether the traded market itself supports the thesis, and INVALIDATE defines what destroys either the divergence or the trade idea.
The resulting decision is WATCH / CONFIRM / PASS. That keeps the second market in the role where it is most defensible: a second opinion. Use the second market to ask a better question—not to outsource the trade decision.
Final Thought
SMT divergence is best understood as intermarket non-confirmation. ES and NQ often move together because both represent major U.S. equity benchmarks, but they are different indexes with different constituent mixes and different sources of leadership. When one makes a new high or low and the other does not, that disagreement can reveal relative strength, relative weakness or uneven participation.
What it cannot do is identify who caused the divergence, prove institutional manipulation or guarantee that a reversal comes next. The second index can catch up, the stronger index can continue leading, or both markets can move into a different condition altogether. A divergence identifies disagreement; it does not tell you which market will win the argument.
The useful question is therefore not simply “Did SMT appear?” Ask whether the comparison was aligned, the swing rule was defined beforehand, the divergence occurred somewhere meaningful and the traded market subsequently provided its own evidence. SMT can strengthen a trade thesis. It should not create one by itself.
Educational content only. Trading involves substantial risk and is not suitable for everyone.