
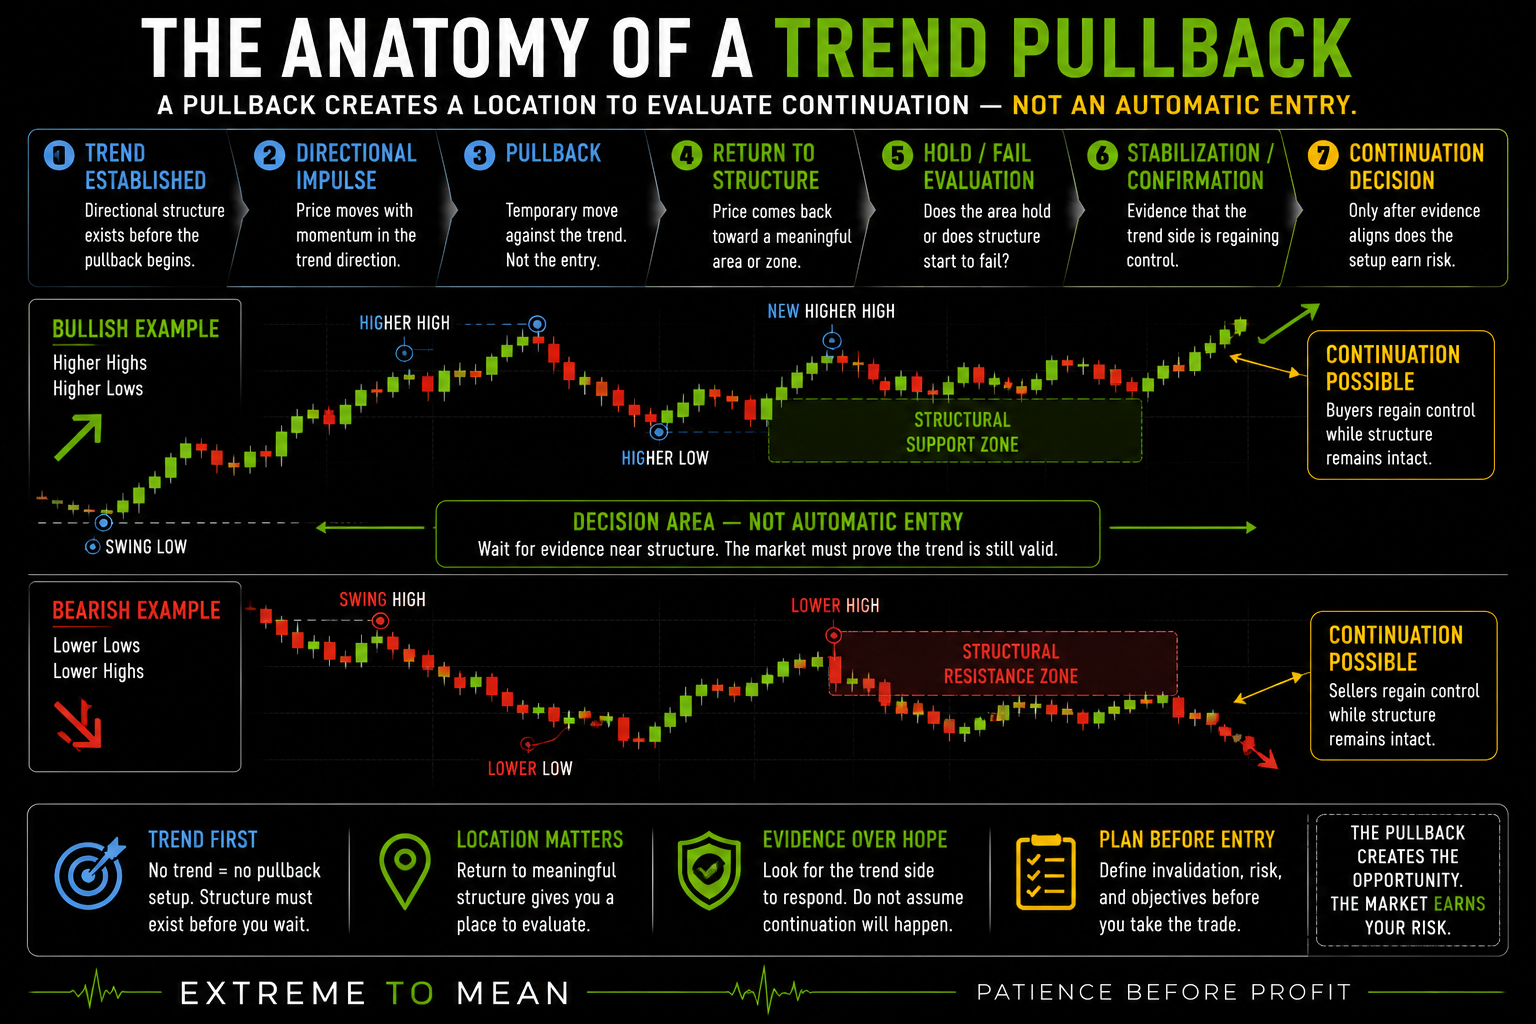
The basic sequence is Trend → Impulse → Pullback → Structure → Stabilization → Continuation Decision. Instead of chasing price after a directional move has already traveled, the trader allows price to return toward an area that matters and watches what happens there. Patience in this setup means waiting for the market to prove that the trend still exists rather than assuming every cheaper or more expensive price is an opportunity.
What a Trend Pullback Actually Is
A trend pullback is a temporary move against an established directional structure. In a bullish trend, price may produce a higher high, higher low, and another higher high before correcting lower; in a bearish trend, the sequence is reversed. The pullback creates a potential continuation location because price is moving back toward the trend rather than forcing the trader to chase its latest extreme.
The countertrend movement itself is not the entry signal. In a bullish example, the trader is asking whether buyers can regain control before the meaningful bullish structure fails; in a bearish example, the question is whether sellers can reassert control before the rally becomes something larger. The setup therefore requires both an existing trend and evidence that the correction remains compatible with that trend.
The Trend Must Exist Before the Pullback
A trader cannot call every decline a bullish pullback simply because buying lower sounds attractive. Without established directional structure, price may be rotating inside a range, chopping, failing a breakout, or beginning a reversal. A pullback is defined partly by what price is pulling back from.
Start with price structure rather than a mechanical indicator rule. Successive higher highs and higher lows, directional progress, breaks that gain acceptance, and prior corrections that preserve structure can all contribute to a bullish read, with the inverse applying to a bearish trend. Fidelity’s technical-analysis education describes moving averages as tools that can help smooth price movement and reveal broader trend direction, but the underlying interpretation still begins with price behavior rather than one indicator. (fidelity.com)
Moving averages can therefore support the read without defining the entire setup. A rising average may coincide with an area where a pullback stabilizes, but touching an EMA does not mean the market has provided a trade. Structure defines the environment; indicators can help describe it. (fidelity.com)
A Pullback Must Return Toward Something Meaningful
The phrase return to structure is central to the setup. A prior swing, broken resistance that may act as support, broken support that may act as resistance, a consolidation boundary, higher-timeframe level, or another established support or resistance area can give the correction a reason to be evaluated. This is why location is the first filter rather than something added after a pattern already looks attractive.
Support and resistance are better treated as areas than perfect ticks. Fidelity describes them as zones where supply and demand have historically interacted and notes that broken resistance can sometimes act as support, while also warning that technical analysis is interpretive rather than exact. Price may stop short, penetrate slightly, reclaim the area, or test a cluster of nearby references, which is why a good location is a zone, not a perfect price. (fidelity.com)
Fibonacci retracements can be handled the same way. Fidelity describes common retracement levels as possible support or resistance areas, but a percentage does not tell the trader whether the trend will resume. A retracement tool can identify somewhere worth watching; it cannot turn 38.2%, 50%, 61.8%, or any other number into automatic permission to enter. (fidelity.com)
A Pullback Is Not Automatically a Reversal
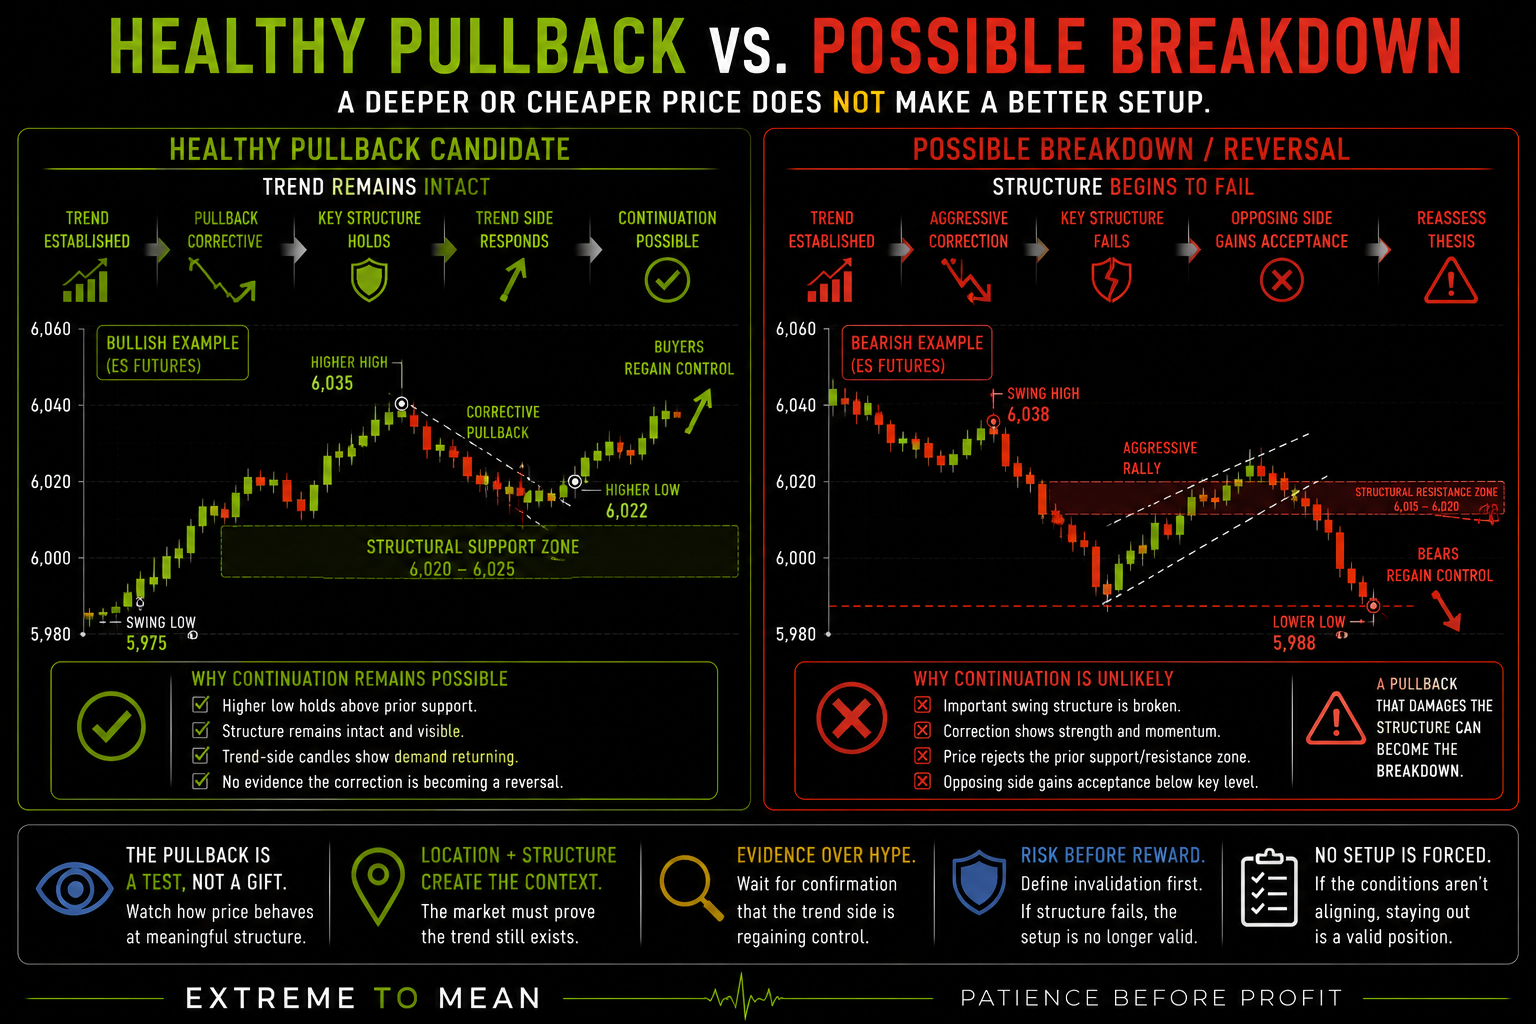
Every directional market eventually moves against its dominant direction. The important distinction is whether that countertrend movement is correcting the existing structure or beginning to change it. A healthy correction may preserve important swings and directional context, while a developing breakdown may begin breaking those references, building opposing structure, and preventing the original trend from regaining control.
Depth by itself does not answer the question. A shallow pullback can still offer poor location, weak risk definition, or very little room after an extended move, while a deeper correction can remain structurally valid depending on volatility, timeframe, and the location of actual invalidation. A cheaper price is not necessarily a better location if the market had to damage the original thesis to reach it.
That is why the setup should never become “the bigger the dip, the better the bargain.” If countertrend candles are expanding, meaningful structure is failing, and the trend side is showing little response, the trader is allowed to wait. Sometimes the pullback is becoming the breakdown, and recognizing that possibility is part of qualification rather than a failure to buy the perfect low.
Wait for the Pullback to Stop Behaving Like a Pullback
One of the easiest mistakes is entering because price appears to have pulled back “enough.” The trader sees the trend, watches price return toward a desired area, and assumes that location alone means continuation should begin. The cleaner process is to wait for evidence that countertrend pressure is no longer making easy progress.
That evidence can take different forms depending on the strategy. Failed continuation against the trend, rejection around meaningful structure, a higher low or lower high, reclaim of nearby structure, momentum rotation, or renewed directional participation can all contribute to the decision. No individual candle or indicator is mandatory because confirmation should help time an idea that already makes sense rather than manufacture the reason for the trade.
The decision order is therefore Trend → Pullback → Location → Structure → Confirmation. Starting with a bullish candle, RSI reading, or moving-average touch reverses that process by finding a trigger first and trying to justify it afterward. The trader’s job is to evaluate whether the original direction is actually beginning to reassert itself.
A Bullish Futures Example
Suppose ES moves from 6,000 to 6,020, pulls back to 6,010, then advances to a new high around 6,035. Instead of chasing 6,035, the trader identifies an area around 6,020–6,025 where prior structure may make a future correction worth evaluating. The assumption is not that price must hold there; the area simply creates a useful decision point.
If price returns to that zone, several outcomes are possible. Selling may slow, structure may remain intact, and buyers may begin regaining control; price may instead chop without producing any evidence of resumption; or the market may move through the area, damage the meaningful swing structure, and fail to reclaim it. The pullback is where the continuation thesis gets tested rather than where it gets assumed.
| Question | Healthy Pullback Candidate | Possible Breakdown / Reversal |
|---|---|---|
| Prior trend | Clearly established | May be weakening |
| Countertrend move | Corrective | Increasingly impulsive |
| Key structure | Remains relevant | Begins failing |
| Trend-side response | Returns near meaningful area | Weak or absent |
| Confirmation | Supports resumption | Supports opposing direction |
| Invalidation | Clear | Original thesis may already be damaged |
| Trader response | Evaluate continuation | Reassess; do not force continuation |
These are tendencies and decision inputs, not a mechanical prediction model. A bearish example uses the same logic in reverse: an established series of lower highs and lower lows rallies toward meaningful structure, and the trader waits to see whether sellers actually regain control. Trend pullbacks are continuation setups in either direction, not simply another version of “buy the dip.”
Confirmation Still Needs Risk and Room
Even when the pullback stabilizes, a recognizable setup is not automatically a usable trade. The trader still needs to define what structural event would make the continuation thesis wrong and whether enough distance remains toward a realistic opposing level or objective. A stop placed mechanically below every pullback low can miss the real question of where the setup itself stops making sense. A trend pullback is only one setup type covered within The Setup curriculum, and the same qualification standards apply.
Available room matters for the same reason. A clean bullish pullback that confirms directly beneath the prior high or another major resistance area may have less useful space than its chart pattern suggests. Entry, invalidation, opposing structure, volatility, and available distance all belong to the qualification decision.
The same-looking pullback can also behave differently across market environments. A controlled correction during a directional session is not the same as a similar shape appearing inside chop, and higher-timeframe context or trend maturity can change what the setup means. That broader principle is developed in how market conditions change the quality of a setup.
Do Not Chase the Resumption
Waiting for the pullback does not guarantee the market will provide a clean entry. Price may reach the structural area, stabilize, and launch before the trader’s requirements are satisfied. Correct analysis does not create an obligation to chase afterward.
Once price moves materially away from the decision area, stop distance may increase while available room shrinks. The trader who correctly avoided chasing the initial impulse can undo that discipline by chasing the resumption because “I knew it would hold.” A missed pullback can remain a missed trade.
This is patience without passivity. The trader prepared the area, observed the correction, and knew what evidence was required, but the market never owed an entry. Waiting for a better location is useful only if the trader is also willing to let that location go when price leaves without them.
Trend Pullback, Breakout Retest, and Mean Reversion Are Different Ideas
A trend pullback begins with directional structure that already exists and then corrects toward meaningful structure before continuation is evaluated. A breakout and retest begins with price escaping an established boundary and later returning to test whether the new side of that boundary is gaining acceptance. The two can look similar after the fact, but their starting conditions and setup logic are different.
Mean reversion asks a different question again. Instead of using a correction to potentially rejoin the dominant move, mean reversion evaluates whether price has become sufficiently extended for movement back toward balance to deserve attention. Extreme to Mean can therefore apply the same principles of patience, location, structure, and risk to both continuation and reversion without pretending they are the same trade.
A Practical Trend-Pullback Decision Sequence
Use Trend → Pullback → Structure → Hold/Fail → Confirm → Risk. Each step removes a different source of assumption and forces the setup to remain coherent from the original trend through the final risk decision. The sequence is designed to prevent a simple dip or rally from becoming a trade merely because the trader already wants continuation.
- Identify the trend: Has price established meaningful directional structure?
- Identify the impulse: What directional move is now being corrected?
- Let price pull back: Do not chase the original move.
- Find meaningful structure: Where would continuation logically be evaluated?
- Watch the correction: Is it stabilizing or damaging the original trend?
- Wait for evidence: Is the trend side beginning to regain control?
- Define invalidation: Where is the continuation thesis actually wrong?
- Check room: Is there sufficient space toward a realistic structural objective?
- Decide: Only now does the setup earn—or fail to earn—risk.
The better question is not, “Has price pulled back enough for me to enter?” Ask: “Has price returned to a meaningful area while the original trend remains structurally intact—and is the market now showing evidence that continuation is actually resuming?” Then challenge the bias once more: “If I were not already biased toward the trend, what evidence would convince me this is still a correction rather than the beginning of structural failure?”
Final Thought
A trend pullback strategy is not a formula for buying cheaper prices in an uptrend or shorting more expensive prices in a downtrend. The setup starts with established directional structure, waits for price to return toward something meaningful, and then asks whether the trend can prove that it still deserves attention. A pullback provides the location for that evaluation; it does not provide the answer.
Waiting for price to come back is only the first form of patience. The second is waiting for structure, confirmation, invalidation, and available room to align before risking capital—and accepting that sometimes the market leaves without giving the trade you wanted. Readers who want to go deeper into how trend, volatility, participation, and broader market context change these decisions can continue with Decode the Market.
Educational content only. Trading involves substantial risk and is not suitable for everyone.