
“This Has Gone Too Far” Is a Dangerous Starting Point
A trader sees price moving farther from balance and naturally imagines symmetry: if price traveled this far away, eventually it should travel back. But every additional point of extension may also be evidence that the pressure driving the move is still winning. The market can become more extreme faster than the trader’s conviction can become more correct.
The better question is not simply, “How far is price from the mean?” Ask what is powerful enough to keep pushing price farther away and whether that force is still producing progress. The stretch is the result; the trader still needs to understand the pressure creating it.
This lesson is part of the Market curriculum.
This lesson builds directly on what the mean really is. A mean or balance reference gives us something to measure price against, but distance from that reference is only one observation. Mean-reversion trading becomes more useful when we stop treating distance as proof and start asking what created the separation.
What Does “Stretched” Actually Mean?
For our purposes, price is stretched when it has moved meaningfully away from a defined reference or area of balance relative to the trading horizon and current environment. “Far” is not universal because twenty points can be extraordinary in one market condition and ordinary in another. An extreme is not a price; it is a relationship between price and the reference being used to judge it.
The reference matters, the horizon matters, and volatility matters. Price can look extremely stretched from a fast moving reference while remaining completely normal relative to a broader one, and the reference itself may also be moving. A useful description therefore sounds more like price is materially extended from this defined reference in this environment than simply price is too high.
Distance Is the Observation, Not the Cause
Suppose ES is fifty points above a reference. That tells us something about location, but the same fifty-point separation could have developed from a surprise economic release, a slow trend, thin liquidity, forced short covering, broad risk appetite, or a speculative burst. Two charts can show the same distance from the mean and represent completely different markets.
That distinction matters because the cause can change what happens next. A temporary burst into poor liquidity may fade quickly, while a genuine repricing backed by persistent participation may continue much farther than recent history suggested. The number alone cannot tell us which market we are dealing with.
Start With the Auction
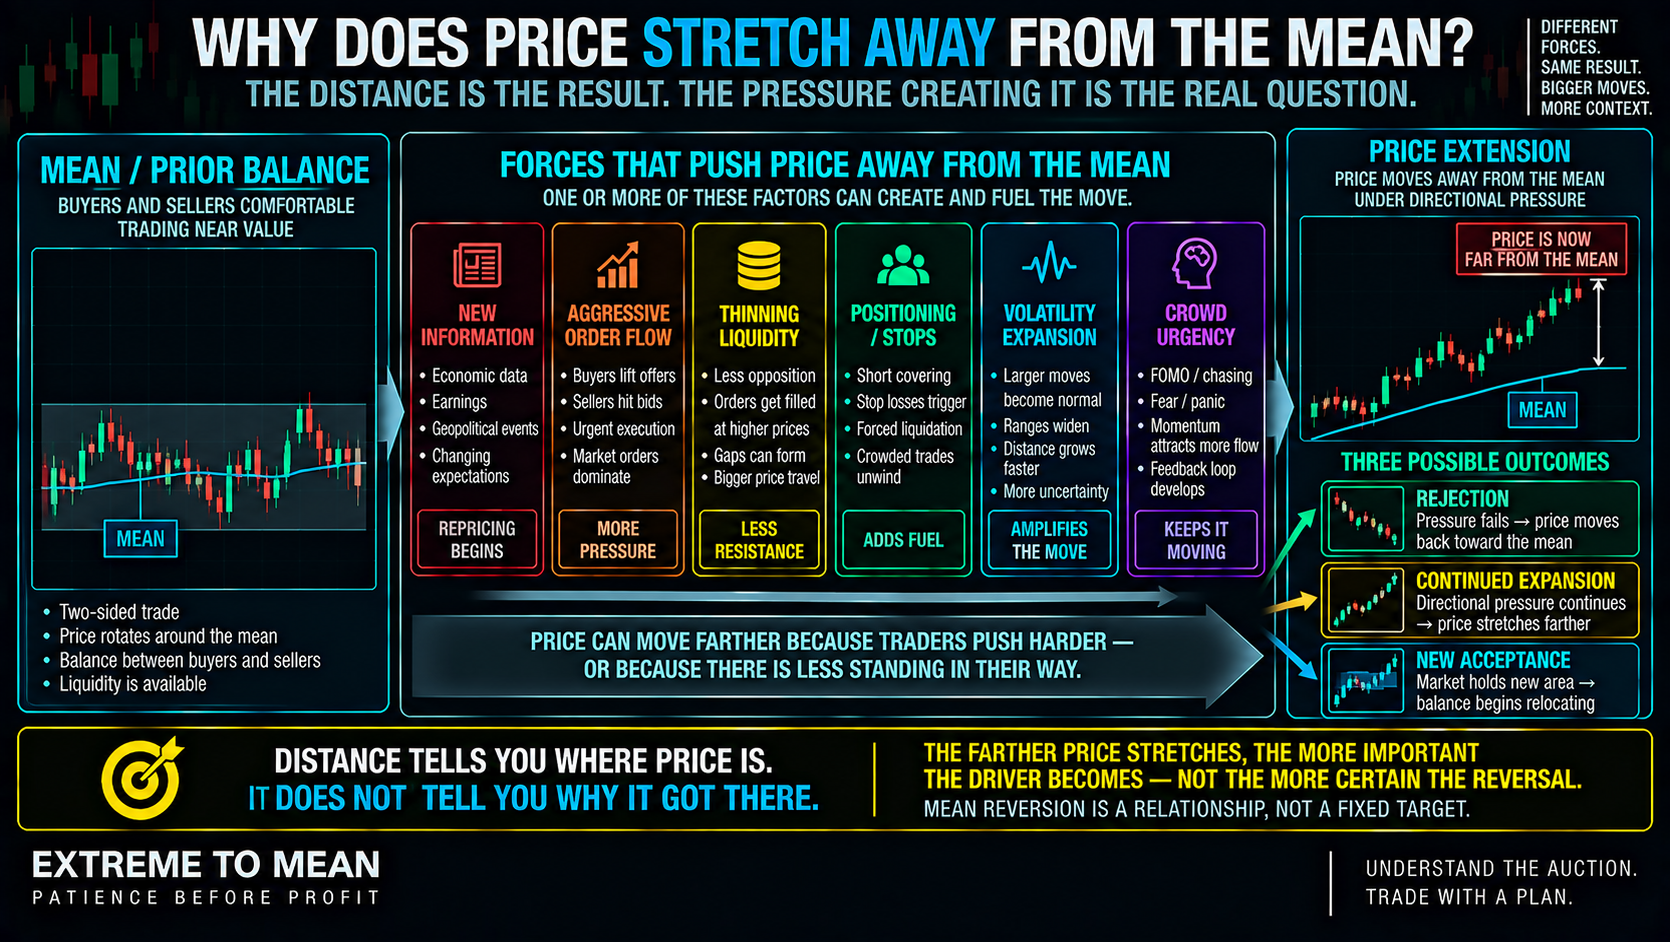
Price tends to remain closer to balance when buyers and sellers are comfortable conducting business around the existing area. To travel materially away, the market usually needs a change in urgency, available opposing liquidity, or both. Price stretches when the market can no longer conduct enough business near the old balance.
Aggressive buyers can consume available offers and force transactions to occur at progressively higher prices, while aggressive sellers can consume bids and push transactions lower. That does not mean there are literally “more buyers than sellers,” because every completed trade has both sides. It means one side is demanding execution more urgently relative to the liquidity available to meet that demand.
This connects directly to the broader auction-and-liquidity framework. The same amount of aggressive activity can create very different price travel depending on whether opposing liquidity is deep and replenishing or thin and withdrawing. Price can move farther because traders push harder—or because there is less standing in their way.
Momentum Is What Persistent Pressure Looks Like
Momentum is often what the trader notices after the stretch has already started. Price begins moving faster, directional bars widen, pullbacks remain shallow, and repeated attempts to continue keep succeeding. Momentum describes the persistence of the move; it does not always tell us what started it.
Once the movement becomes obvious, the move itself can attract additional activity. Breakout traders may enter, traders positioned the other way may exit, stops may trigger, systematic strategies may respond, and discretionary traders may chase. Price moves, participants react to the move, their reaction creates more flow, and price can stretch farther.
That feedback explains why “it already moved too far” is not a mechanism that stops anything. An extended move can create the exact behavior that extends it further, particularly when opposing liquidity remains weak. Once movement itself becomes information, the move can attract the behavior that keeps it moving.
Stops, Covering, and Forced Activity Can Accelerate the Move
Suppose price breaks above a widely watched high and short stops begin triggering. Those exits become aggressive buying, while breakout participants may also enter on the same side. The resulting burst can accelerate price without requiring us to claim that anyone deliberately “hunted” those stops.
A fast rally can also contain short covering, new long positions, hedging, arbitrage, and other activity at the same time. From price alone, we generally cannot know exactly how much of each motive is present. Order flow can reveal urgency more reliably than it can reveal every reason behind that urgency.
The same logic applies to sharp declines. Long liquidation, new short selling, stop orders, hedging, or forced risk reduction can all create marketable selling, particularly when leverage makes participants less able to wait. The chart shows the resulting pressure; participant motive is a separate question.
New Information Can Change the Price the Market Is Willing to Accept
A major economic report, central-bank decision, earnings result, or geopolitical event can change expectations quickly enough that the old area of balance no longer represents the same market. Price may travel rapidly because participants are repricing rather than simply overreacting. A market can be far from the old mean because the old mean belongs to an old set of expectations.
The size of the headline alone does not determine the size of the reaction. A modest surprise can produce a large move when positioning was crowded the other way, while important news can produce little movement when it was already anticipated. Market reaction depends on the new information relative to expectations, existing positioning, and available liquidity.
Positioning can then amplify the original catalyst. Traders caught on the wrong side may exit, their exits create more directional flow, and that movement can force still more participants to adjust. The reason a move begins does not have to be the reason it keeps going.
Volatility Changes What “Far” Means
A distance that looks extraordinary during a quiet regime can become normal when volatility expands. Traders who learned that thirty points was “too far” during one environment can enter far too early when the market begins moving at twice the prior pace. An extreme is only extreme relative to the environment that produced it.
This is why market conditions change the quality of a setup. The distribution of normal movement can change while the trader is watching it, which means historical distance remains useful only when interpreted in current context. Expanding volatility does not predict direction, but it can push the boundaries of what ordinary movement looks like.
Crowd behavior can add another layer, although we should be careful with the language. Fear, FOMO, and panic may help explain urgent behavior, but the chart itself shows speed, participation, volume, and price travel more reliably than it shows emotion. We can observe urgent behavior more reliably than we can observe the emotion that caused it.
Same Distance, Completely Different Market
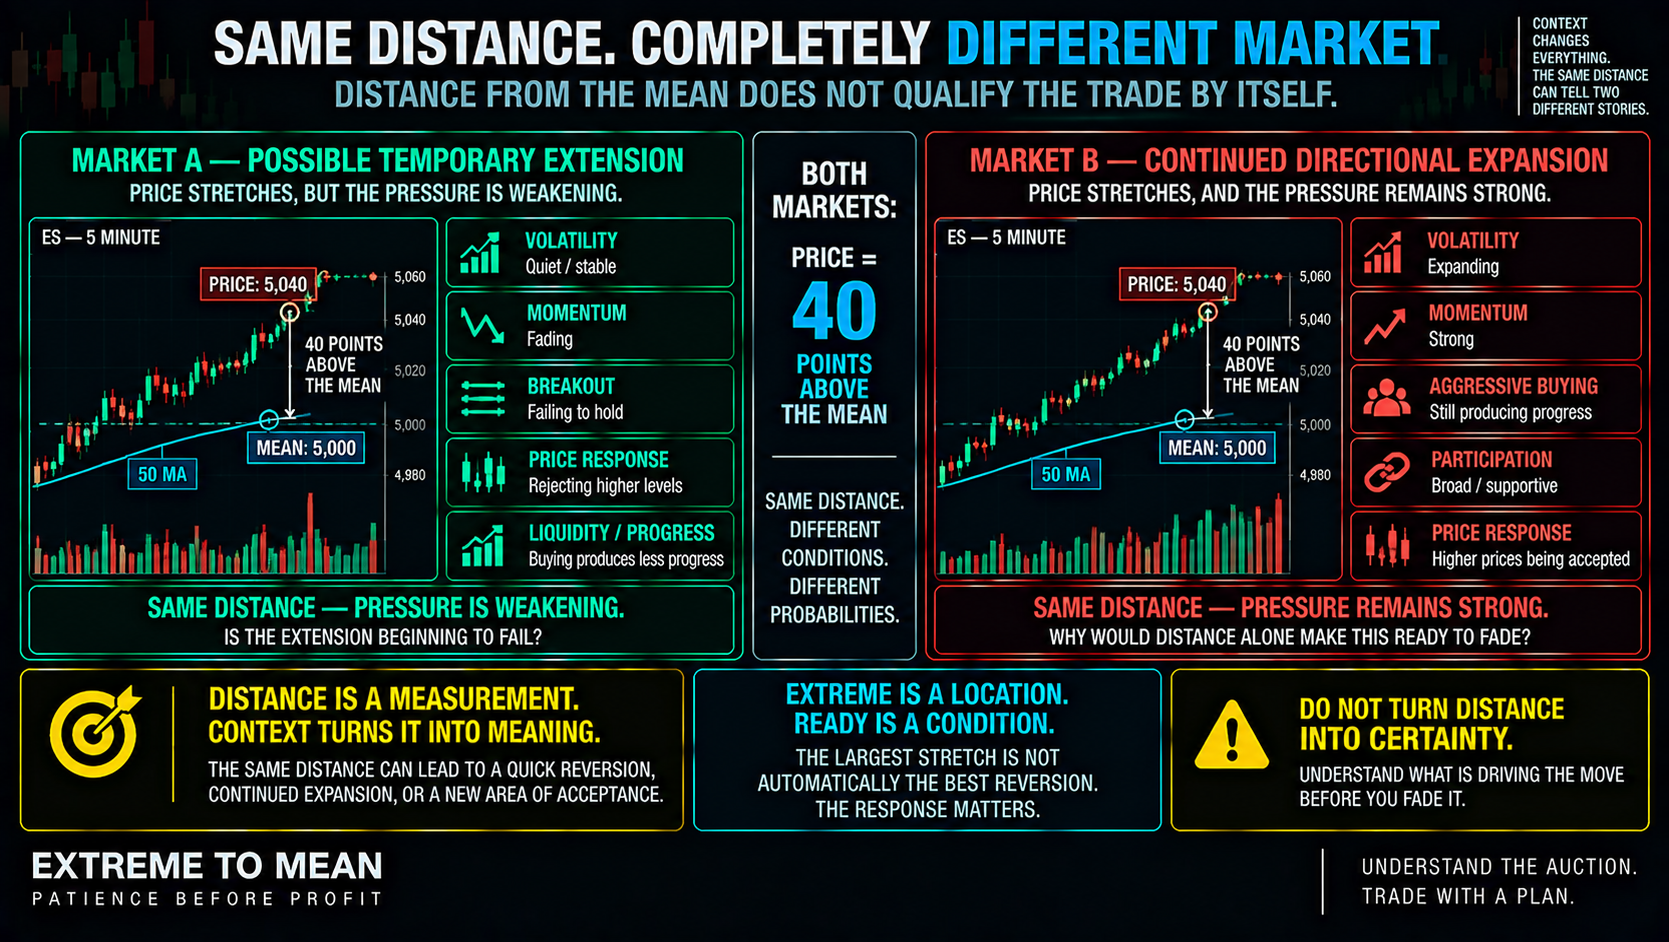
Imagine two markets sitting forty points above their respective references. In the first, volatility is quiet, momentum is fading, the breakout cannot hold, and price repeatedly rejects higher levels. In the second, volatility is expanding, aggressive buying remains strong, broader participation supports the move, and higher prices continue being accepted.
The distance is identical, but the market condition is not. The first environment may be developing evidence of temporary extension, while the second may still be in directional expansion. Distance alone cannot qualify the trade.
Stretch Is Not Exhaustion
A market can be extremely stretched and still possess powerful momentum. Exhaustion asks whether the aggressive side is losing participation or failing to produce further progress, while stretch asks how far price has moved relative to the reference. Distance tells you where price is; exhaustion tells you something about whether the pressure getting it there may be weakening.
That distinction prevents one of the most damaging mean-reversion errors: assuming far away = ready to reverse. The strongest directional markets can remain extended for surprisingly long periods while the mean follows behind and shallow pullbacks repeatedly fail to restore balance. The market can be most extended precisely when the trend is strongest.
Stretch is also not the same thing as valuation or divergence. NQ trading far above VWAP does not prove that the Nasdaq is fundamentally overvalued, and distance from a mean does not automatically imply momentum, breadth, or order-flow divergence. Those are separate observations that may or may not support the reversion thesis.
What the Market Does After the Stretch Matters More Than Distance Alone
Once price becomes extended, it can reject, consolidate, keep expanding, or begin establishing acceptance at the new prices. Those outcomes are very different even though each began with price far from balance. The response tells us more about the quality of the reversion question than distance alone.
A somewhat smaller extension that immediately fails, rejects higher prices, and returns through the breakout area can provide better evidence than a gigantic extension that keeps holding. The largest stretch is not automatically the best reversion. The response matters.
Acceptance can also change the meaning of the original extreme. If price holds, participation develops, pullbacks remain supported, and the dynamic mean begins migrating toward the new area, the market may be moving from extension toward a new balance. That is another reason the trader cannot freeze the original reference and continue fading indefinitely.
Extreme Is a Location. Ready Is a Condition.
ETM is built around extremes, but identifying an extreme is only the beginning. A market can be extreme without being qualified for a trade, just as a meaningful location can deserve attention without deserving an entry. Extreme describes where; ready describes whether enough evidence exists to act.
Before thinking about entry, ask what pushed price there, whether that pressure is still producing progress, whether liquidity is resisting or giving way, and whether current volatility makes the distance unusual. Then ask whether price is rejecting the area or accepting it, whether the reference itself has moved, and whether the strategy has an actual thesis. Those questions move the trader from reaction back toward evaluation.
That also means more extreme is not automatically more attractive. Adding to a losing mean-reversion trade merely because price traveled farther can be exactly backwards if the increasing distance is evidence that momentum, volatility, or repricing remains strong. Any scaling process has to be predefined and tested rather than improvised because the market now “looks cheaper.”
The ETM Stretch Framework
The point of the framework is not to predict the exact end of an extension. It is to separate location from cause, and cause from trade qualification, so the trader does not turn growing distance into growing certainty. Work from the reference outward.
- Reference — What mean or balance point are you measuring from?
- Horizon — Which trade horizon makes that reference relevant?
- Distance — Has price moved meaningfully away in the current environment?
- Pressure — What observable behavior is pushing the move?
- Liquidity — Is opposing liquidity resisting or giving way?
- Volatility — Is this distance genuinely unusual for the current regime?
- Feedback — Could stops, covering, liquidation, or chasing be reinforcing the move?
- Response — Is price continuing, rejecting, or balancing at the extreme?
- Reference — Is the mean stable or migrating toward price?
- Condition — Does this resemble temporary extension, continued expansion, or new acceptance?
- Qualification — Does the strategy actually have enough evidence to act?
- Risk — Where is the thesis wrong, and can the risk be expressed responsibly?
The condensed version is Reference → Distance → Pressure → Liquidity → Volatility → Response → Thesis → Risk. Distance earns attention, but it does not get the final vote. The trader’s job remains evaluate → qualify → define risk → decide.
Final Thought
Price does not stretch away from the mean because the market is preparing to hand a mean-reversion trader an entry. It stretches because, for some period of time, the forces pushing price away are stronger than the forces keeping it near the prior balance. News, aggressive execution, liquidity, positioning, volatility, forced activity, and crowd behavior can all contribute.
Sometimes that stretch rejects and price reverts. Sometimes price consolidates while the mean catches up, and sometimes the market accepts the new area and establishes a different center entirely. That is why room to revert matters only after the market has produced a qualified reversion thesis rather than simply a large distance.
The farther price stretches, the more important it becomes to understand what is driving the move—not the more certain a reversal becomes. Extreme tells you where to pay attention; it does not tell you the trade is ready. That distinction sits at the heart of the broader Extreme to Mean system.
Educational content only. Trading involves substantial risk and is not suitable for everyone.