
Liquidity is one of those trading terms that can sound more complicated than it needs to be. Traders hear about liquidity pools, stop runs, sweeps, order books, institutional flows, and market makers, then assume the concept requires an advanced understanding of market microstructure before it becomes useful.
It does not. At its most basic level, liquidity describes how easily buying and selling can occur without causing an unusually large change in price. In practical chart reading, it also helps traders identify areas where orders, stops, targets, and participation may be concentrated.
That distinction matters because liquidity is not simply “where the stops are.” Stops can become executable orders when triggered, which means a cluster of stops can contribute to the available business around a level. Once traders understand that connection, many price movements that initially appear random become easier to interpret.
This lesson belongs with the broader market context lessons because liquidity is not an entry signal by itself. It is part of the environment a trader should understand before deciding whether a move deserves attention or risk.
Liquidity in Plain English
Every completed trade requires two sides. A buyer needs a seller, and a seller needs a buyer. The market continually adjusts price as it searches for enough opposing interest for transactions to occur.
A highly liquid market generally has many participants willing to trade near the current price. Orders can often be filled more easily, spreads may remain tighter, and an ordinary transaction is less likely to move price dramatically.
A less liquid market has fewer participants or less available quantity near the current price. An order may need to reach through several price levels before it can be completed, producing wider spreads, faster jumps, partial fills, and less predictable execution.
Liquidity therefore has two closely related meanings. Market liquidity describes how easily an instrument can be bought or sold. Liquidity areas describe price levels where a greater concentration of orders may be waiting or may become active.
The first helps explain execution quality. The second helps explain why price frequently accelerates around certain chart locations. Neither concept guarantees what price will do, but both help explain the conditions through which price is moving.
A trader who understands how the market moves through auction, liquidity, and emotion has a stronger framework for interpreting these movements. Price is not searching for a perfect technical pattern; it is moving through an auction where participants continually respond to changing prices.
Why Obvious Levels Attract Price
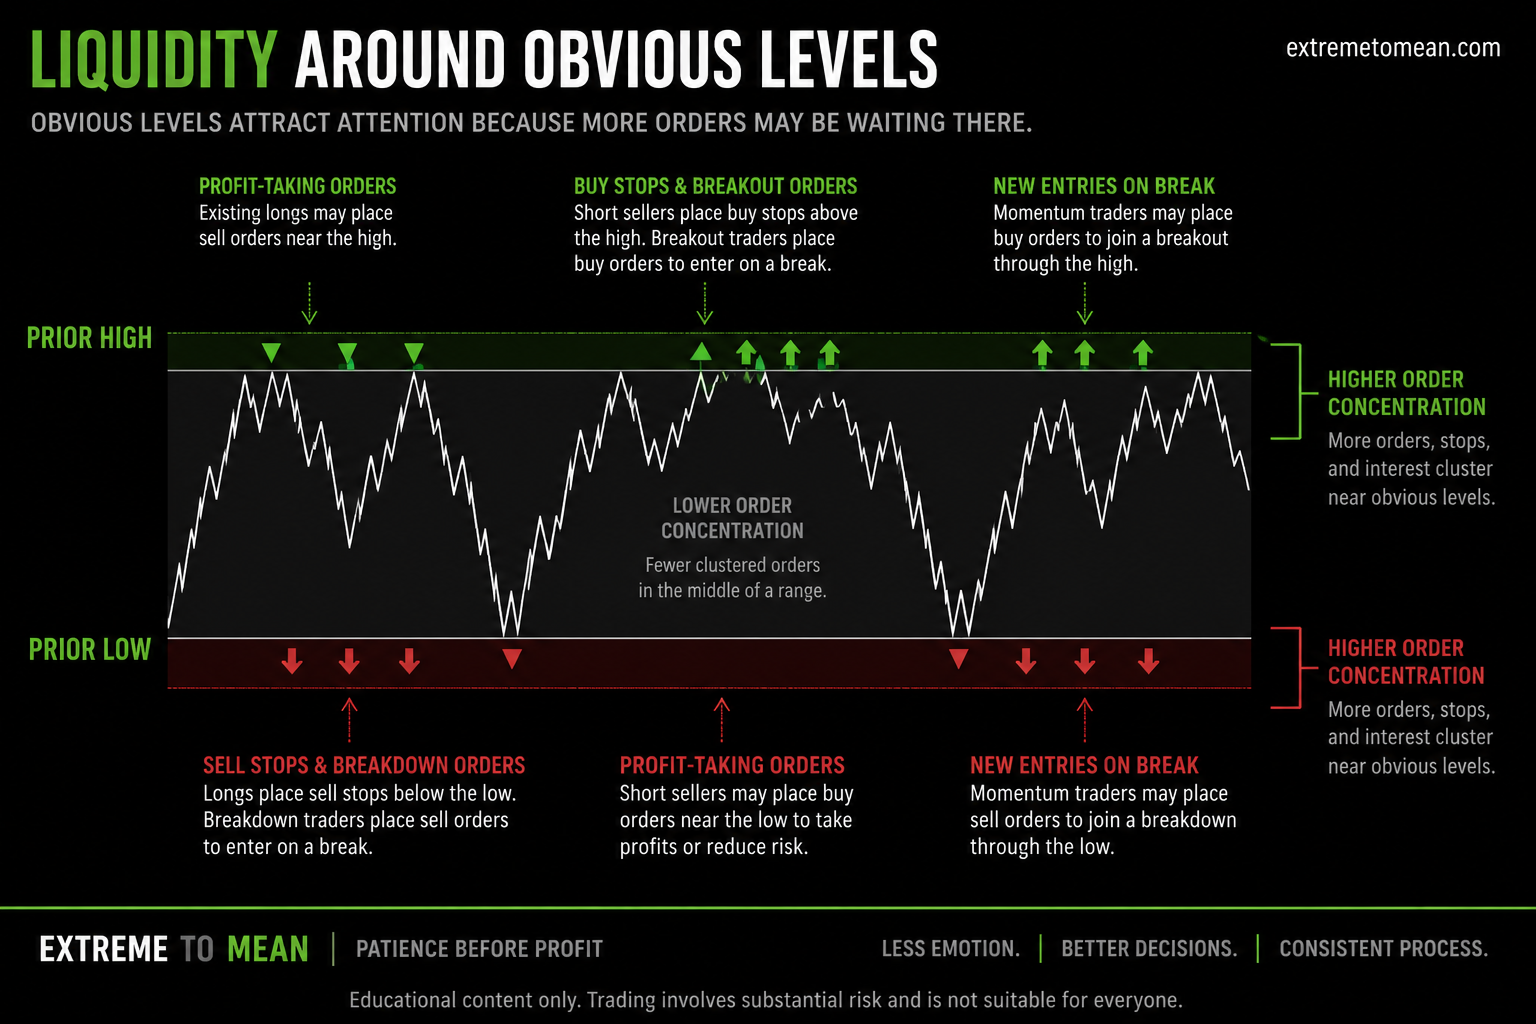
Certain chart levels naturally attract attention because many participants can see them. Prior session highs and lows, range boundaries, recent swing points, round numbers, opening-range levels, overnight extremes, and well-defined support or resistance areas can all become widely watched references.
Traders may place entries, exits, stop losses, and profit targets around the same locations. The reason for each order may differ, but the result is a potential concentration of activity.
Imagine price approaching a clearly visible prior high. Short sellers may have protective buy stops above it, breakout traders may be waiting to enter long, existing longs may be preparing to take profits, and other participants may be waiting to see whether price holds above the level or rejects it.
That one area can contain several forms of buying and selling interest at the same time. As those orders begin to activate, price may accelerate because the market has reached a location where more business can be conducted.
This does not mean price is magnetically pulled toward every obvious level. It means those areas often contain more potential participation than the relatively empty space between them. The level creates a reason for activity to increase if price arrives, but it does not dictate the outcome.
A better way to think about liquidity is not that price must reach a certain level. It is that the level may become important because many participants are likely to make decisions there.
False Breaks and Stop Runs
One of the most common ways traders encounter liquidity is through a false break. Price moves above resistance or below support, appears to confirm a breakout, and then quickly returns inside the previous range. Traders who entered late may become trapped, while protective stops beyond the level have already been triggered.
This movement is often described as a liquidity sweep or stop run. Those terms can make the event sound like a coordinated attack designed specifically to take money from individual traders. Large participants may sometimes seek areas containing enough opposing orders to complete substantial transactions, but traders should be cautious about treating every false break as proof of manipulation.
The market does not need a conspiracy to produce a stop run. When many traders independently identify the same obvious level, they often place similar orders around it. That concentration can naturally create a burst of activity when price arrives.
Once those orders have been triggered and filled, the market still needs continued demand or supply to keep moving. If new participation fails to appear, price may reverse. If participation continues, the breakout may hold and expand.
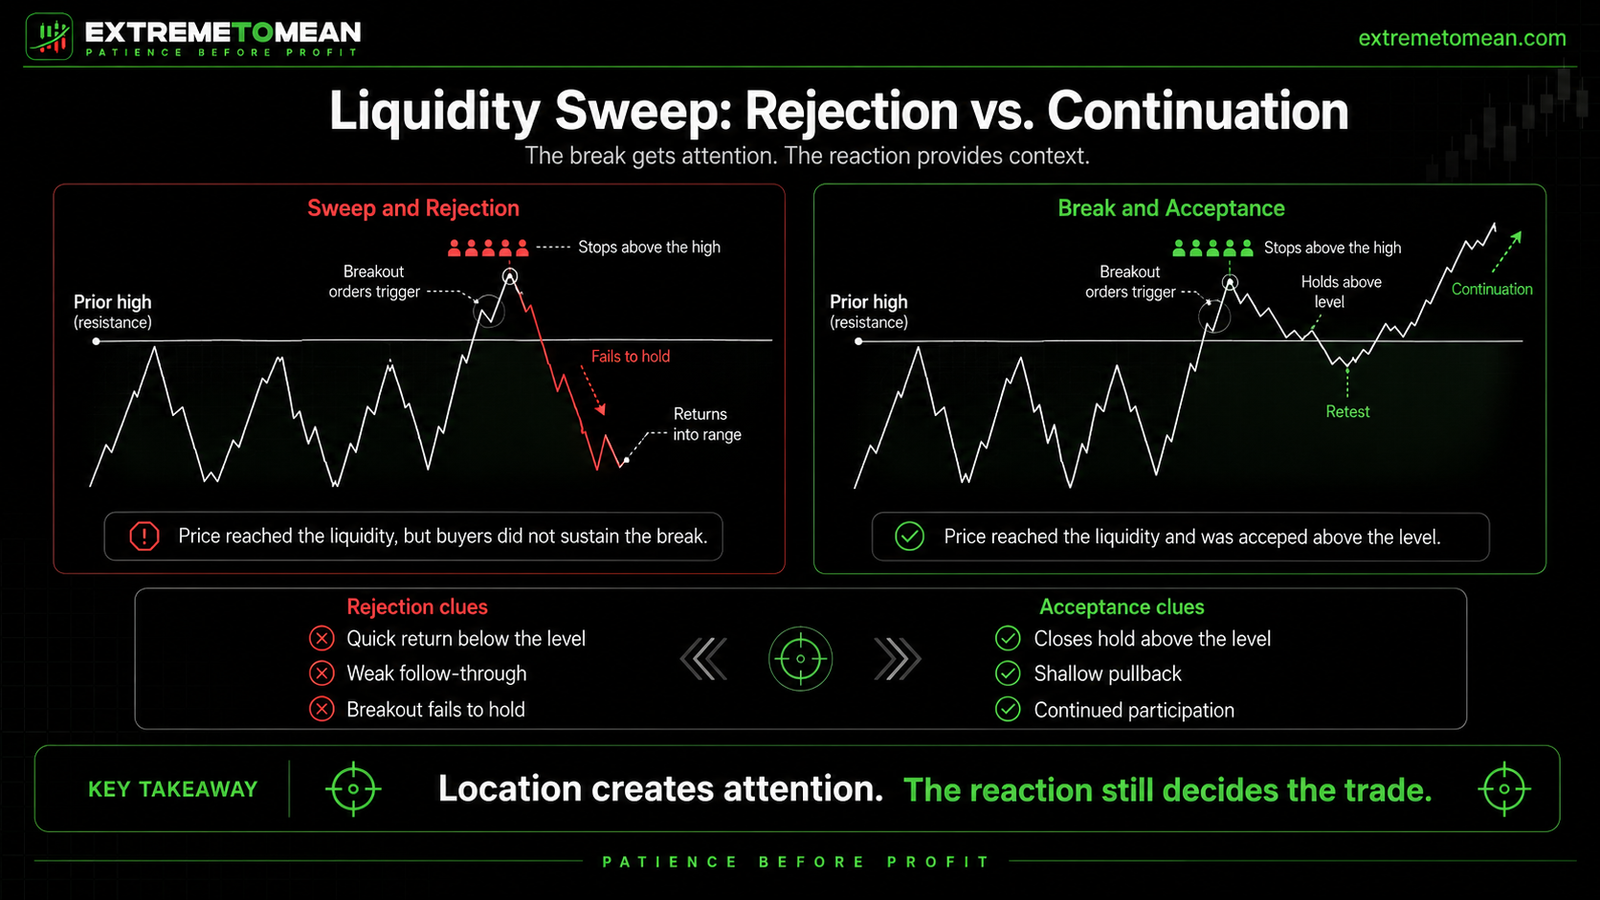
A break above a prior high can therefore produce two very different outcomes. In a sweep and rejection, price moves through the level, activates the available orders, fails to attract continued buying, and returns below the old high. In a break and acceptance, price moves through the same area, remains above it, and continues building because buyers support the higher prices.
The initial break can look nearly identical in both cases. The important difference is what happens after the liquidity is reached.
This is why context comes before the candle. One strong candle through a level does not tell the complete story. The trader still needs to evaluate structure, follow-through, market condition, and whether price is being accepted or rejected beyond the boundary.
A Liquidity Sweep Is Not Automatically a Reversal
Once traders learn about liquidity sweeps, they often begin treating every move beyond a prior high or low as a reversal setup. That is simply a new version of reacting to a signal without evaluating the environment around it.
A market can sweep a level and continue because the broader trend remains strong. It may pause briefly, form a rejection-looking candle, and then expand farther as new participants enter and existing positions are forced to adjust.
This is especially important during strong trends, volatility expansion, major news events that change market behavior, thin trading periods, or broad market momentum. In those environments, the orders beyond an obvious level may help fuel continuation rather than produce a reversal.
The reversal assumption feels reasonable because price reaches an extreme, triggers stops, and pauses. That sequence can look like exhaustion. A pause, however, is not the same as a confirmed change in market behavior.
A liquidity event earns attention. It does not automatically earn risk.
The trader still needs to evaluate whether price is rejecting the new area or accepting it. Rejection may appear through a failure to hold beyond the level, a decisive move back into the prior structure, weakening directional pressure, or a short-term structural change.
Acceptance may appear through repeated closes beyond the level, shallow pullbacks, continued participation, and the former boundary beginning to act as support or resistance from the opposite side. The reaction provides more useful information than the initial touch or break.
This is another reason location is the first filter, not the final decision. A meaningful level tells the trader where to pay attention, but it cannot decide the trade by itself.
Liquidity Explains Movement, Not Certainty
Liquidity can help explain why price accelerated, why a particular level was tested, or why a breakout failed. It cannot reliably tell the trader exactly what price will do next.
That distinction protects traders from several common mistakes. One is assuming that price must travel toward the nearest visible liquidity area. A prior high or low may be important, but the market can reverse before reaching it, remain balanced, or respond to another area carrying greater significance.
Another mistake is assuming that all liquidity levels matter equally. A minor intraday swing may attract some orders, while a major higher-timeframe high may draw substantially more participation. The timeframe, market condition, clarity of the level, and surrounding structure all affect its importance.
A third mistake is using liquidity language to justify a trade after the decision has already been made. A trader who wants to buy can always point to liquidity above, while a trader who wants to sell can always point to liquidity below. When the concept can support either direction without a defined process, it is no longer improving the decision.
Liquidity should narrow the trader’s attention rather than replace judgment. It can identify where activity may increase and where a response deserves observation, but it does not remove the need to evaluate structure, risk, and execution.
A Better Liquidity Decision Filter
Before acting around an obvious level, the trader should slow the process down and evaluate both the location and the reaction. A useful liquidity filter includes:
- Why is this level likely to matter? Determine whether it is a major prior high, session extreme, range boundary, higher-timeframe reference, or merely a small visible swing.
- What market condition surrounds the level? A sweep against a powerful trend should not be evaluated the same way as a sweep at the edge of a balanced range.
- Did price simply cross the level, or did behavior actually change? A wick alone is not enough; look for acceptance, rejection, follow-through, and structural response.
- Is there still a usable trade after the reaction? Price may have already moved too far from the level, leaving poor location, unclear invalidation, or limited room for a target.
- Where is the idea wrong? The level should help define what market behavior would invalidate the trade rather than merely provide a story for entering.
- Am I evaluating the reaction or predicting it? The trader should observe what price does around the liquidity rather than assume the level must create the desired outcome.
The clearer and more widely observed the level is, the more likely it may be to attract participation. That still does not guarantee a reversal, breakout, or clean trade. The market condition and response determine whether the observation develops into a usable decision.
The most important question may be:
Am I waiting to see how price behaves around liquidity, or am I assuming the level must produce the outcome I want?
The cleaner decision comes from observing the test, evaluating the response, and accepting that standing aside remains valid when the evidence is unclear.
Final Thought
Liquidity matters because markets need participation to move. Obvious highs, lows, range boundaries, session extremes, and other widely watched levels often contain concentrated orders that can produce acceleration, false breaks, stop runs, continuation, or reversal.
The level itself is not the trade. It identifies a location where activity may increase and where the market’s response may become more informative.
The trader’s job is to understand why some obvious support and resistance areas attract more orders, wait for price to reach the area, and evaluate what happens after the liquidity is engaged. Better decisions come from reading acceptance, rejection, structure, and risk—not from assuming every sweep must reverse or every breakout must continue.
Traders building this kind of process can use the free trading tools and checklists to create a more deliberate pause between seeing movement and placing risk.
Educational content only. Trading involves substantial risk and is not suitable for everyone.