
A trader who already knows ES as S&P 500 futures and NQ as Nasdaq-100 futures may first see YM and assume it is simply another ticker for the same broad stock-market movement. All three contracts often respond to the same macro forces, but the indexes underneath them contain different companies, use different weighting systems and convert index movement into different dollar amounts. The better question is not “Which one moves more?” but “What benchmark am I actually trading, and what is each point worth in that contract?”
This belongs in the broader ETM lessons under The Basics → Futures Contracts & Mechanics because the distinction begins with instrument structure rather than strategy. Before assigning any market a personality, the trader needs to understand what the ticker measures and how the contract translates that movement into P&L.
What Are YM and MYM Futures?
YM is the E-mini Dow Jones Industrial Average futures contract. It tracks the Dow Jones Industrial Average, or DJIA, and uses a $5 multiplier, which means one full Dow point is worth $5 per YM contract. Its minimum outright price movement is one index point, so for YM one tick is also one point and is worth $5.
MYM is the Micro E-mini version of the same Dow exposure. Its multiplier is $0.50 × the DJIA, so every Dow point is worth $0.50 per MYM contract. YM and MYM therefore follow the same underlying index and make the same index-point move; the difference is the amount of dollar exposure attached to each point.
That distinction is important because MICRO CONTRACT ≠ SMALLER MARKET MOVE. If the Dow falls 300 points, both YM and MYM move those same 300 index points. One YM would change by $1,500, while one MYM would change by $150; the Micro changes the multiplier, not what the Dow itself does.
YM vs. MYM: Same Dow, One-Tenth the Contract Size
The basic relationship is straightforward:
| Contract | Underlying | Multiplier | Minimum Tick | Tick / Point Value |
|---|---|---|---|---|
| YM | Dow Jones Industrial Average | $5 × index | 1.00 point | $5.00 |
| MYM | Dow Jones Industrial Average | $0.50 × index | 1.00 point | $0.50 |
Because MYM's multiplier is one-tenth of YM's, ten MYM contracts represent approximately the same index exposure as one YM contract. That is a mechanical equivalence, not a position-sizing recommendation. The smaller contract gives the trader finer control over dollar exposure, but it does not make the underlying market quieter, safer or easier.
YM, ES and NQ Contract Specs Side by Side
The differences become clearer when the major E-mini and Micro contracts are placed together:
| Contract | Index | Multiplier | Tick Size | Tick Value | Full Point Value |
|---|---|---|---|---|---|
| YM | Dow Jones Industrial Average | $5 | 1.00 | $5.00 | $5 |
| MYM | Dow Jones Industrial Average | $0.50 | 1.00 | $0.50 | $0.50 |
| ES | S&P 500 | $50 | 0.25 | $12.50 | $50 |
| MES | S&P 500 | $5 | 0.25 | $1.25 | $5 |
| NQ | Nasdaq-100 | $20 | 0.25 | $5.00 | $20 |
| MNQ | Nasdaq-100 | $2 | 0.25 | $0.50 | $2 |
One subtle example is MYM versus MNQ. Both have a $0.50 minimum tick value, but MYM moves in one-point increments while MNQ moves in quarter-point increments. That means one full MYM point is worth $0.50, while one full MNQ point is worth $2. TICK VALUE ≠ POINT VALUE.
A Futures Point Is Not a Dollar
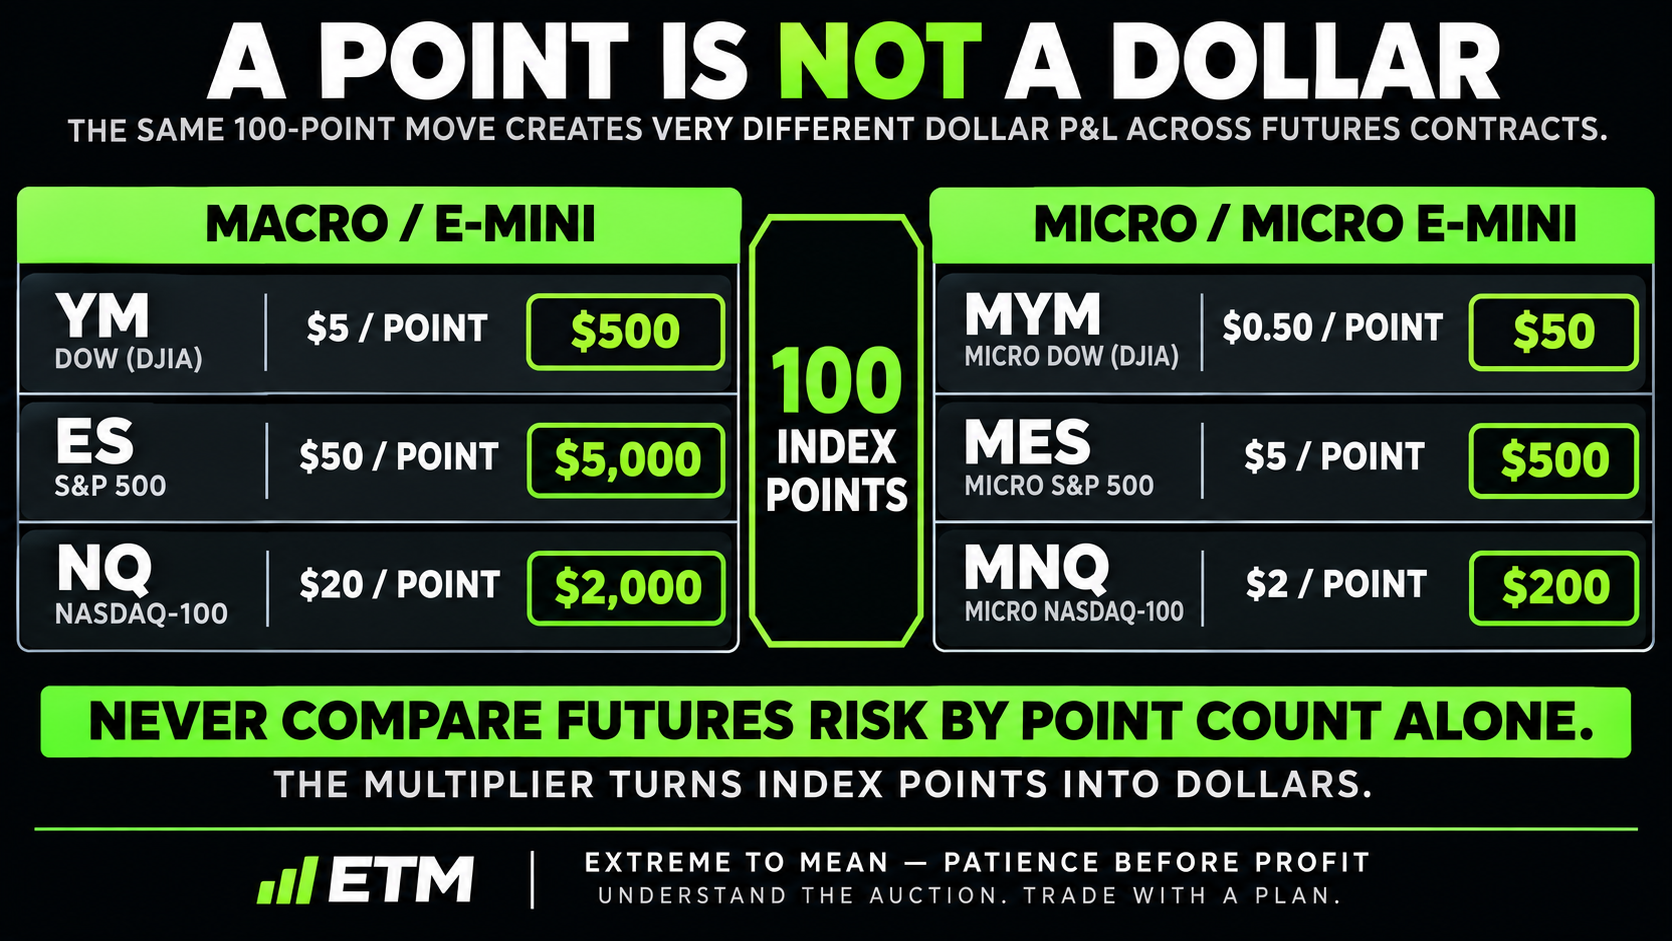
A point is simply an index unit. The contract multiplier is what turns that index movement into dollars, so saying that a market “moved 100 points” tells you very little about contract P&L until you identify which futures contract is being discussed.
For a 100-point move, one YM changes by $500 and one MYM by $50. One NQ changes by $2,000 and one MNQ by $200, while one ES changes by $5,000 and one MES by $500. The exact same number of index points therefore produces very different dollar changes across the contracts.
Raw points are also poor tools for comparing volatility across different indexes. A 300-point Dow move cannot simply be ranked against a 150-point Nasdaq move and called “twice as large,” because the two indexes start from different numerical levels and are constructed differently. Percentage movement, normalized range or realized volatility gives a more meaningful cross-index comparison, while the contract multiplier determines the futures P&L.
What YM Actually Tracks: The 30-Stock Dow
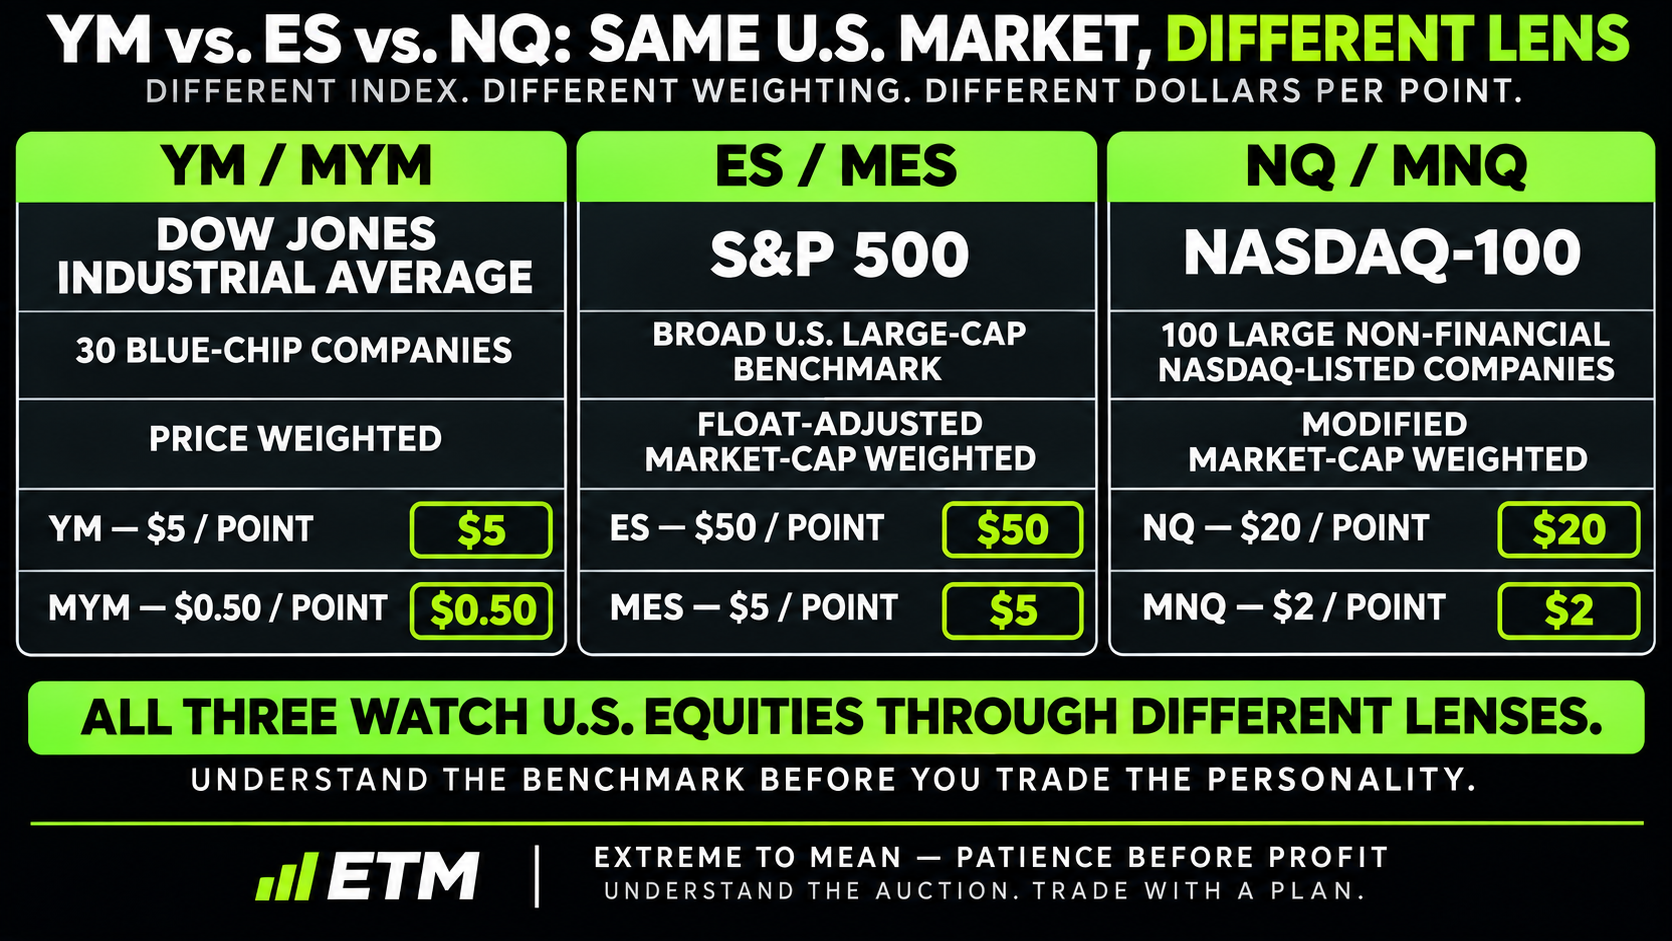
YM and MYM track the Dow Jones Industrial Average, a price-weighted index of 30 major U.S. blue-chip companies. The word “Industrial” is historical; the modern Dow spans multiple sectors and is not simply a basket of manufacturing or industrial companies. DOW ≠ S&P 500 ≠ NASDAQ-100 begins with the fact that the baskets themselves are different.
The Dow's most distinctive construction feature is price weighting. A higher-priced Dow stock generally receives more index weight than a lower-priced stock, regardless of whether the higher-priced company is larger by total market capitalization. In plain English, stock price helps determine influence in the Dow.
Imagine one Dow constituent trades at $400 per share and another at $100. Ignoring the index-divisor mechanics for the illustration, the $400 stock contributes roughly four times the price weight. That does not mean the company is four times larger; price weighting measures share-price influence, not corporate size directly.
ES and NQ See the U.S. Market Differently
ES tracks the S&P 500, which is constructed very differently. The S&P 500 represents the large-cap U.S. equity market and uses float-adjusted market-cap weighting, so companies with larger publicly tradable market values generally exert more influence. It is also a much broader corporate basket than the 30-stock Dow.
NQ tracks the Nasdaq-100, not the Nasdaq Composite and not every stock listed on Nasdaq. The Nasdaq-100 contains 100 of the largest non-financial companies listed on the Nasdaq Stock Market and uses a modified market-capitalization weighting system. It often carries substantial technology and growth-company exposure, but calling it a technology-only index is inaccurate because other eligible industries are represented as well.
Those construction differences matter because the same company or economic theme can affect each benchmark differently. The Dow is price weighted, the S&P 500 is float-adjusted market-cap weighted, and the Nasdaq-100 uses modified market-cap weighting. Understanding why the market itself comes first begins with knowing which market your instrument actually represents.
Why YM, ES and NQ Can Diverge
Because the three indexes contain different baskets and weight those baskets differently, they can agree on direction while disagreeing substantially on strength. A strong rally among large Nasdaq-listed growth companies may push NQ higher more aggressively while ES rises more modestly and YM lags. That does not automatically mean one market is wrong.
Likewise, a major move in a high-priced Dow constituent can influence the DJIA differently from the way that same company's movement affects the S&P 500. Relative movement can reveal differences in leadership or participation, but INDEX DIVERGENCE ≠ AUTOMATIC TRADE SIGNAL. The cleaner principle is to explain the relationship without converting it into an entry system.
This is also why labels such as “YM is slow,” “NQ is wild” or “ES is smooth” are weak starting points. Those descriptions may appear true during particular regimes, but market conditions change the quality of a setup, and volatility is not a permanent personality printed into a ticker. Measure what the contract is doing in the session you actually trade.
MYM, MES and MNQ: Smaller Contracts, Not Smaller Markets
The Micro contracts give traders smaller dollar multipliers while preserving exposure to the same underlying indexes. MYM is one-tenth YM, MES is one-tenth ES and MNQ is one-tenth NQ. Micro means smaller contract—not smaller market movement.
The separate Micro order books also matter. MYM may mirror the same Dow index exposure as YM, but MYM has its own trading volume, depth and bid/ask conditions, just as MES and MNQ have their own execution environments. Liquidity should therefore be checked in the specific contract and session rather than inferred from the reputation of the larger E-mini.
Notional value provides another useful comparison. Futures notional exposure is approximately futures price × contract multiplier, so if Dow futures were hypothetically at 52,000, one YM would represent about $260,000 of index exposure while one MYM would represent about $26,000. Margin is not the same thing as notional exposure; the contract is leveraged index exposure rather than a cash purchase of all the stocks inside the benchmark.
The Contract Comparison Checklist
Before comparing YM/MYM with ES/NQ, ask:
- What index does the contract actually track?
- How is that index weighted?
- Which companies are included in the benchmark?
- What is the contract multiplier?
- What is the minimum tick?
- What is one full point worth?
- Am I trading the E-mini or the Micro version?
- What is the approximate notional exposure?
- What do liquidity and spreads look like during my intended session?
- Does my strategy have evidence on this index, or am I assuming behavior transfers from another benchmark?
That last question matters because visual similarity does not establish strategy transferability. A setup developed on ES should not automatically be assumed to behave identically on YM simply because both respond to U.S. equity conditions. Context comes before the candle, and the index itself is part of that context.
The ETM Index → Weighting → Contract → Dollars → Behavior Framework
Use INDEX → WEIGHTING → CONTRACT → DOLLARS → BEHAVIOR. INDEX identifies the basket you are trading; WEIGHTING determines what makes one constituent more influential; CONTRACT identifies YM, MYM, ES, MES, NQ or MNQ. DOLLARS translates ticks and points into actual position exposure, and BEHAVIOR asks how that specific benchmark performs under the conditions your process studies.
Only after those mechanics are clear should the trader move to COMPARE → TEST → CHOOSE. The ETM free tools can support structured research, but the contract choice should come from the exposure and evidence being studied rather than from a trading-room reputation. Understand the benchmark before trying to trade its personality.
Final Thought
YM and MYM are futures on the Dow Jones Industrial Average, a 30-stock price-weighted benchmark that views the U.S. equity market differently from the broader S&P 500 and the Nasdaq-100. YM makes each Dow point worth $5 per contract, while MYM reduces that to $0.50; ES, MES, NQ and MNQ use their own multipliers and tick structures.
That is why point counts cannot be compared as though all indexes share one ruler. A 100-point move means different dollar P&L in YM, ES and NQ, and it may represent very different percentage movement in the underlying indexes. The benchmarks also contain different companies and weight them differently, so leadership and divergence are normal possibilities rather than proof that one contract must catch up to another.
The practical lesson is not that YM is better or worse than ES or NQ. The ticker tells you which market exposure you have chosen. Understand the index, understand the weighting, understand the multiplier, and translate every point into dollars before assigning a personality to the chart.
Educational content only. Trading involves substantial risk and is not suitable for everyone.