
Why Raw Distance Can Be Misleading
Traders naturally think in points, ticks, and percentages because those measurements are easy to see. In the Setup curriculum, measurement becomes useful only when it belongs to a defined decision, and raw distance changes meaning as market conditions change the quality of a setup. Twenty points is not inherently small or large until we compare it with the behavior of the series and horizon we are studying.
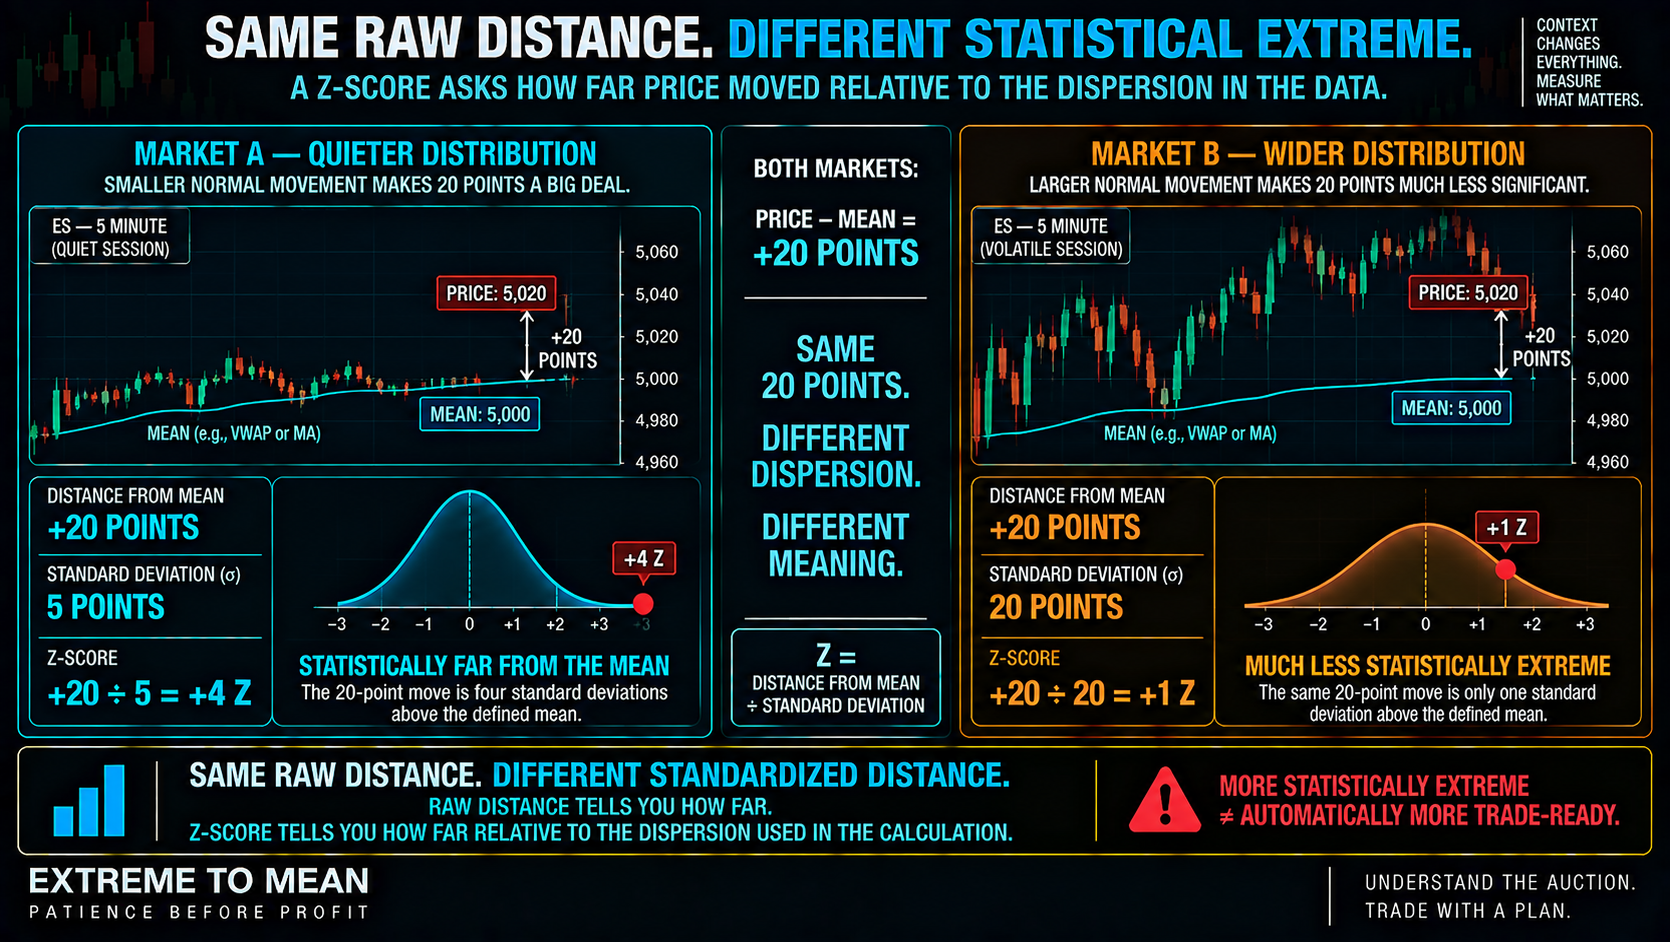
Standardization gives that distance context. Instead of saying, “Price is 20 points from the mean,” we ask how large those 20 points are relative to the dispersion used in the calculation. A z-score turns far from a visual judgment into a measurable relationship.
What a Z-Score Actually Measures
The basic formula is:
z = (x − μ) / σ
where x is the current observation, μ is the mean, and σ is the standard deviation. In plain English, subtract the average from the current value, then divide that distance by the statistical dispersion used in the model. The result tells us how many standard deviations the observation sits above or below that defined mean.
Suppose the current value is 110, the mean is 100, and standard deviation is 5. The z-score is +2; if the current value were 90 with the same mean and dispersion, the z-score would be −2. The sign tells you which side of the mean you are on; it does not tell you which side of the trade you should take.
Now imagine two markets that are both 20 points above their means. If Market A has a standard deviation of 5 points, the distance equals +4 z; if Market B has a standard deviation of 20 points, the same raw distance equals +1 z. Same raw distance, very different standardized distance.
Statistically Extreme Does Not Mean Trade-Ready
Suppose the calculation shows z = +2.5. We can honestly say the chosen observation is 2.5 standard deviations above its defined mean under that calculation, but we cannot conclude that price is about to fall. A z-score measures extremity; it does not measure readiness.
Momentum can remain strong, the market can be accepting higher prices, and new information can change expectations while the z-score remains extreme. That is why not every extreme is a trade, even when the extreme is measured with impressive-looking decimals. Precision in the measurement does not guarantee accuracy in the conclusion.
The familiar “two standard deviations” rule creates another trap. Under a theoretical normal distribution, roughly 95% of observations fall within about two standard deviations of the mean, but that is not a 95% probability of reversal. Financial markets can trend, change volatility, display fat tails, and move from +2 to +3 or +4 before meaningful reversion begins.
The Mean, Window, and Input Matter
Before asking what the z-score is, ask what was standardized against what. A rolling price mean, distance from VWAP, a return series, and a spread between two assets can all produce z-scores, but they measure different variables. “The z-score is +2” is incomplete without the model definition.
The lookback matters too. Shorter windows generally adapt faster while longer windows incorporate more history and change more slowly, so changing the window can materially change what counts as extreme. This is also why what the mean really is matters: there is no single universal market mean that every strategy must use.
The Z-Score Can Change Even When Price Does Not
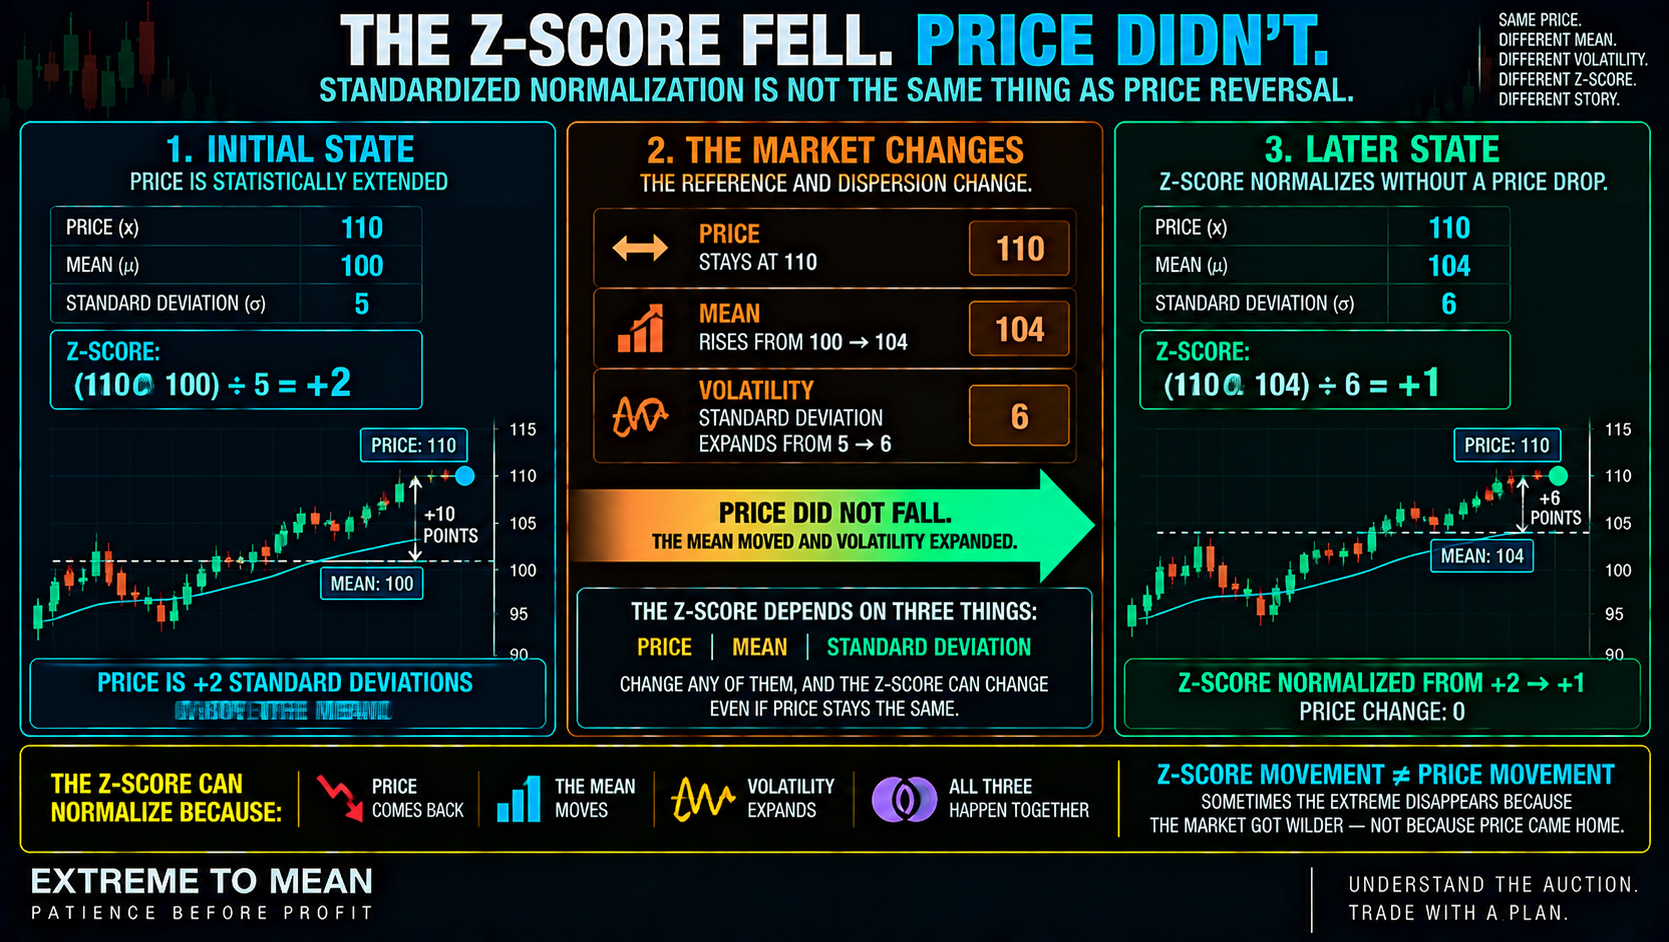
A rolling z-score normally has two moving components in addition to price: the mean and the standard deviation. Suppose price remains at 110, but the mean rises from 100 to 104 while standard deviation rises from 5 to 6; the z-score falls from +2 to +1 even though price never moved lower. The reading normalized because the reference moved and the dispersion widened.
The reverse can happen when volatility contracts. If price remains five points above the mean while standard deviation shrinks from five points to two, the z-score rises from +1 to +2.5 without a new surge in price. Z-score movement is not the same thing as price movement.
A Z-Score Does Not Create Mean Reversion
A rolling average always creates a center because that is what the calculation does. Measuring price above and below that center does not prove the underlying price series has a stable statistical mean or a durable tendency to return to it. Every moving average creates a mean; not every market series creates a tradable mean-reversion process.
Outright asset prices can trend, reprice, and change their statistical behavior. A rolling z-score can still describe local extension, but standardizing a series does not give it a reason to revert. Statistical-arbitrage research can instead study spreads or residuals whose relationships have evidence of greater stability; cointegration, spread construction, and half-life belong to the next lesson.
Regime Changes Can Make the Old Distribution Stale
Standardization helps compare environments, but it does not magically solve regime change. A rolling z-score adapts to the data inside its window, so its mean and standard deviation can lag when behavior shifts suddenly. The z-score knows the volatility in its window; it does not know the volatility coming next.
A surprise CPI print, FOMC decision, earnings shock, or other genuine repricing can therefore produce an enormous z-score relative to a distribution that mostly describes the old market. Trend creates a similar problem because a persistent directional move can produce repeated extreme readings while momentum remains intact. The statistic knows the data you gave it; it does not know the market context you forgot to include.
A Threshold Is Not a Strategy
Rules such as “buy below −2” or “short above +2” define a threshold, not a complete trading process. They say nothing about regime, entry timing, invalidation, target, holding period, transaction costs, execution, or financial risk. A z-score threshold can define an extreme; it cannot define the entire trade.
There is no universal best threshold, and a larger absolute reading can occur during stronger trend, expanding volatility, or a regime transition. Even z = 0 is not automatically the perfect target because the mean may keep moving and the trade may have different structural constraints. More statistically extreme does not automatically mean more statistically attractive, and the measurement must remain separate from the trade plan.
Z-Scores Become Most Useful in Research
The strongest use of a z-score is as a cleaner variable for a testable question. Instead of saying, “I think price is far from its mean,” the trader can ask what historically happened after a precisely defined variable reached a chosen standardized distance under specified conditions. That is where the measurement starts connecting to what an edge actually is.
A useful test can examine subsequent return, maximum adverse excursion, time to normalization, costs, and behavior across regimes. It should compare nearby thresholds rather than worship one historically perfect number, because an isolated sweet spot can be an overfit accident. Z-scores do not give you an edge; they give you a cleaner variable with which to ask whether an edge exists.
The test also needs a definition of reverted and a deadline. A condition that returns toward zero only after moving from +2 to +4 may look statistically successful while a realistic trade fails first. Eventual normalization does not prove a tradable path existed.
The ETM Z-Score Framework
Use the z-score to improve the measurement of an extreme, not to skip the rest of the process. The objective is to define the variable precisely, understand the assumptions inside the number, and test whether behavior around that measurement produces anything useful after costs and context.
- Variable — What exactly are you standardizing: price, return, distance from VWAP, a spread, or another quantity?
- Mean — What average or equilibrium reference is being used?
- Window — What data produces the mean and standard deviation?
- Z-score — Calculate standardized distance: z=(x−μ)/σ.
- Interpretation — Which side of the mean is the observation on, and how large is the standardized distance?
- Regime — Is the market trending, balanced, expanding in volatility, or repricing after new information?
- Reversion logic — Why should this particular variable have a reason to return toward its mean?
- Response — Is directional progress continuing, weakening, rejecting, or consolidating?
- Trade definition — What are the entry, invalidation, target, holding horizon, and risk rules?
- Test — What happened historically after the condition, including MAE, MFE, time, and costs?
- Challenge — Does the relationship survive other periods, regimes, nearby parameters, and unseen data?
- Decision — Use it as context, continue researching, revise the hypothesis, or reject it.
The condensed framework is Variable → Mean → Dispersion → Z-Score → Context → Reversion Evidence → Test → Decision. The better question is not, “Is +2 enough to trade?” Ask, “What exactly did I standardize, how unusual is it under this model, why should it revert, and does the evidence support a tradable path?”
Final Thought
A z-score is useful because it gives traders a common language for relative extremity. It asks how large the deviation is relative to the dispersion in the data being measured rather than treating raw points as universally comparable. That is a major improvement over raw-distance thinking.
But the statistic has boundaries. A high z-score can become higher, a low z-score can persist, the mean can move, volatility can expand, and new information can reprice the market. A nonstationary price series does not become mean-reverting simply because someone calculated a z-score around it.
Use z-scores to measure the extreme, research to determine whether the relationship actually reverts, and market context to decide what is happening now. Statistically extreme does not mean trade-ready, and a better measurement is still only one input into the broader Extreme to Mean system.
Educational content only. Trading involves substantial risk and is not suitable for everyone.