
Why the Same Price Stall Can Mean Two Different Things
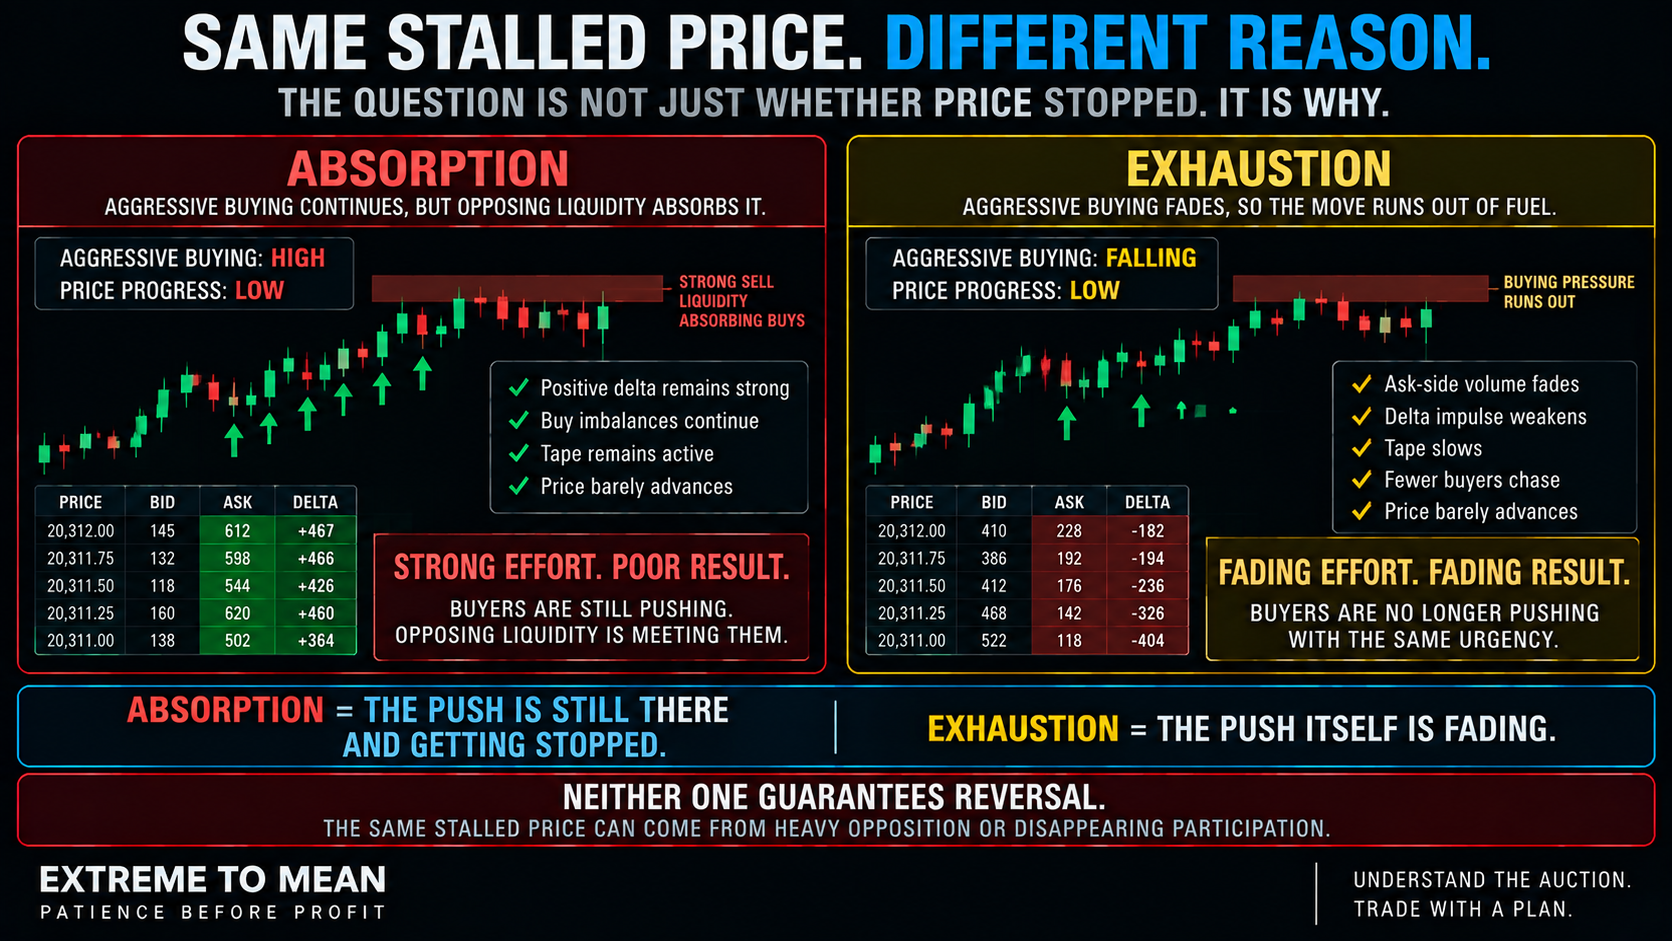
Imagine NQ rallies into a prior high and struggles to advance. Aggressive buyers keep lifting offers, positive delta stays strong, and buy imbalances continue to appear, yet each wave produces little additional upside. The buying is still there, but opposing liquidity is meeting it.
Now imagine a second NQ rally that looks similar on a normal chart. This time ask-side aggression fades, delta becomes less forceful, the tape slows, and fewer buyers continue chasing higher prices. Price is stalling for a different reason: the push itself is disappearing.
A candlestick may make both situations look like “momentum slowed.” Order flow asks a more useful question: did aggression remain strong and fail, or did the aggression itself fade? That distinction belongs in the broader Market curriculum because it explains changing auction behavior without pretending to predict the next move.
Quick Refresher: Aggressive and Passive Trading
Aggressive buyers cross the spread and execute against resting offers, while aggressive sellers cross the spread and execute against resting bids. Resting limit orders provide liquidity; marketable orders consume it. Every completed trade still has both a buyer and a seller, so the distinction is about which side demanded immediate execution.
That interaction is enough for this lesson. Heavy aggression can meet opposing liquidity without revealing who is on the other side or what they intend next. The broader auction-and-liquidity framework explains why identical aggression can produce different movement.
What Is Absorption?
Absorption occurs when aggressive trading continues, but enough opposing passive liquidity keeps accepting that activity without allowing comparable price progress. Buyers may repeatedly lift offers and positive delta may remain strong while price barely advances; aggressive sellers can meet the same problem near a low. The plain-English version is simple: the push is still there, but it is getting stopped.
Absorption does not identify the participant doing the absorbing. It also does not tell us how much liquidity remains or whether that side will eventually win. It describes the interaction between aggressive execution and unexpectedly weak price progress.
What Is Exhaustion?
Exhaustion describes a different problem: the aggressive side that powered the move begins participating less. In a rally, ask-side volume may decline, positive delta may weaken, the tape may slow, and fewer buyers may keep paying higher prices. Price progress fades because the directional fuel itself is fading.
No enormous seller has to be standing at the high for exhaustion to exist. The market may simply have fewer aggressive buyers willing to continue the move at that moment. Absorption means the push is still there and getting stopped; exhaustion means the push itself is fading.
Absorption vs. Exhaustion: The Simple Difference
Both behaviors can leave us staring at a stalled market, but the effort underneath that stall is different. Absorption is strong effort + weak result, while exhaustion is weakening effort + weak result. That gives us a simple reference before we add more detail.
| Behavior | Aggressive Flow | Price Progress | Better Question |
|---|---|---|---|
| Possible absorption | Still strong | Weak or stalled | Why is all this aggression accomplishing so little? |
| Possible exhaustion | Weakening | Weak or stalled | Is the aggressive side running out of urgency? |
Real markets do not have to fit perfectly into one box. Absorption can transition into exhaustion, and fresh aggression can return after exhaustion. The labels should describe an evolving auction, not force it into a static story.
Effort vs. Result Is the Heart of the Difference
One useful mental model is to compare price progress with the effort being spent to create it. Early in a rally, strong positive delta might produce twenty points of progress; later, similar aggressive buying might produce only three. Something about the market's response to that buying has changed.
Possible absorption may look busy—strong delta, repeated imbalances, active tape, limited price progress—while exhaustion may look quieter as volume and pace fade. Footprints, tape, delta, and CVD can all provide clues, but no universal threshold proves the mechanism. Appearance depends on the contract, session, data, settings, and conditions.
Absorption Does Not Guarantee Reversal
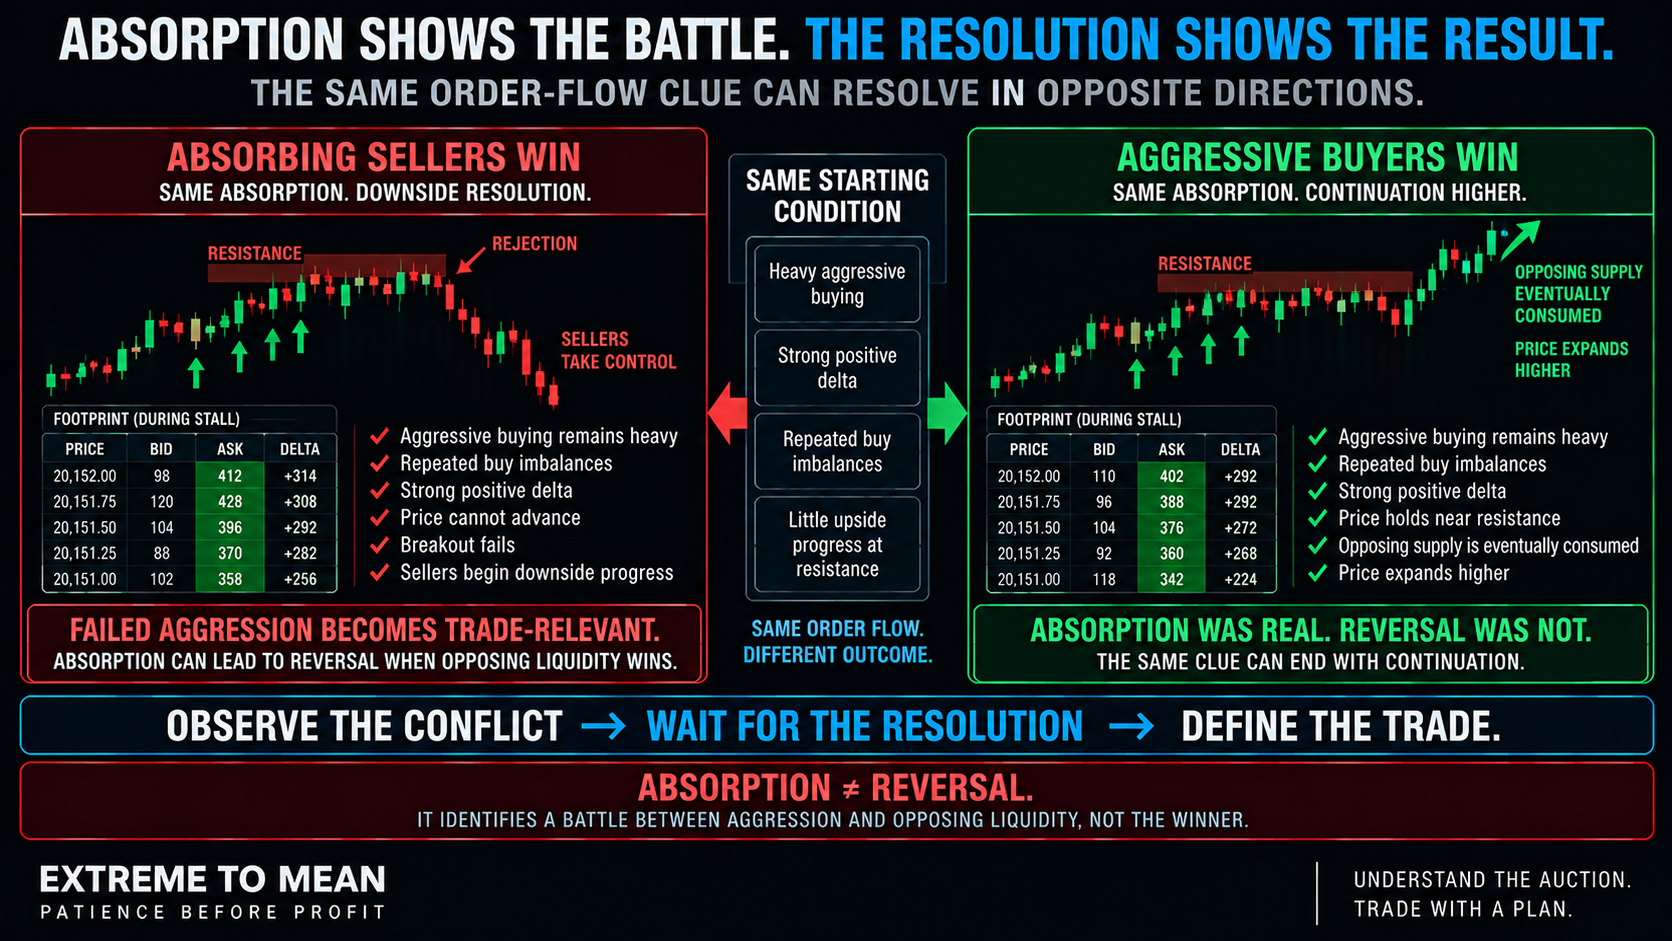
Suppose buyers attack resistance and a large amount of opposing sell liquidity repeatedly meets them. Price pauses, but the buyers continue transacting until that available supply is finally consumed and price accelerates higher. The absorption was real even though the reversal never arrived.
Absorption is therefore better thought of as resistance to aggression rather than victory by the passive side. Opposing liquidity may hold, or it may eventually run out. The next price response decides whether the observation becomes useful for a reversal thesis, continuation thesis, or neither.
Exhaustion Does Not Mean the Trend Is Finished
A directional wave can exhaust without ending the larger trend. Buyers may stop chasing for twenty minutes, price may balance, and new buyers may later enter and resume the move. Local exhaustion is not necessarily trend exhaustion.
The same is true on the downside. Sellers can lose urgency near a low, produce a pause or shallow bounce, and then return later with renewed aggression. Exhaustion describes fading participation in the move being observed, not a guaranteed signal to trade the other way.
Location and Market Condition Change the Meaning
Possible absorption in the middle of a noisy range may simply be normal two-sided trade. The same strong aggression with poor progress near a prior-day high, range edge, failed breakout, or mature extension may deserve more attention. That is why context comes before the candle—and before the order-flow label.
A strong trend raises the evidence bar for a countertrend interpretation. Buyers can encounter absorption and still continue higher, while exhaustion may become only a pause. Market conditions change the quality of a setup, even with more granular data.
Displayed Liquidity Is Not Executed Absorption
A large offer on the DOM is not automatically seller absorption because displayed liquidity can change before meaningful business occurs. Absorption requires actual execution meeting opposing liquidity with surprisingly little price progress. Hidden or replenishing liquidity may contribute, but a footprint alone does not prove an iceberg, participant identity, order size, or motive.
The Resolution Matters More Than the Initial Clue
Consider aggressive buying at resistance with strong positive delta and repeated buy imbalances, yet little upside progress. If price then rejects the area, falls back below the breakout, and aggressive selling begins producing downside progress, the earlier absorption becomes more relevant to a bearish thesis. Failed aggression matters more than aggressive volume by itself.
Now use the same beginning but change the ending. Buyers remain aggressive, price holds near resistance instead of rejecting, and eventually the opposing supply gives way as price expands higher. Absorption showed the battle; the resolution showed the result.
Exhaustion needs the same patience because fading aggression can resolve through reversal, balance, or renewed participation. The first sign of declining effort is incomplete information. Watch whether the opposite side actually begins taking control.
Absorption and Exhaustion Can Become Each Other
Buyers may attack resistance, be absorbed repeatedly, and eventually stop pushing as hard: aggression → absorption → failure → exhaustion. The reverse can happen when exhausted sellers are followed by renewed selling that then meets absorbing buyers. Order flow changes, so our interpretation has to change with it rather than defend the first label we chose.
The ETM Absorption-vs.-Exhaustion Framework
The goal is not to label every pause. It is to diagnose why price progress is changing, then wait to see how the market resolves that change. The process keeps the order-flow observation subordinate to context, qualification, invalidation, and risk.
- Context: Are we in trend, balance, extension, breakout, or failed breakout?
- Location: Why does this area matter before looking at order flow?
- Directional aggression: Which side has been driving the move?
- Current effort: Is that aggression still strong or beginning to fade?
- Price result: How much additional progress is the effort producing?
- Classify the question: Strong effort + poor result suggests possible absorption; weakening effort + poor result suggests possible exhaustion.
- Resolution: Does price reject, balance, or continue through the area?
- Opposing participation: Does the other side actually begin producing price progress?
- Qualification: Does an actual setup now exist?
- Invalidation and risk: Where is the thesis wrong, and can the risk be expressed responsibly?
The condensed sequence is Context → Location → Effort → Result → Absorption/Exhaustion → Resolution → Trade. It puts the order-flow label in the middle rather than at the beginning because the label should help explain the auction rather than create the trade. That is consistent with the ETM principle that the market comes first.
The better question is not, “Is this absorption or exhaustion?” Ask, “Is aggression still strong but failing, or is the aggression itself fading—and what does price do after that?” That keeps the focus on evidence and resolution instead of a top-or-bottom signal.
Final Thought
Absorption and exhaustion can look nearly identical on an ordinary chart because both can slow price progress. Underneath the surface, they describe different auctions: absorption means aggressive traders are still pushing into opposing liquidity, while exhaustion means the aggressive side itself is losing participation. Strong effort with poor result and fading effort with fading result are not the same condition.
Neither condition tells us what price must do next. Absorption can break, exhaustion can become balance, and either can appear inside a trend that later continues. Combine the clue with location, market condition, price response, and resolution.
Separate effort from result, watch how the conflict resolves, and define where the thesis is wrong before risking money. More granular data should improve the question without making the future feel certain. That decision hierarchy is part of the broader Extreme to Mean system.
Educational content only. Trading involves substantial risk and is not suitable for everyone.