
VWAP is a cumulative volume-weighted average price. Anchored VWAP uses the same basic concept but allows the trader to select the point where that cumulative calculation begins, which means a different starting bar creates a different data sample and therefore a different line. Inside The Market, that makes anchor selection part of the analysis rather than a cosmetic chart setting.
The freedom to choose the anchor is AVWAP’s greatest advantage and its greatest danger. A meaningful starting point can isolate the price-volume history following an important event or structural change, while an arbitrary starting point can make almost any chart look convincing. The trader therefore has to decide what question is being studied before allowing the indicator to provide an answer.
What Anchored VWAP Actually Is
Standard VWAP usually begins from a predefined session boundary and accumulates price and volume from there. Anchored VWAP changes only the starting point: the trader chooses a bar or event and the volume-weighted average is calculated forward from that location. TradingView and StockCharts both describe AVWAP around this same basic distinction.
The article does not need much mathematics to make the point. Conceptually, AVWAP is cumulative price multiplied by volume from the anchor, divided by cumulative volume from that anchor forward. What matters most is that different anchor = different data sample = different AVWAP.
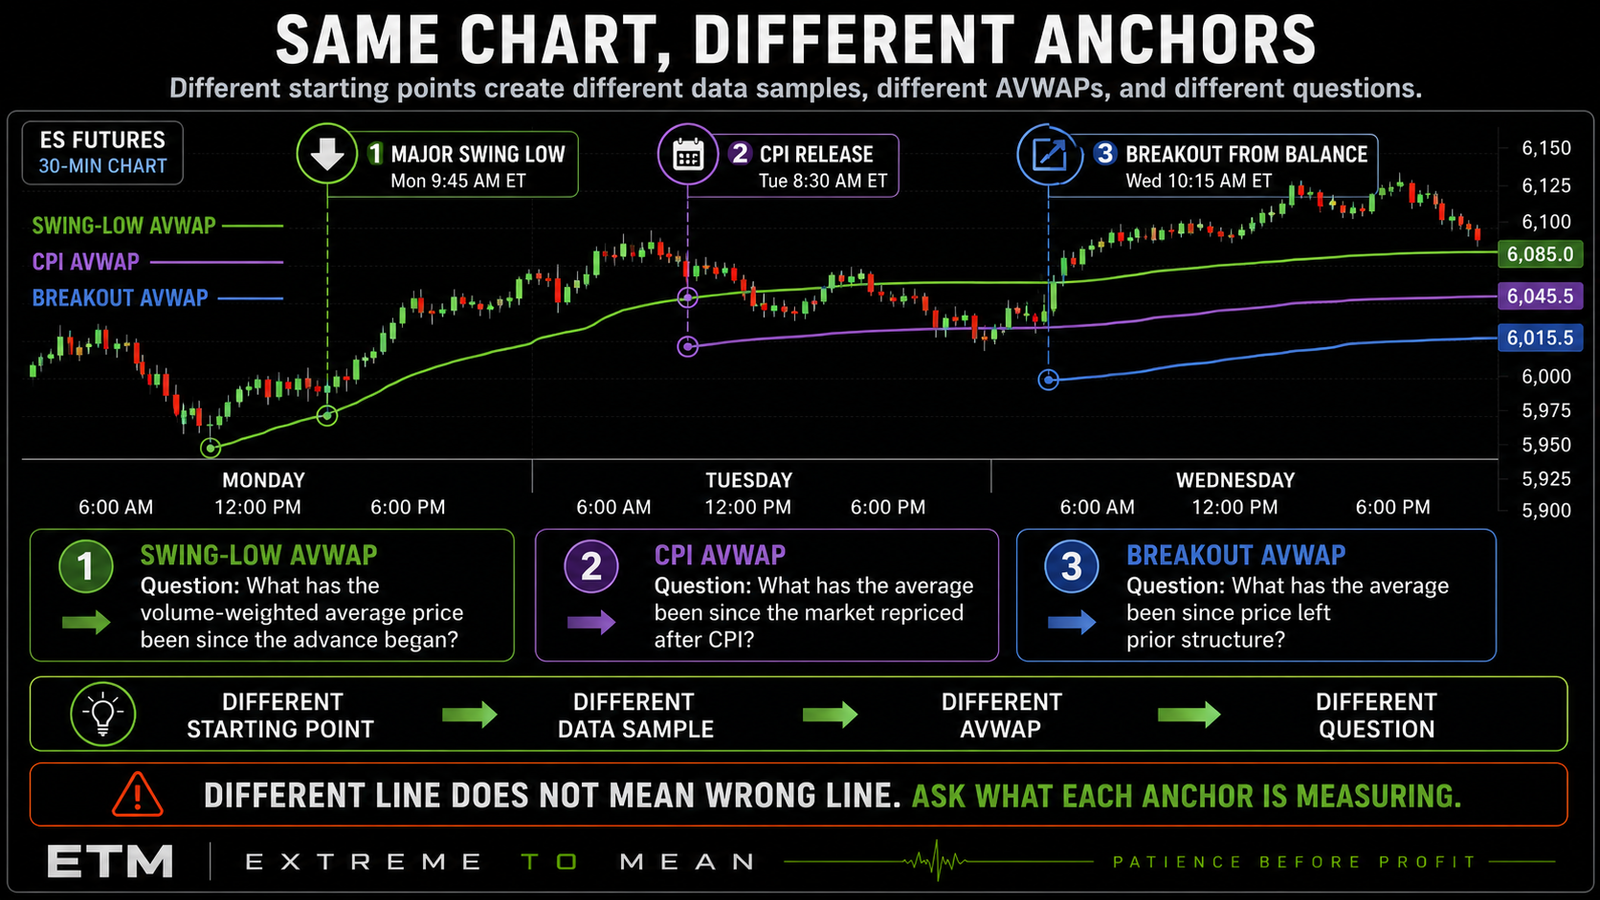
Suppose ES has been trading for several days. One trader anchors from Monday’s swing low, another from Tuesday’s CPI release, and another from Wednesday’s breakout from balance. All three lines can be mathematically valid because they are answering different questions about different portions of market history.
The Anchor Changes the Question
An AVWAP anchored to Monday’s low asks what the volume-weighted average price has been since that low. A CPI AVWAP asks what the average has been since the market began repricing after new information arrived, while a breakout AVWAP asks what the average has been since price left a prior structure. The line only makes sense relative to the event from which it was calculated.
This is why AVWAP should not be treated as a superior version of ordinary VWAP. A session VWAP can be appropriate when the question concerns today’s trading activity, while an Anchored VWAP can be appropriate when the question concerns activity since a specific event or structural turning point. Changing the anchor changes the timeframe and context of the question, not the fundamental meaning of VWAP.
The distinction also keeps the indicator from becoming another universal definition of market value. AVWAP is a volume-weighted average of the selected post-anchor history, not an objective fair price, equilibrium point, or location the market is required to revisit. The line summarizes data; it does not exert force on price.
A Good Anchor Should Have a Reason
The practical rule is simple: do not begin with “Where does AVWAP look good?” Begin with “What event or structural change am I trying to measure from?” StockCharts identifies significant highs and lows, earnings events, gaps, and news-related events as common examples of starting points, but none of those automatically deserves an anchor.
A significant swing high or low can make sense because it may mark the beginning of a directional move or material structural change. A CPI or FOMC release can make sense because the information environment changed at a clearly identifiable moment. A breakout can make sense because the trader wants to isolate what has happened since price left a prior structure.
The starting point should matter before the AVWAP is calculated. If the only explanation for the anchor is that the resulting line happens to sit close to current price, there is no independent analytical reason for using it. That is not market analysis; it is line fitting.
The Anchor Should Come From the Question, Not the Answer
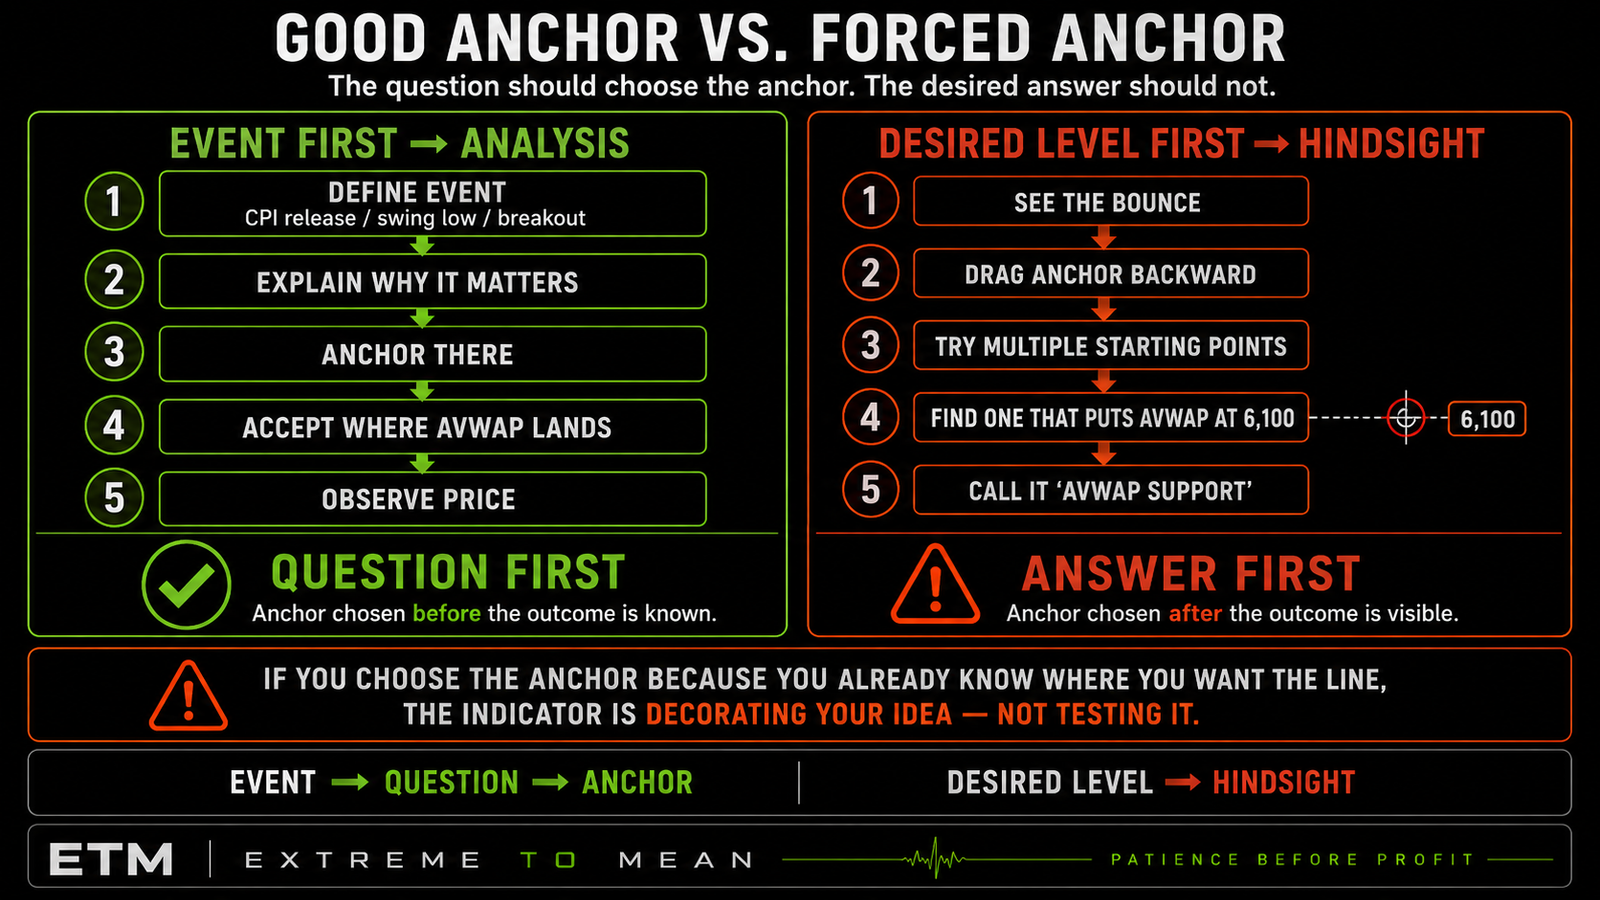
Imagine ES is trading around 6,100 and the trader begins dragging an Anchored VWAP backward across historical candles. One anchor produces a line near 6,135, another near 6,075, and eventually one lands almost perfectly at 6,100. The trader then announces that price is sitting on “AVWAP support.”
The process is backwards because the desired answer existed before the analytical question. A cleaner process is to identify a meaningful event first, explain why that event marks the beginning of the behavior being studied, anchor there, and accept whatever line the calculation produces. The indicator should be allowed to disagree with the trader’s preferred story.
If you choose the anchor because you already know where you want the AVWAP to appear, the indicator is no longer testing your idea—it is decorating it. That is the central analytical problem with AVWAP. Its flexibility can make it unusually easy to create evidence after the fact.
Hindsight Bias Is the Main AVWAP Trap
Anchored VWAP differs from session VWAP in one psychologically important way: the user can move the starting point. If the trader has already seen that price bounced at a particular area, it becomes very easy to search backward for an anchor that makes the AVWAP pass through that bounce. The finished chart can then appear far more predictive than the actual process was.
This is a form of hindsight optimization. The line may fit beautifully because the trader selected the starting point after knowing the result rather than because the anchor represented a question defined in advance. A convincing historical chart is not proof that the same anchor-selection process was available before the outcome occurred.
That is why AVWAP deserves the same skepticism Extreme to Mean applies to any clean-looking market reference. A line can improve context without proving the market will react to it again. Where you enter matters more than what you predict, and the same principle applies one step earlier: how you selected the reference matters more than how attractive it looks afterward.
Swing Highs, Swing Lows, and Event Anchors
Major swing highs and lows are common AVWAP anchors because they can represent meaningful directional turning points. Anchoring from a significant low, for example, tells the trader the volume-weighted average of transactions recorded since that selected low. It does not reveal the current cost basis of everyone who bought during the move.
The indicator cannot tell which traders entered, exited, added, reduced, hedged, rolled, or still hold positions. It also cannot distinguish institutional inventory from retail inventory or identify who is currently profitable. Describing AVWAP as “everyone’s average cost” adds information that the calculation does not actually contain.
News events can provide another defensible anchor when the information environment clearly changes. If CPI, payrolls, or an FOMC decision causes a major repricing, AVWAP can answer a specific question: what has the volume-weighted average price been since that repricing began? That is useful without making the stronger and unsupported claim that institutions are somehow using that exact line as their post-news cost basis.
Breakouts, Gaps, and Structural Changes
A breakout from meaningful structure can also provide a logical starting point. If ES spends hours in balance and then breaks decisively away, a trader might anchor VWAP from the breakout bar to study the price-volume history of the post-breakout phase. The resulting line is a contextual reference, not automatic new support, confirmation, entry, or stop placement.
Gaps require more care, particularly in futures. Equity-index futures trade overnight, so a cash-session gap, a futures-session gap, and overnight displacement are not interchangeable concepts. The trader should define exactly which discontinuity is being measured before using it as an anchor.
This is another example of why context comes before the candle. The visual event matters only after the trader understands what changed, which market session is relevant, and what question that event allows the AVWAP to answer. The chart should not decide the context for you.
Multiple AVWAPs Can Become a Level Generator
Modern charting software makes it easy to plot several Anchored VWAPs simultaneously. A trader can anchor from a major high, major low, CPI release, breakout, gap, yearly high, previous earnings event, and several other locations. Technically possible does not mean analytically useful.
A chart containing six AVWAPs, session VWAP, moving averages, support and resistance, and other references can quickly become a machine for generating reasons to act. No matter where price trades, something will be nearby. Instead of simplifying the market, the trader has created enough levels to justify nearly any interpretation.
Give every AVWAP a label and a job. Think CPI AVWAP, major swing-low AVWAP, or breakout AVWAP, not AVWAP 1, 2, and 3. If you cannot explain why a particular line is on the chart and what question it is answering, remove it.
Interaction Matters More Than Contact
Price touching an Anchored VWAP does not automatically create a trade. The market can pause, rotate, reject, break, reclaim, chop repeatedly through the line, or ignore it entirely. The useful information comes from how price behaves around the reference rather than from contact alone.
That distinction also keeps terms such as reclaim, loss, and hold descriptive before they become strategy rules. A reclaim can describe price moving from below the AVWAP to above it and then sustaining some trade there; a loss can describe the opposite behavior. Neither automatically means buy or sell.
This fits the broader market-first framework explored in how auction, liquidity, and emotion interact in market movement. AVWAP provides a reference generated from prior transactions, while the current auction still determines whether that reference matters. The trader’s job is to observe the interaction, not assume the outcome.
A CPI Anchored VWAP Example
Suppose ES is trading near 6,000 before an 8:30 a.m. ET CPI release. The data arrives and price rapidly reprices toward 6,035, after which the trader anchors VWAP to the CPI-release bar. Over the next several hours, the developing AVWAP sits around 6,025.
Later, price pulls back toward that area. Weak reasoning says, “CPI AVWAP is support, so buy.” Better reasoning says that 6,025 currently represents the volume-weighted average of transactions since the CPI repricing began, and the next task is to observe whether price stabilizes, accepts, rejects, or moves freely through that reference.
The line provides context rather than permission. Trend, structure, volatility, location, room, and risk still determine whether the interaction produces anything worth trading. Anchoring to the event simply gives the trader a disciplined way to study the post-CPI market rather than mixing that period with everything that occurred beforehand.
Anchor Selection Should Be Reproducible
A useful test is to imagine reviewing the chart two weeks later. Could you explain why you selected that exact bar without looking at how the subsequent market behaved? If the answer is yes, the anchor may have a defensible analytical rule.
Possible reproducible definitions include the first bar after a scheduled CPI release, a clearly identified swing low that later produced structural change, a breakout candle closing outside a previously defined balance, or the cash-session opening bar after a specifically defined overnight gap. These are examples of processes, not recommendations for which anchors every trader should use. The value is that another review of the same market event should lead to the same starting point.
This is where process protects the trader from hindsight. The cleaner question is not whether an anchor eventually produced a useful line, but whether the rationale for that anchor existed before its usefulness was known. Reproducibility makes the decision reviewable rather than purely visual.
A Practical Anchor-Selection Process
Use Event → Anchor → Calculation → Reference → Test → Reassess. The sequence makes the event and analytical question come first, which reduces the temptation to move the anchor until the resulting line confirms a preferred opinion. AVWAP should organize a defined market question rather than manufacture one.
- Event: What materially changed here?
- Anchor: Does this point represent the beginning of the behavior I want to study?
- Calculation: What price-volume history is now included?
- Reference: What does the resulting AVWAP actually represent?
- Test: How does current price behave around that reference?
- Reassess: Does the original event still define the market question, or has the context changed?
| Potential Anchor | Question It Might Help Answer | Main Risk |
|---|---|---|
| Major swing low | What is the volume-weighted average since this advance began? | Choosing the low only because it fits later price |
| Major swing high | What is the average since this decline began? | Treating AVWAP as automatic resistance |
| CPI / FOMC / news event | How has the market transacted since new information arrived? | Assuming the event remains dominant indefinitely |
| Breakout | What is the average since price left prior structure? | Anchoring every minor breakout |
| Gap / repricing event | How has activity developed since the price discontinuity? | Poorly defining which session or gap matters |
| Random candle | Usually no defensible analytical question | Pure hindsight curve-fitting |
The best anchor is not the one that creates the prettiest line. It is the one that corresponds to the market question you decided to study.
Before plotting an AVWAP, require three answers: What happened here? Why does this event mark the beginning of the behavior I want to study? Would I still choose this anchor if I could not see the candles that came afterward? If the third answer is no, hindsight may be doing most of the analytical work.
Final Thought
Anchored VWAP does not choose what matters. The trader chooses the starting point, and that means the trader has to defend that choice before seeing whether the line works. A meaningful anchor can isolate useful price-volume history; an arbitrary anchor can make almost any opinion look well supported.
The same discipline should apply after the line is drawn. AVWAP is not objective fair value, a magnet, an institutional cost-basis detector, or a guaranteed support or resistance level. It is a volume-weighted average calculated from a deliberately selected starting point, and the market remains free to trade above it, below it, through it, or far away from it.
Before you use an Anchored VWAP, ask: If everything after my chosen anchor disappeared from the chart, could I still explain why that exact event deserved to start the calculation? If yes, the anchor has a reason. If not, you may simply be drawing the line backward from the answer.
Readers who want to build the broader habit of using indicators to organize evidence rather than replace judgment can continue with Decode the Market.
Educational content only. Trading involves substantial risk and is not suitable for everyone.