
For another way to standardize distance, z-score trading explains what a standardized extreme means.
Average True Range, usually shortened to ATR, measures recent range-based volatility over a selected number of bars. When recent price ranges expand, ATR generally rises; when ranges contract, ATR generally falls. Inside The Market, that makes ATR useful as context rather than as a directional signal.
The danger comes from the indicator's precision. A value such as 4.7 points or a rule such as “2 ATR” can look objective enough to replace judgment, even when it is answering the wrong question. An indicator becomes dangerous when its precision makes you forget what question it actually answers.
What ATR Actually Measures
Start with the market before the formula. Imagine ES spending several periods producing ranges around four, five, six, and four points, then compare that with another session producing ranges closer to 18, 25, 21, and 30 points. The second environment is not automatically better or worse; it is simply moving more.
ATR gives the trader a standardized way to describe that difference. It does not tell you whether the larger ranges came from a rally, selloff, reversal, news event, or disorderly two-way trade. Fidelity and TradingView both define ATR as a volatility measure rather than a directional indicator. (fidelity.com)
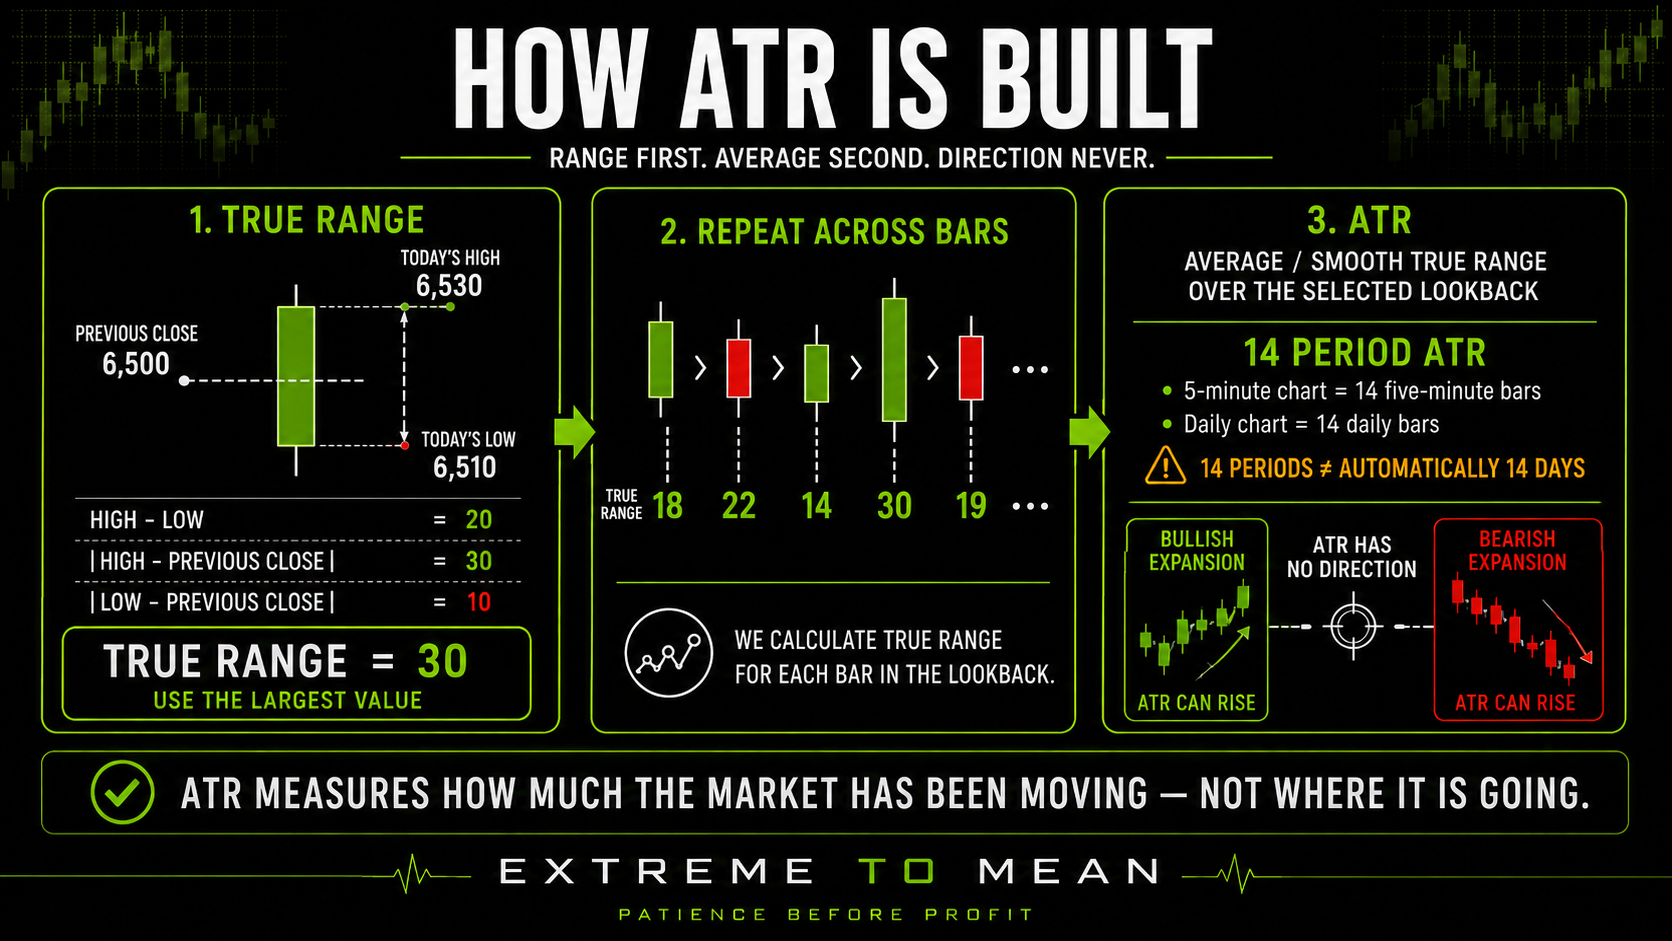
Before Average True Range comes True Range. True Range takes the largest of three measurements:
Current high − current low
|Current high − previous close|
|Current low − previous close|
The previous close matters because high minus low alone can miss movement that occurred between the prior close and the current period's trading range. Suppose yesterday's close was 6,500, today's high is 6,530, and today's low is 6,510. The three measurements are 20, 30, and 10 points, so True Range is 30 points rather than merely the day's 20-point high-to-low range. (fidelity.com)
ATR then smooths those True Range readings across a chosen lookback. Fourteen periods is the common default, but the word periods matters: 14 bars on a five-minute chart means 14 five-minute bars, while 14 periods on a daily chart means 14 daily bars. ATR length tells you how many bars; the chart timeframe tells you what those bars represent. (fidelity.com)
ATR Has No Direction—and No Daily Quota
ATR can rise during a powerful rally because bars are expanding. It can also rise during a violent selloff for exactly the same reason, while falling ATR can occur during a slow rise, slow decline, or sideways market. ATR can tell you the market is moving faster without telling you who is winning.
Falling ATR usually tells you that recent ranges are contracting. That may happen during consolidation, quiet overnight trading, midday compression, or another low-volatility environment, but it does not mean a breakout is guaranteed to follow. Low volatility can create conditions from which expansion eventually develops without identifying the timing or direction of that expansion.
ATR also does not tell the next session how far it must travel. If NQ has a daily ATR of 100 points, today's range might be 40 points, 100 points, 250 points, or something else entirely. ATR describes recent volatility; it does not issue a quota the next session must complete.
For the same reason, ATR should not be treated as a statistical standard deviation. One ATR does not automatically mean one sigma, and two ATR does not automatically describe a two-standard-deviation event or a particular probability boundary. ATR is a smoothed range measurement, not a probability distribution.
Average Daily Range is related but different. ADR generally focuses on daily high-to-low movement, while ATR's True Range construction also considers movement relative to the previous close. ADR asks how wide the day was; ATR asks how large the true price range was relative to the prior period as well. (tradingview.com)
The Setting and Timeframe Change the Question
Fourteen periods is a convention, not a law. A shorter ATR lookback responds more quickly to recent changes in volatility, while a longer lookback changes more slowly and provides a broader baseline. The correct setting depends on the strategy, timeframe, holding period, and question the trader is trying to answer. (fidelity.com)
That means a five-minute ATR of three ES points and a daily ATR of 70 points are not contradictory. One describes recent movement per five-minute bar, while the other describes recent True Range across daily bars. One ATR value is meaningless unless you know the timeframe behind it.
Calculation details can matter as well. TradingView's default ATR uses Wilder-style RMA smoothing but allows other smoothing choices, while other platforms may implement their calculations differently. Two indicators labeled “14 ATR” can therefore disagree if their smoothing, market data, or session inputs are not identical. (tradingview.com)
The session template is another input. A 14-period five-minute ATR built from the full futures session may differ from one built only from cash-session bars, especially around the 9:30 a.m. equity open when range and participation can change quickly. The broader lesson on futures trading hours helps explain why the same instrument can behave very differently across the trading day.
Structure First, ATR Second
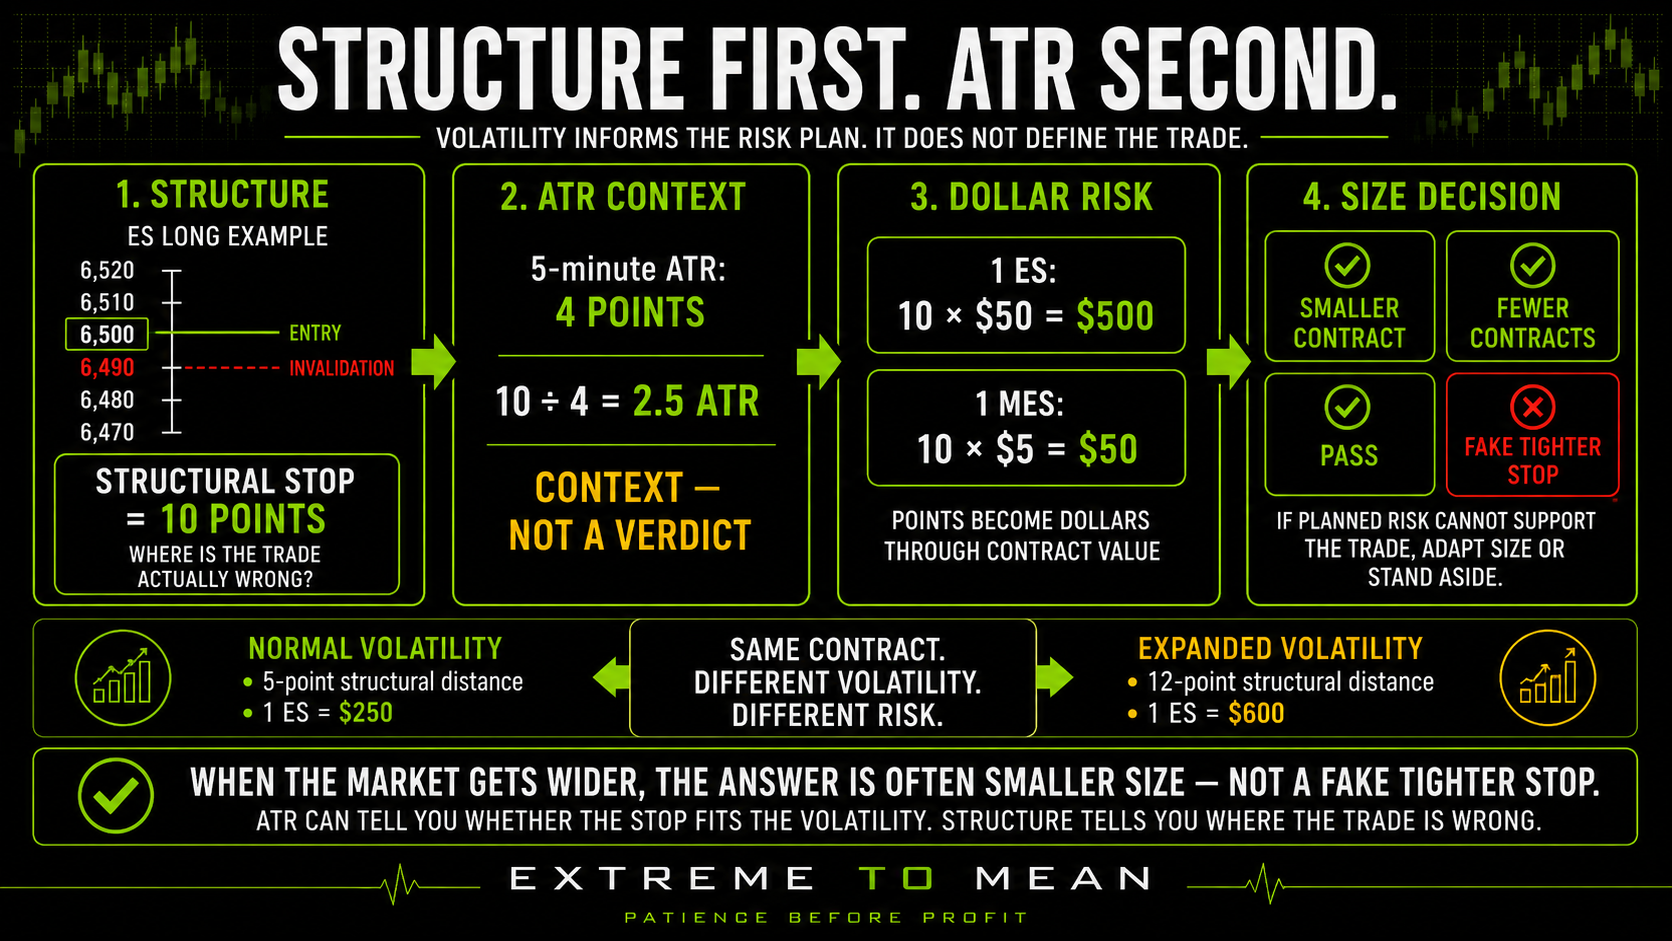
One of ATR's best uses is asking whether a planned stop makes sense relative to recent movement. That is different from asking ATR to choose the stop. The original invalidation should still come from the structure of the trade.
Suppose an ES long is planned at 6,500 and the actual structural invalidation is 6,490, creating a 10-point stop. If the recent five-minute ATR is four points, the stop is 2.5 times that recent five-minute range measurement. That information tells you the stop is relatively wide compared with recent bar volatility; it does not prove that the stop is correct, too wide, safe, or likely to survive.
Now consider a structural invalidation at 6,486 with ATR at five points. A mechanical two-ATR stop would create a 10-point stop at 6,490 even though the trade thesis remains valid down to 6,486. A volatility formula should not overrule the reason the trade exists.
This is why ATR works better as a stop sanity check than as automatic stop placement. After identifying the entry and invalidation, ask whether normal recent movement is large relative to that distance, whether volatility has expanded enough to make the dollar risk unacceptable, and whether a smaller contract or no trade is cleaner. ATR can tell you whether the stop fits the volatility; structure tells you where the trade is actually wrong.
ATR multiples such as 1, 1.5, 2, or 3 can still be legitimate parameters inside a defined strategy. They should be tested rather than treated as natural laws simply because the number contains a decimal and an indicator name. Adding a decimal to ATR does not turn a parameter into an edge.
Volatility Changes What the Same Stop Means in Dollars
ATR becomes especially useful for futures when it is connected to contract value. Price volatility is measured in points, but the trading account experiences those points in dollars, which is why understanding ticks, points, and contract value remains essential. The multiplier connects the volatility on the chart to the financial exposure in the account.
For ES, one full index point represents $50 per contract, while MES represents $5 per point. A 10-point structural stop therefore represents $500 of price risk for one ES or $50 for one MES before commissions, fees, and execution effects. CME's current specifications confirm those $50 and $5 multipliers. (cmegroup.com)
The general relationship is:
Dollar Risk Per Contract = Stop Distance in Points × Dollar Value Per Point
Then:
Position Size = Maximum Planned Dollar Risk ÷ Dollar Risk Per Contract
The result still has to be rounded down to an allowable whole-contract quantity.
Suppose an ES strategy normally reaches invalidation five points from entry, creating $250 of price risk per contract. Volatility later expands and the same valid setup now requires 12 points of structural room, which creates $600 per ES contract. If the trader's risk budget has not changed, pretending the old five-point stop still belongs there does not solve the problem.
The cleaner response may be fewer contracts, a smaller contract such as MES, or passing on the trade. When the market gets wider, the answer is often smaller size—not a fake tighter stop. ATR did not choose the stop or the size; it helped reveal that the economics of the trade changed.
The same principle applies to Nasdaq futures. A hypothetical 25-point NQ ATR represents $500 of contract-level movement using NQ's $20-per-point multiplier, while the same 25 points represents $50 in MNQ at $2 per point. Those figures are not stop recommendations; they simply show why identical market volatility can create dramatically different account pressure depending on the contract selected. (cmegroup.com)
ATR Can Test a Target Without Choosing It
ATR can also help answer whether a target is ambitious relative to recent movement. Suppose a trader wants a 40-point NQ move while the current five-minute ATR is 30 points; on another day, the same 40-point target appears while five-minute ATR is only six points. The target is not automatically correct or incorrect in either case, but the volatility context is very different.
Target construction still belongs to structure, the mean, support or resistance, previous highs and lows, available room, setup type, time remaining, and opposing liquidity. ATR adds another question: how much movement is the proposed target asking from the current environment? ATR can help test whether a target is realistic without deciding where the target belongs.
Daily ATR creates another common mistake. If ES has an 80-point daily ATR and today's range has already reached 75 points, the market is not limited to another five points; if the session has moved only 20, it is not obligated to produce another 60. ATR is context—not a speed limit and not a distance requirement.
Some traders call daily ATR minus the current day's range “ATR remaining.” That comparison can be descriptive, but it becomes dangerous when translated into “the market still owes us 30 points.” An average does not create unfinished business.
The same setup can therefore require very different expectations as volatility changes. Reviewing how market conditions change the quality of a setup helps because wider ranges can change stop feasibility, target realism, execution quality, and risk without changing the name of the setup. Volatility is a condition—not a setup.
ATR Is Historical Context, Not Event-Risk Insurance
ATR is lagging by construction because it is calculated from ranges that have already occurred. When volatility suddenly explodes, ATR rises after the expansion begins; when volatility collapses, old large ranges can keep the reading elevated for a while. ATR adapts to volatility; it does not know the next volatility regime before the market reveals it.
That distinction matters around scheduled news. Two quiet hours before CPI can produce low intraday ATR, but the indicator cannot pre-price the exact size of the release bar using only prior price ranges. Low ATR before an event is therefore not evidence that the next bar will remain quiet.
The cash open can create the same effect on a smaller scale. Overnight price action may produce small five-minute ranges before participation and volatility expand sharply after 9:30 a.m. Eastern Time. ATR responds to the new bars as they enter the calculation rather than forecasting that change beforehand.
Continuous futures charts introduce one more technical wrinkle. Because True Range uses the current price and previous close, an unadjusted rollover between differently priced expirations can create a large artificial-looking range in a stitched data series. Before interpreting an unusual historical ATR spike, know whether the chart contains raw rollover gaps or adjustments.
Raw ATR Is Best Compared With the Same Market
A raw ATR value is expressed in the instrument's own price units. An ES ATR of 20 and NQ ATR of 80 therefore do not prove that NQ is exactly four times as volatile because the indexes trade at different levels and naturally use different point scales. TradingView explicitly cautions against casual comparison of absolute ATR values across differently priced instruments. (tradingview.com)
One way to normalize that comparison is ATR percentage:
ATR% = ATR ÷ Price × 100
ATR% expresses volatility relative to the market's price rather than only in raw points. Fidelity and TradingView both document this percentage form as useful when comparing instruments with different price levels. (tradingview.com)
For a futures trader, however, percentage volatility is still not the complete risk picture. Contract multipliers, structural stop distance, quantity, and planned account risk remain necessary before the volatility becomes an actual trade decision. ATR is measured in price; futures risk is experienced in dollars.
A Practical ATR Framework
Use Structure → Volatility → Distance → Dollars → Size → Target → Decision. The hierarchy keeps the indicator in its proper place: first determine what the trade means structurally, then use ATR to understand the volatility environment surrounding that structure. ATR measures the environment; risk decisions still belong to the trader.
- Structure: Where is the trade actually invalidated?
- Volatility: How large has recent movement been on the relevant timeframe?
- Distance: How far are entry, invalidation, and target from one another?
- Dollars: What do those distances mean for this futures contract?
- Size: What contract quantity fits the planned risk?
- Target: Is the expected move reasonable for the current environment and structure?
- Decision: Does the trade still make sense, or has volatility changed its economics enough to pass?
The better question is not “What ATR multiple should I use?” Ask, “What does current ATR tell me about the movement surrounding my actual structural stop and target, and does that volatility still allow me to take the trade at acceptable risk?” That question uses the indicator to improve judgment rather than outsource judgment.
ATR can also express distance in volatility-adjusted terms for research, such as asking how many ATR units price has moved away from a reference. That can make comparisons across different regimes more useful, but it does not turn a two-ATR stretch into an automatic extreme or mean-reversion trade. A volatility-adjusted distance can identify stretch without granting permission to fade it.
Final Thought
ATR is valuable because it answers one question well: how large has recent price movement been? It does not tell the trader whether price should rise, fall, reverse, break out, complete its average range, or respect a particular ATR multiple. A mathematically precise volatility reading can still be misused if the trader asks it to solve a directional or structural problem.
The cleaner hierarchy is simple. Structure determines where the trade is wrong, ATR describes the volatility around that structure, contract value converts the distance into dollars, and position size determines how much of that risk reaches the account. That is exactly where ATR becomes useful without being allowed to replace the trading process.
When volatility expands, the trade may require more room, smaller size, or no participation at all. When volatility contracts, the environment may support tighter movement without promising an eventual breakout. ATR improves the description of the market; the trader still has to decide whether the setup has earned risk, which is part of the broader process developed throughout Decode the Market.
Educational content only. Trading involves substantial risk and is not suitable for everyone.