
What a Candlestick Cannot Show You
Two bullish candles can look almost identical while containing very different order-flow behavior. One may rise as aggressive buyers repeatedly lift offers, while another may rise because relatively little sell liquidity stands in the way. The candle shows the result; the footprint lets us look inside the result.
That extra detail can improve a market question, but it does not remove uncertainty. A footprint is a more granular view of executed transactions, not a screen that reveals every participant or future outcome. In the broader Market curriculum, more information matters only when it improves the decision.
Quick Footprint Refresher: Bid Volume vs. Ask Volume
Inside a footprint bar, traders commonly see bid-side and ask-side executed volume at each price. Volume classified at the bid is generally associated with aggressive sellers hitting resting bids, while volume classified at the ask is generally associated with aggressive buyers lifting resting offers. Every completed trade still has both a buyer and a seller; we are describing which side crossed the spread for immediate execution.
An ask imbalance does not mean there were “more buyers than sellers,” and a bid imbalance does not mean sellers traded without counterparties. We are classifying which side demanded immediate execution. Bid and ask volume tell us which side crossed the spread, not which side eventually won the auction.
What Is a Bid-Ask Imbalance?
A bid-ask imbalance occurs when executed volume on one side is substantially larger than the comparison volume on the other side under the platform's configured calculation. Much more ask-side execution can be highlighted as buying imbalance, while much more bid-side execution can be highlighted as selling imbalance. The important word is relative, because a large raw number means little without knowing the comparison.
A highlighted cell is also not a new market event. The event was the executed volume; the software simply applied a rule to that data. The imbalance exists in the traded volume, while the color exists in your chart settings.
Horizontal vs. Diagonal Imbalance
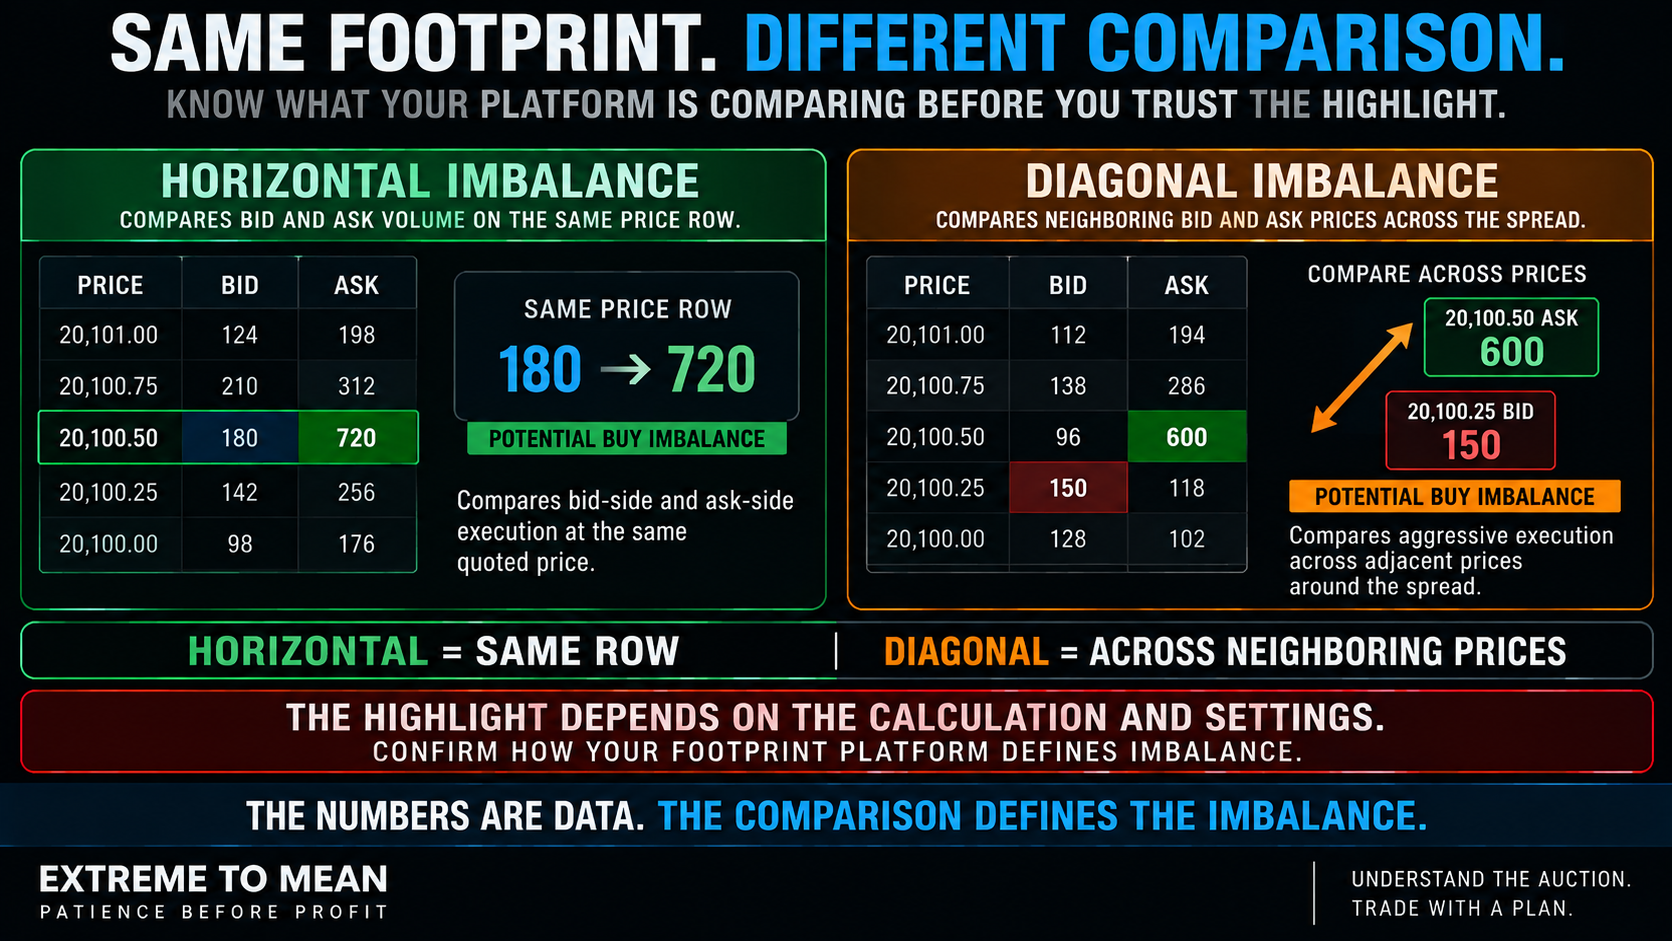
A horizontal comparison generally compares bid-side and ask-side volume on the same price row. If 20,100.00 shows 180 contracts at the bid and 720 at the ask, substantially more volume there was classified as aggressive buying. The exact ratio needed for a highlight depends on the chosen settings.
A diagonal comparison instead looks across neighboring bid and ask prices. A platform might compare 600 contracts executed at the ask at 20,100.00 with 150 executed at the bid one tick below at 20,099.75. That comparison may be flagged as a buy imbalance depending on how the software is configured.
The plain-English distinction is simple: horizontal compares both sides of one price row, while diagonal compares neighboring bid and ask prices. Different footprint platforms can calculate or display those comparisons differently, so confirm how your software defines them. The concept matters more than memorizing one platform's color scheme.
There Is No Universal “Correct” Threshold
Footprint software often lets traders choose a percentage or ratio that triggers an imbalance highlight. That number is a visualization and research parameter, not a market law, so there is no universal setting we need to crown as “correct.” The market does not know which percentage you selected.
Consistency still matters if you want to research whether imbalance adds value. Changing the ratio or minimum-volume settings whenever a historical screenshot would look better destroys the definition you are trying to test. The threshold does not have to be universal; it does have to be defined.
Aggression vs. Result
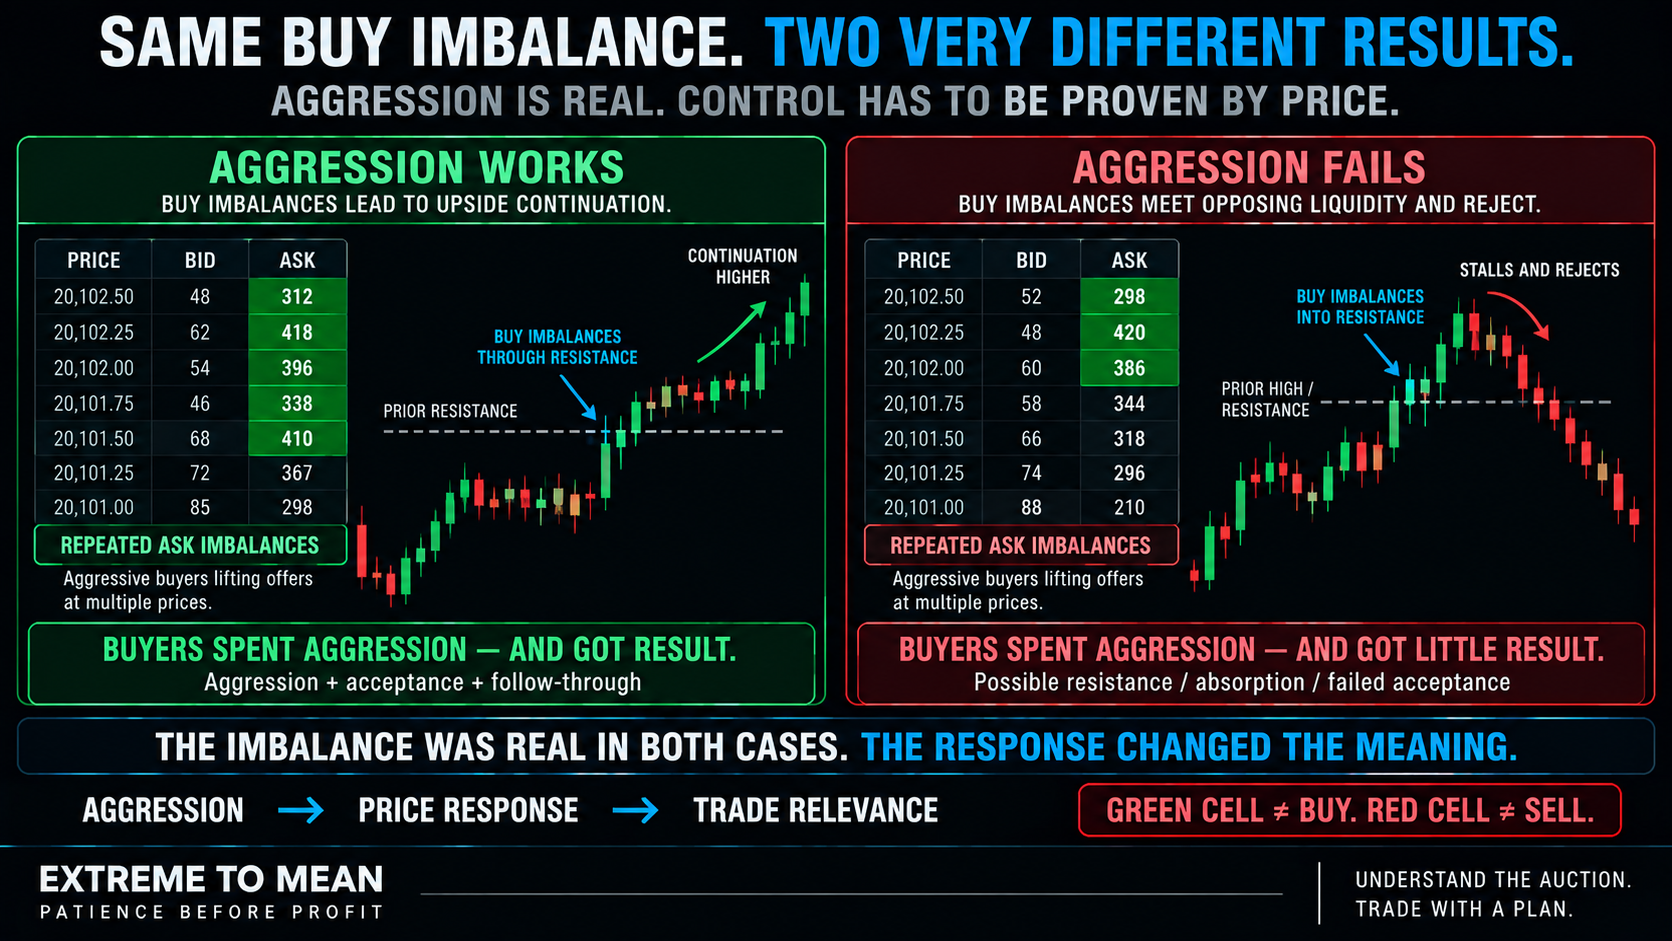
Suppose a footprint prints a large ask-side imbalance. The reliable statement is that aggressive buyers executed substantially more volume at the relevant comparison than aggressive sellers did. The next question is whether all that buying actually moved price.
If price advances cleanly and accepts higher, the result agrees with the aggression. If the same heavy buying appears near a high but price stalls, cannot advance, and then rejects, the information changes completely. The imbalance was real in both cases; the price response changed what it meant.
Sell imbalances work the same way. Heavy aggressive selling followed by clean downside progress tells one story, while heavy selling that cannot push below a meaningful low tells another. The footprint tells us where the aggression occurred; price tells us whether that aggression accomplished anything.
Imbalance Is Not Delta, CVD, or the DOM
Footprint imbalance is localized at or between specific prices. Bar delta generally summarizes the difference between ask-side and bid-side execution over a broader unit, while CVD accumulates those differences through time. The tools are related, but they answer different questions.
The DOM is different again because it primarily shows displayed resting liquidity and market depth rather than completed transactions. Displayed orders can change or disappear, while footprint volume represents trades that already occurred. The broader auction-and-liquidity framework helps explain why aggressive execution and available liquidity can produce very different price outcomes.
What Is a Stacked Imbalance?
A stacked imbalance generally means the configured imbalance condition appears across several adjacent prices in the same direction. Repeated ask-side imbalances can show sustained aggressive buying, while repeated bid-side imbalances can show sustained aggressive selling. A cluster may deserve more attention than one isolated cell because the behavior persisted across multiple prices.
Stacked does not mean guaranteed continuation. Repeated buying can drive a breakout successfully, or it can run into enough opposing liquidity to fail near an important high. More highlights give us more information about the aggression, not certainty about the outcome.
Location Matters More Than the Color
A bright imbalance in the middle of a noisy range may not matter much. The same activity after a clean reclaim, through a meaningful prior high, or at a range boundary can carry very different information. That is another version of the ETM principle that context comes before the candle.
The exact same buy imbalance can support continuation in one environment and failure in another. Aggressive buying during a healthy breakout may support successful initiative activity, while aggressive buying into a mature extension can become interesting because price refuses to advance. Market conditions change the quality of a setup, and they change the usefulness of order-flow information too.
Do not let the footprint manufacture the location. If an area only matters because a cell turned green or red, the decision hierarchy has been reversed. Market first, location second, order flow third.
Big Ratios Can Be Misleading
A huge percentage imbalance can look more important than it really is because the denominator matters. A comparison of 30 versus 5 can produce a more dramatic ratio than 2,400 versus 900 even though much less volume actually traded. Ratio and absolute activity answer different questions.
Low-volume conditions can exaggerate this problem because one side of the comparison may contain almost nothing. A bigger ratio does not automatically mean a better trade, and high volume does not automatically mean control either. The useful question remains what price did with the aggression.
Settings, Data, and Contract Choice Matter
Two traders can see different highlights in the same market because their footprint settings differ. Comparison method, imbalance ratio, minimum-volume filters, price aggregation, bar type, session definition, and data handling can all change the display. Different highlighting does not automatically mean one chart is wrong.
Contract choice matters as well. ES and MES are closely linked in price but have separate executions, just as NQ and MNQ do. A trader may analyze an E-mini footprint while executing a Micro, but should know exactly which contract's order flow is informing the decision.
Footprints also do not reveal trader identity. A large ask imbalance does not prove a hedge fund bought there, and a large bid imbalance does not prove institutions sold there. The numbers describe classified execution, not the participant's name, motive, or next action.
A Practical ETM Imbalance Filter
Before a footprint imbalance earns influence over a trade, work through the market in the proper order. The goal is not to narrate every number inside the footprint. It is to decide whether the order-flow information contributes useful evidence to an already-defined setup.
- Context: Is the market trending, balancing, extending, failing, or reacting to unusual conditions?
- Location: Why does this area matter before looking at the footprint?
- Aggressor: Which side is crossing the spread more aggressively?
- Imbalance: Is the difference meaningful under a defined configuration?
- Cluster: Is it isolated or repeated across neighboring prices?
- Result: Did price actually move in the direction of the aggression?
- Response: Did that result persist or begin to fail?
- Structure: What changed in price behavior afterward?
- Qualification: Does a real setup now exist?
- Risk: Where is the thesis wrong, and does the risk fit?
The condensed version is Context → Location → Aggression → Imbalance → Price Response → Trade. That sequence keeps a footprint color from creating the market thesis and leaves order flow downstream of the actual market. It also reinforces the ETM principle that the market comes first.
The better question is not, “Is this a buy imbalance or a sell imbalance?” Ask, “Where did the aggression occur, what did price do because of it, and did that result persist?” That turns the footprint from a signal board into a tool for evaluating the auction.
Final Thought
Bid-ask imbalance is valuable because it shows where aggressive buying or selling became unusually one-sided inside a footprint. It gives us detail that a normal candle hides, but a highlighted cell is still information about execution rather than permission to trade. Aggressive volume is not the same as control.
The most important information often comes after the imbalance. Did the aggression move price, did it fail, did it persist, or did the other side resist enough to stop progress? The exact same footprint pattern can support continuation in one context and failure in another.
Market first. Location second. Order flow third. Use the footprint to improve the question, then let price response, qualification, invalidation, and risk decide whether the information belongs in a trade. That process-first hierarchy is part of the broader Extreme to Mean system.
Educational content only. Trading involves substantial risk and is not suitable for everyone.