
A Candlestick Pattern Is Evidence, Not a Trade
Candlesticks describe price behavior over a chosen period of time. A wick shows where price traveled and failed to remain by the close, while a larger body shows meaningful movement between the open and close. Those observations can be useful without turning the candle into an automatic instruction to buy or sell.
That distinction matters throughout the Setup curriculum. A candle should help answer a question the trader already has about location, structure, or behavior; it should not create an opportunity from nothing. The weaker process is pattern appears → trade, while the better process begins with context and location first.
This is why a setup is not a signal. Recognizing a familiar shape does not complete the trade decision because location, risk, room, and surrounding market behavior still matter. The candle is one piece of evidence inside the setup rather than the setup itself.
Why Location Changes What a Candle Means
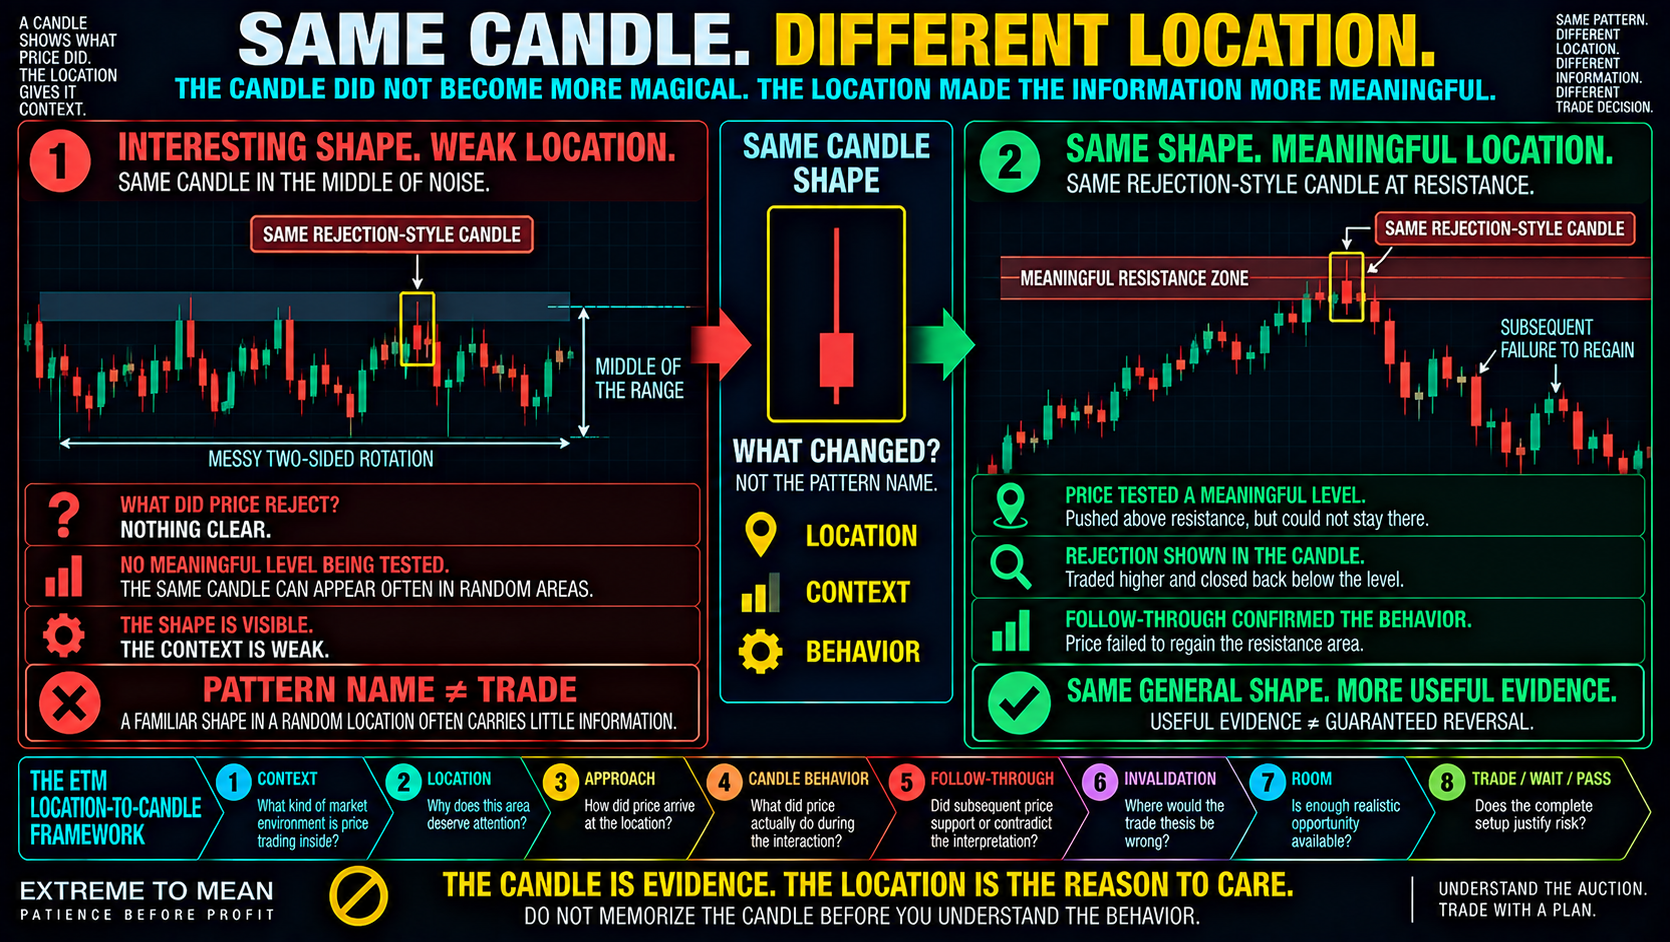
Imagine price is chopping back and forth in the middle of a range. One candle pushes higher, leaves a long upper wick, and closes lower, creating the kind of shape many traders might call a shooting star or rejection candle. The shape is interesting, but there may be no meaningful reason that this particular area should matter.
Now place almost the same candle at previously important resistance. Price rallies into the area, pushes briefly above it, fails to remain there, and closes back below the level; subsequent price also fails to reclaim the area. The visual shape is similar, but the second candle gives the trader information about how price behaved when it tested a location that already deserved attention.
That is the practical version of why context comes before the candle. The candle did not become more powerful because it appeared near a horizontal line; the location simply gave the behavior something meaningful to test. The better question is not “What candle is this?” but “What happened when price reached this area?”
Rejection Candles: What the Wick Actually Shows
Long wicks are often taught through names such as hammer, pin bar, or shooting star, but the behavior matters more than the label. A wick tells us that price traded farther in one direction during the candle and then closed away from that extreme. It does not tell us by itself why the movement occurred or what price must do next.
Near meaningful location, that information becomes more useful. If price tests resistance, trades above it, and then closes back below, the trader can reasonably observe that higher prices were not maintained during that candle. Near support, a long lower wick may similarly show that price explored lower and failed to remain there by the close.
This still does not mean “hammer equals buy” or “shooting star equals short.” A single wick does not prove buyers or sellers have permanently taken control, and it does not guarantee reversal. The useful question is: Where did price try to go, and did it succeed in staying there?
Engulfing Candles and Strong Closes: When Pressure Changes
Engulfing candles attract attention because they make a change in immediate price behavior visually obvious. A strong opposite candle can overwhelm much of the recent movement and close decisively away from the direction price had been traveling. Near an important area, that can add evidence that the immediate auction behaved differently after reaching the level.
Again, the name is secondary. The trader does not need to debate whether the candle satisfies every textbook definition of bullish or bearish engulfing if the important observation is that prior progress stopped and price moved decisively the other way. The behavior is what should feed the trade thesis.
Location remains the filter. A dramatic candle in the middle of random rotation may simply be another burst inside a noisy market, while a similar candle after price interacts with meaningful structure can carry more information. That is why location is the first filter before the trader starts assigning importance to the trigger.
Doji and Indecision: A Pause Is Not a Reversal
A doji or small-bodied candle often tells the trader that the market covered some distance but finished near where the candle began. That may indicate hesitation, slowing momentum, or temporary balance during that particular period. It does not automatically prove that the opposite side has taken control.
This distinction becomes especially important near a key level. If a strong move reaches resistance and then begins producing smaller bodies or doji-like candles, the trader can reasonably say that the prior pace has slowed. The market still has to show what it does with that hesitation.
Sometimes the pause becomes rejection and reversal. Other times price rests briefly and then continues through the level with renewed strength. Indecision is information, but indecision is not the same thing as reversal.
Why Follow-Through Matters More Than a Perfect-Looking Pattern
A beautiful candle can fail immediately. Price can print a textbook-looking rejection at resistance and then trade straight back through the level on the next few candles, or it can print a strong bullish candle at support and then lose the area almost immediately. The market is allowed to contradict the first interpretation.
Follow-through helps the trader evaluate whether the behavior represented by the candle is being maintained. Does price continue rejecting the area, hold the reclaim, fail to regain the level, or instead accept beyond the location that supposedly produced the signal? Those observations can strengthen or weaken the interpretation without creating a universal confirmation rule.
This should not become an excuse to wait forever for certainty. More confirmation can improve evidence while also worsening entry location, which is why the trader still has to balance evidence with the quality of the actual opportunity. The goal is to see enough response to evaluate the setup without waiting until the trade geometry has disappeared.
The Candle Should Answer a Setup Question
A candle becomes useful when the trader already knows why the area deserves attention. Perhaps price is testing prior structure, a meaningful support or resistance zone, an established extreme, or another location defined by the trader’s process. The candle then helps answer how price behaved once it got there.
That sequence prevents pattern hunting. Instead of scanning every chart for hammers and engulfing candles, the trader first identifies where the market could reasonably become interesting and then observes the response. Location creates the question; candle behavior helps provide evidence.
Risk still has to be defined before evidence becomes a trade. A great-looking rejection candle with vague invalidation or very little room ahead can still be a poor opportunity, which is why the trade is not ready until the risk is clear. Candlestick evidence does not remove the need for a complete trade plan.
The ETM Location-to-Candle Framework
The purpose of this framework is to keep the candle in its proper place inside the decision. Traders should move from the broader market environment toward location, then evaluate the actual response before deciding whether a trade exists. The candle is evidence inside that sequence, not the starting point.
- Context — What kind of market environment is price trading inside?
- Location — Why does this area deserve attention?
- Approach — How did price arrive at the location?
- Candle behavior — What did price actually do during the interaction?
- Follow-through — Did subsequent price support or contradict that interpretation?
- Invalidation — Where would the trade thesis be wrong?
- Room — Is enough realistic opportunity available for the trade to make sense?
- Trade / wait / pass — Does the complete setup justify risk?
The condensed framework is Context → Location → Approach → Candle Behavior → Follow-Through → Invalidation → Room → Trade / Wait / Pass. It deliberately avoids turning any one candlestick name into a universal trigger. The trader is evaluating behavior at location, not collecting patterns.
The better question is not, “What pattern is this?” Ask, “What does this candle tell me about what price did at this location?” That question forces the trader to read the market before reading the label.
Final Thought
Candlestick patterns can be useful, but not because certain shapes contain hidden instructions about what price must do next. They are compact descriptions of what happened between an open, high, low, and close, and their usefulness depends heavily on the market context and location surrounding them. The same rejection-style candle can be meaningful at one place and nearly irrelevant at another.
That is why memorizing larger and larger collections of named formations rarely solves the real problem. A smaller set of behaviors—rejection, decisive movement, hesitation, failure, acceptance, and follow-through—can tell the trader far more when they are interpreted around locations that already matter. The goal is not to become better at naming candles; it is to become better at understanding what the candle is showing.
The candle is evidence. The location is the reason to care. That is the approach the broader Extreme to Mean system is built around: start with context and location, evaluate the market’s response, define the risk, and only then decide whether the evidence has earned a trade.
Educational content only. Trading involves substantial risk and is not suitable for everyone.