
A Quick Refresher: What Delta and CVD Measure
Delta compares volume classified as aggressively executed at the ask with volume classified as aggressively executed at the bid. Positive delta points to more aggressive buying; negative delta points to more aggressive selling. Every completed trade still has both a buyer and a seller, so delta describes which side demanded immediate execution.
Cumulative Volume Delta, or CVD, adds those delta values over a defined sequence or session. If aggressive buying dominates repeatedly, CVD tends to rise; if aggressive selling dominates, it tends to fall. The broader Market curriculum matters here because order flow is one view of the auction, not a replacement for price, location, structure, or context.
What Delta Divergence Actually Is
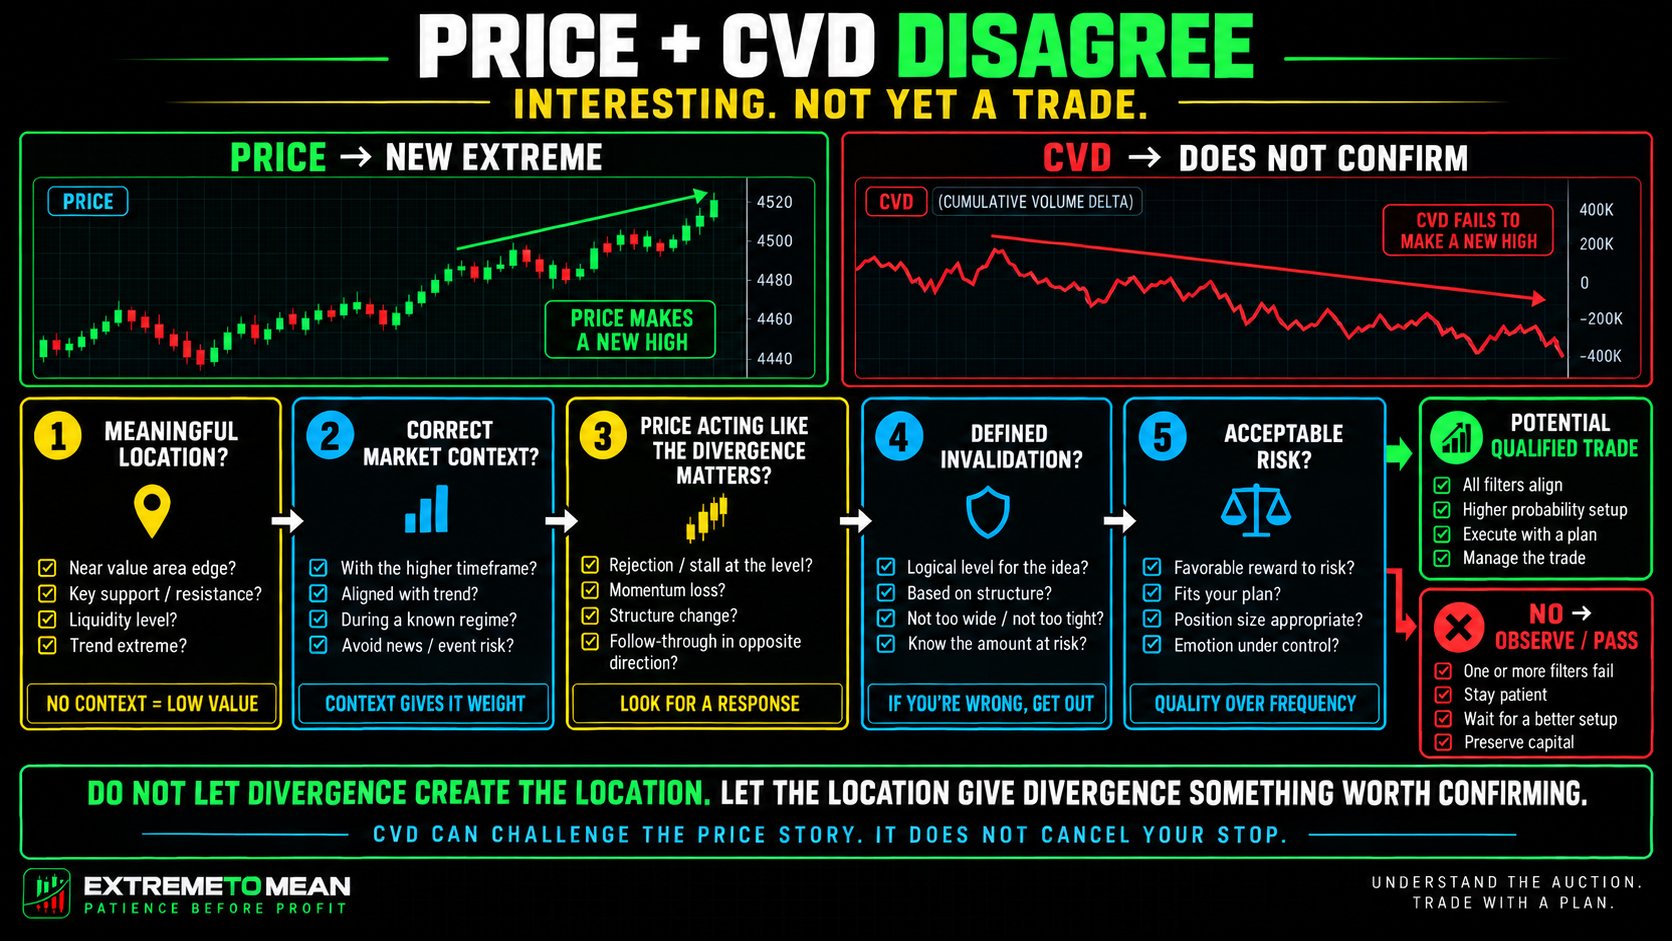
Delta divergence occurs when the path of price and the path of cumulative aggressive order flow stop confirming each other in a meaningful way. A classic bearish example is price making a higher high while CVD makes a lower high or no new high; a classic bullish example is price making a lower low while CVD makes a higher low or no new low. Neither pattern says, “Enter the reversal.”
| Price | CVD | Common Description | Better Question |
|---|---|---|---|
| Higher high | Lower high / no new high | Bearish divergence | Are buyers becoming less effective, or is opposing liquidity absorbing their aggression? |
| Lower low | Higher low / no new low | Bullish divergence | Are sellers becoming less effective, or is opposing liquidity absorbing their aggression? |
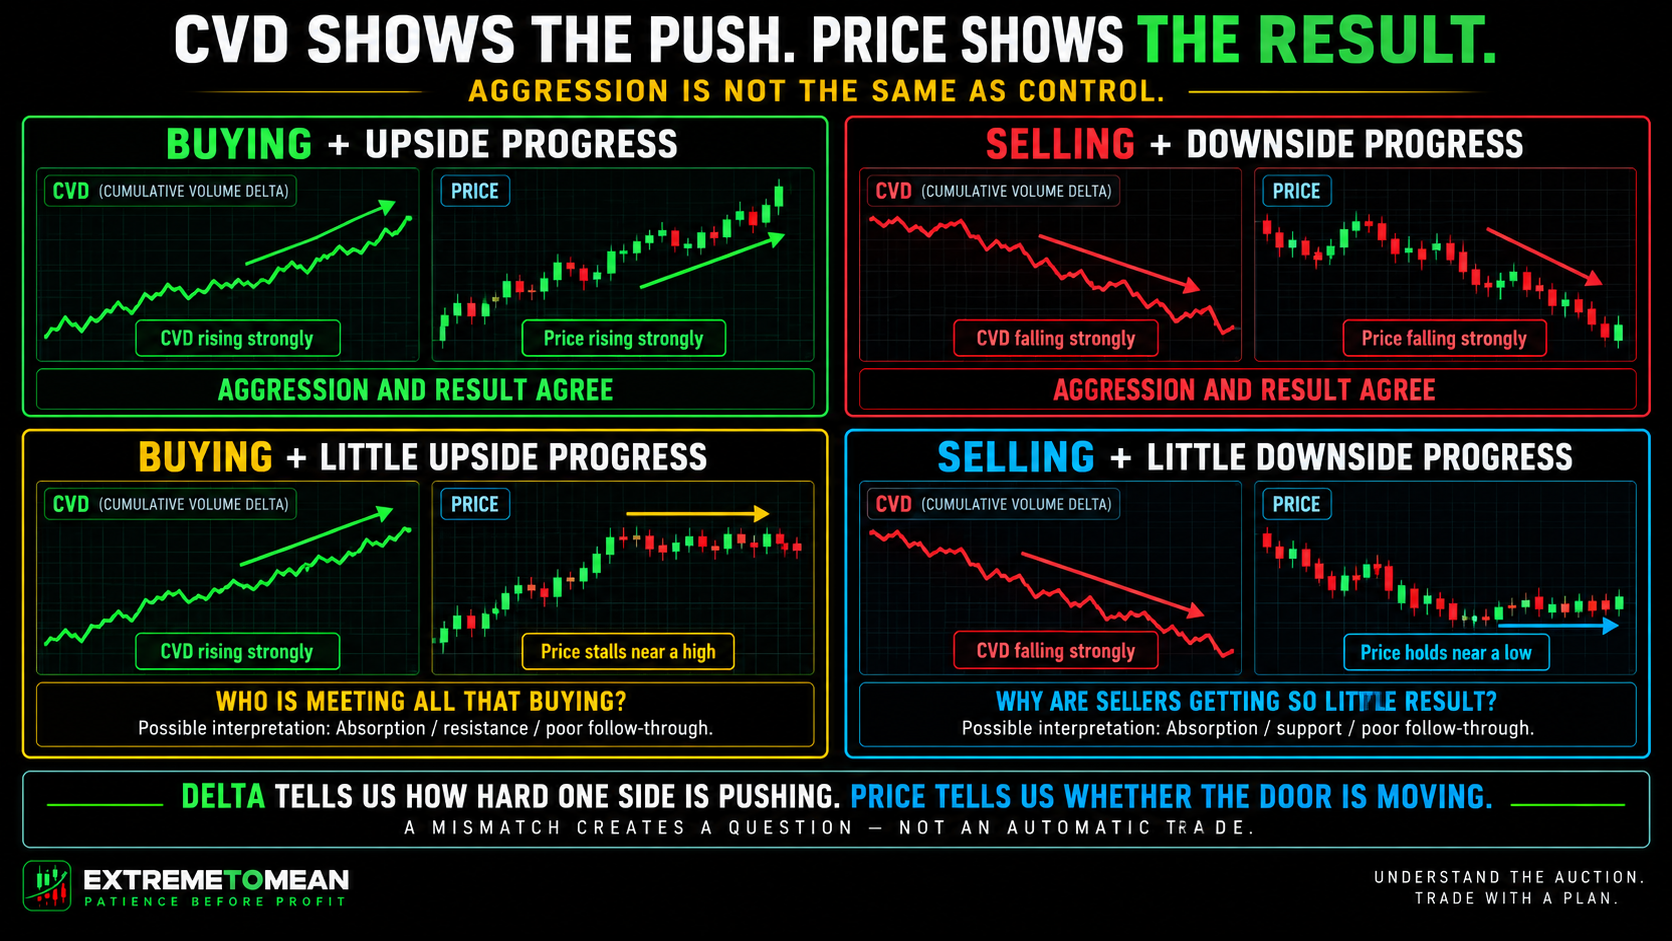
Divergence can also appear without clean higher-high or lower-low geometry. CVD may surge while price barely advances, or CVD may collapse while price refuses to move lower. Those situations can be just as useful because they force the trader to ask why substantial aggression is producing so little price progress.
Aggression vs. Result
Think of delta as effort and price movement as result. If buyers keep lifting offers and price climbs easily, the effort and result broadly agree; if aggressive buying increases but price stops advancing, the relationship has changed. Delta tells us how hard one side is pushing, while price tells us whether the door is actually moving.
That mismatch can have several explanations. Opposing passive liquidity may be absorbing the aggression, the aggressive side may be losing urgency, liquidity may be thin enough that modest flow moves price farther than expected, or other forces may be affecting the market. CVD tells us about aggressive trades in the contract; it does not tell us every reason the contract is moving.
Bearish and Bullish Divergence Are Questions, Not Commands
In bearish divergence, price reaches a new high without comparable CVD confirmation. Buyers may be less aggressive than on the previous push, passive sellers may be meeting the buying, or the divergence may simply be noise inside a market that still accepts higher prices. The better question is, “Price made progress without comparable aggressive-buying confirmation—does price now begin acting like the upside move is failing?”
Bullish divergence reverses the observation. Price makes a lower low while cumulative aggressive selling fails to make a corresponding new extreme, which may mean sellers are becoming less aggressive or are getting less downside progress from their effort. Bullish divergence does not mean buyers have won; it means sellers may no longer be getting the same result from their aggression.
This distinction is what separates order-flow analysis from copying RSI-divergence rules onto CVD. CVD is built from classified traded volume, not from a momentum formula applied directly to price. A higher high in price plus a lower high in CVD is an order-flow question first, not an automatic bearish pattern.
Location Gives Divergence Meaning
A divergence in the middle of random intraday noise may tell us almost nothing. The same disagreement at a prior session high, a meaningful range boundary, after an extended directional move, or around a failed breakout can deserve much more attention. That is why context comes before the candle—and before the indicator pattern too.
A useful workflow therefore starts with a market question before it starts with CVD. Perhaps the question is, “Can buyers actually break and hold above yesterday’s high?” If price pokes above the level, CVD fails to confirm, and price falls back below, the divergence helped answer a question that already mattered instead of manufacturing a trade location from an indicator.
Market Conditions Change the Meaning
A strong trend can carry divergence much farther than a reversal trader expects. Price may keep accepting higher even while CVD fails to make fresh highs because the aggressive flow visible in one contract is not the whole story. Fighting the trend simply because the indicator disagrees can turn useful information into an expensive argument.
In a balanced market, the same observation can have a different value. If price pushes outside a well-defined range, aggressive orders appear, but the auction cannot sustain outside and CVD fails to confirm the extension, the disagreement may support a failed-acceptance thesis. The lesson is consistent with how market conditions change the quality of a setup: the same pattern does not carry the same meaning everywhere.
Price Is Still the Final Arbiter
A bearish divergence does not outrank price. If price continues accepting above resistance, building higher highs, and holding the breakout, the bearish thesis has not earned confidence simply because CVD looks weaker. When price and CVD disagree, do not automatically trust CVD over price; study the disagreement.
Divergence becomes more useful when price begins acting like the divergence matters. That might mean failure to hold a new high or low, rejection from a meaningful area, a reclaim of a broken reference, reduced follow-through, or another observable change that fits the trader’s actual setup. The broader auction-and-liquidity lesson helps explain why aggressive market orders and available resting liquidity can produce very different price responses.
Absorption and Exhaustion Are Possible Explanations
Divergence can be consistent with absorption, but it does not prove absorption. If aggressive buying remains strong while price barely advances, one possible explanation is that passive sellers are providing enough liquidity to meet that demand. Likewise, heavy aggressive selling with little downside progress can be consistent with passive buyers absorbing it.
Exhaustion is different. A new price extreme accompanied by a weaker CVD push may reflect the aggressive side simply becoming less active rather than a large passive participant resisting it. The same divergence can come from the aggressive side pushing less or the passive side resisting more, which is why those mechanisms deserve separate analysis rather than being treated as synonyms.
CVD Depends on the Data You Feed It
CVD does not have to look identical on every platform. Trade classification, data feed, session reset, contract selection, and platform methodology can change the display. A midnight-reset CVD can therefore look different from a regular-session-reset version.
Contract selection matters especially in futures. ES and MES are closely linked in price but have separate executed volume, just as NQ and MNQ do. Rollover can also mislead if price and order-flow data come from different contract months.
A Growing Divergence Is Not a Growing Edge
One of the most dangerous mistakes is adding to a losing reversal because the divergence becomes larger. Price moves farther against the position, CVD looks even more disconnected, and the trader decides the signal is now “stronger.” Unless a tested scaling plan explicitly called for that action before entry, the trader is increasing risk because the market is proving the original interpretation less reliable.
The same rule applies to invalidation. CVD can challenge the price story, but it does not cancel the stop or give the trader permission to rewrite the thesis after entry. A growing divergence is not automatically a growing edge; sometimes it is evidence that the interpretation is wrong.
The ETM Delta-Divergence Filter
Use divergence to answer a market question, not the market to justify a CVD signal. The sequence keeps order flow downstream of context and forces price response to matter before risk is committed.
- Context: What kind of market are we in—trend, balance, extension, reversal attempt, or abnormal post-news conditions?
- Location: Why does this price area matter before we look at CVD?
- Price: What is price actually doing at the location?
- CVD: What is cumulative aggressive order flow doing at the same time?
- Divergence: Where exactly do price and CVD stop confirming one another?
- Interpretation: Could the mismatch reflect weaker aggression, absorption, liquidity conditions, or something else?
- Response: Has price begun behaving as though the divergence matters?
- Qualification: Does the trader’s actual setup now qualify?
- Invalidation: Where is the thesis objectively wrong?
- Risk: Can the trade be expressed without distorting the setup?
The condensed version is Context → Location → Price → CVD → Response → Trade. That order is intentionally different from CVD divergence → find a trade, because the indicator should not be allowed to create a market thesis from nothing. It also reinforces the ETM principle that the market comes first.
Final Thought
Delta divergence is useful because it exposes a mismatch between aggression and result. CVD tells us how aggressive buying and selling have accumulated, while price tells us what that aggression actually accomplished. When the two stop confirming one another, something may be changing in the auction, but the disagreement is not a trade by itself.
The better question is not, “Is this bullish or bearish divergence?” Ask, “Why is this aggression producing this price response, does the location matter, and what does price do next?” That question keeps the trader curious instead of certain and turns CVD into a tool for evaluating an existing market idea.
Put the divergence in context, watch the price response, define where the thesis is wrong, and keep the risk plan intact. Divergence should increase the quality of the question, not the confidence of the prediction. That evidence-first discipline runs through the Extreme to Mean system.
Educational content only. Trading involves substantial risk and is not suitable for everyone.