
What ES and NQ Actually Track
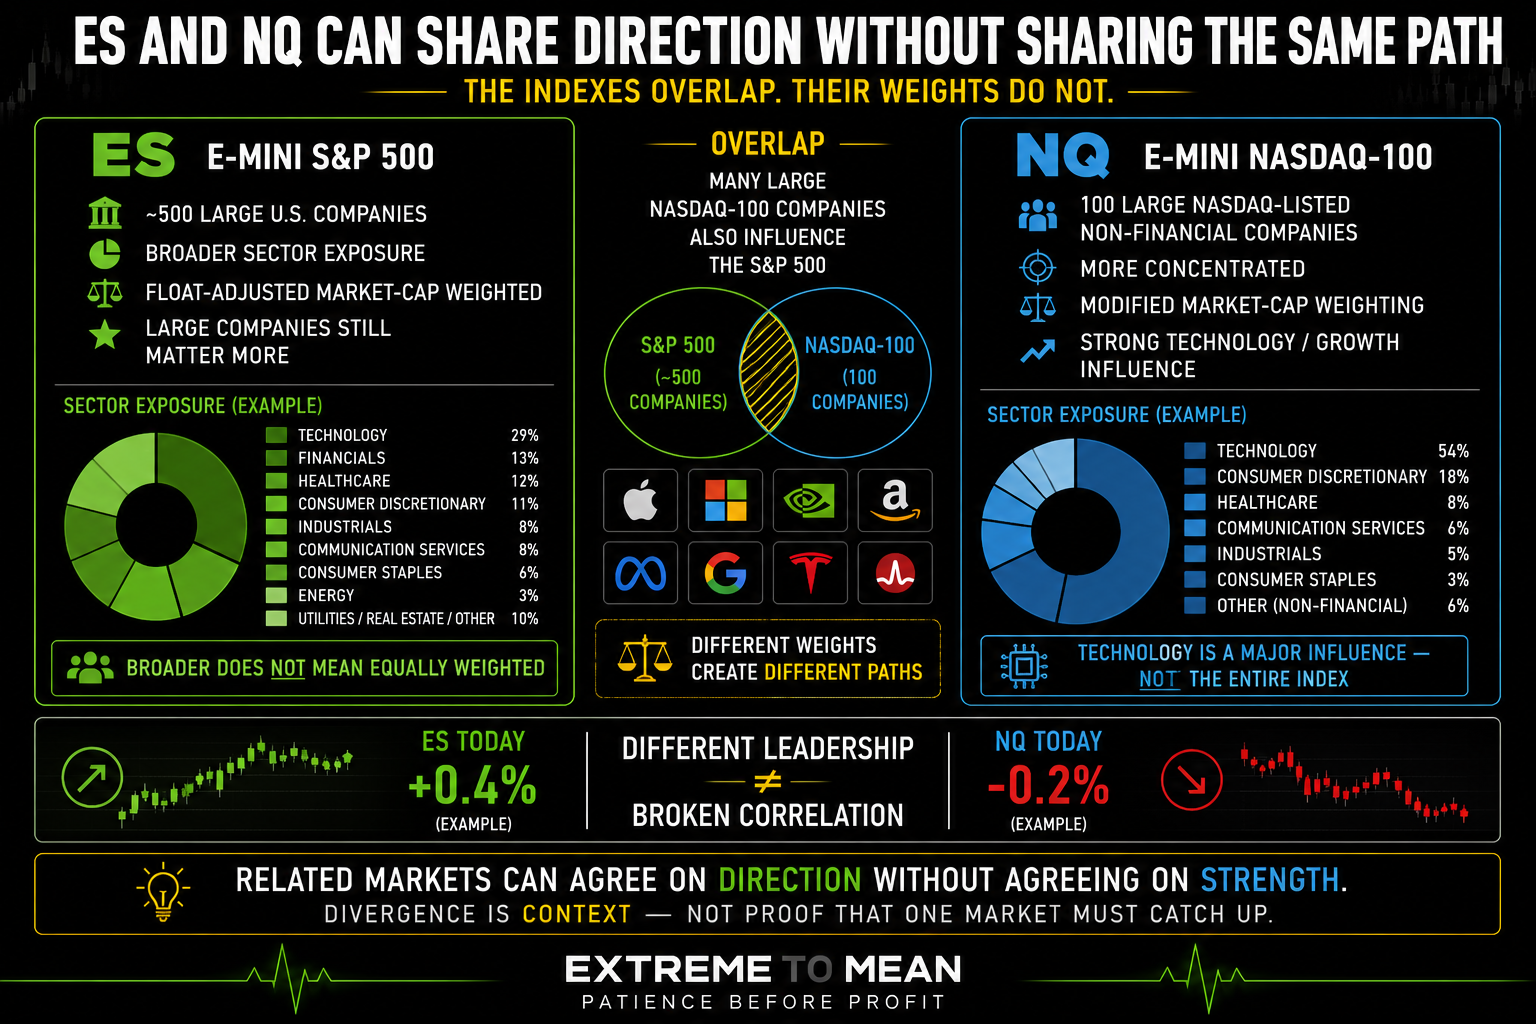
Inside The Basics, ES is the E-mini S&P 500 futures contract, which tracks the S&P 500. The index represents roughly 500 large U.S. companies and uses float-adjusted market-cap weighting, so larger companies influence the index more than smaller constituents. Five hundred stocks does not mean five hundred equal votes.
NQ is the E-mini Nasdaq-100 futures contract, which tracks 100 of the largest non-financial companies listed on Nasdaq. The Nasdaq-100 uses a modified market-cap weighting methodology and has substantial exposure to technology and growth-oriented companies, although it also includes consumer, healthcare, communication, and other non-financial businesses. Technology is a major influence on NQ; it is not the entire index.
Many of the largest Nasdaq-100 companies are also members of the S&P 500, which explains why ES and NQ frequently move together. The key difference is how much influence those shared companies have inside each index and what other sectors surround them. The indexes overlap; their weights do not.
Why ES and NQ Often Move Together—and Why They Sometimes Don’t
Both contracts represent major U.S. equity risk, so broad market events often push them in the same direction. A strong risk-on session may lift both ES and NQ, while a broad selloff can pressure both at once. Related markets can agree on direction without agreeing on strength.
Suppose ES is up 0.4% while NQ is down 0.2%. That disagreement can reflect weakness in technology or growth stocks while financials, industrials, energy, healthcare, or other S&P sectors hold up better. ES/NQ disagreement can tell you something about market leadership without telling you which index must catch up.
The same warning applies when one index confirms a breakout and the other does not. A trader who immediately fades NQ because ES failed to make the same high is assuming convergence has to occur next, but NQ might continue leading, ES might catch up, both might reverse, or both could simply consolidate. Divergence is information about relative behavior—not proof that convergence must happen next.
The Contract Math Is Different
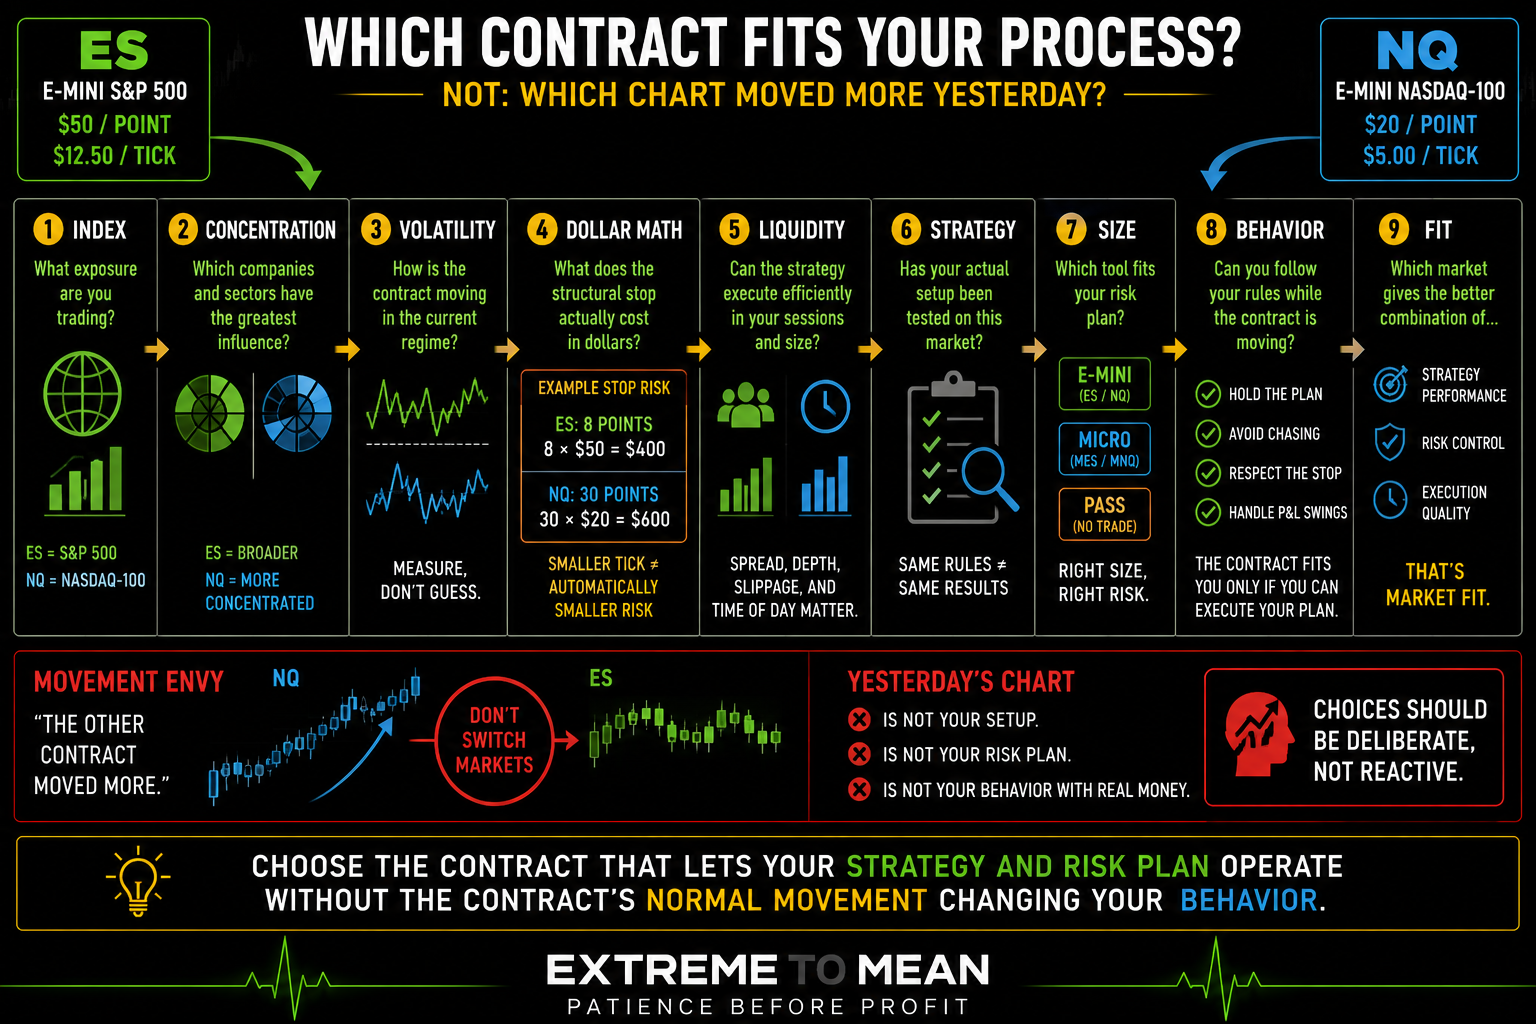
ES and NQ use the same minimum price increment of 0.25 index point, but those quarter-point ticks have different dollar values. One ES point is worth $50, making a 0.25-point tick worth $12.50, while one NQ point is worth $20, making the same 0.25-point tick worth $5.00.
| Feature | ES | NQ |
|---|---|---|
| Underlying | S&P 500 | Nasdaq-100 |
| Contract multiplier | $50 × index | $20 × index |
| Minimum tick | 0.25 point | 0.25 point |
| Tick value | $12.50 | $5.00 |
| One full point | $50 | $20 |
| Micro equivalent | MES | MNQ |
A beginner may look at the smaller NQ tick value and conclude that NQ carries less risk. That comparison ignores how many ticks the market may actually travel and how far a valid structural stop sits from the entry. A smaller dollar value per tick does not make a market smaller if the market travels more ticks.
The broader lesson on ticks, points, and contract value matters here because point movement becomes useful only after it is translated into dollars. Raw contract specifications tell you what one point costs; the actual trade tells you how many of those points your risk plan must tolerate. Contract math and trade risk are related, but they are not the same calculation.
Compare Risk in Dollars, Not Just Points
Imagine a hypothetical ES setup with an entry at 6,500 and structural invalidation at 6,492. The eight-point distance represents $400 of price risk for one ES contract, while two MES contracts at the same eight-point stop would represent $80 before commissions, fees, and execution effects. The stop belongs to the structure; the contract determines what that structure costs.
Now imagine an NQ setup at 24,000 with invalidation at 23,970. The 30-point structural distance represents $600 of price risk for one NQ, while two MNQ contracts would represent $120 over the same 30 points. Different point distances can therefore create comparable—or very different—dollar exposure depending on the contract and quantity.
Those examples are not recommended stops for either market. A real stop still depends on the setup, timeframe, structure, location, and volatility rather than a permanent “ES uses eight points, NQ uses thirty” rule. Compare risk in dollars—not just points.
Notional exposure requires the same care. Contract multiplier alone does not tell you which contract represents more exposure because notional value is approximately index level × multiplier; at hypothetical prices of 6,500 ES and 24,000 NQ, that would be about $325,000 for one ES versus $480,000 for one NQ. Multiplier alone does not tell you contract size; multiply it by the index level.
Compare Volatility Instead of Repeating the Stereotype
Traders often describe NQ as “faster,” but that word needs a definition. It might refer to larger average bar ranges, wider intraday rotations, higher normalized volatility, faster rate of change, or simply the trader’s emotional experience while watching the contract. If you call a market faster, define what faster means.
Raw point movement is not enough. If NQ moves 100 points while ES moves 30, that does not prove NQ moved more on a normalized basis because the two indexes trade at different price levels and use different contract multipliers. Percentage change, ATR percentage, realized volatility, and strategy-specific dollar risk are more useful comparisons.
This is where ATR can help measure the volatility environment. Instead of saying “NQ always moves more,” compare each contract over the same timeframe, lookback, and volatility metric, then observe how the relationship changes across market regimes. Measure the difference instead of repeating the stereotype.
The same discipline should be applied to claims that ES is “cleaner.” Cleaner might mean smaller rotations, deeper visible liquidity, less emotional pressure, fewer sudden extensions, or simply greater familiarity with the contract. “Cleaner” often tells you as much about the trader as it does about the market.
The Contract Does Not Own a Market State
NQ can trend aggressively, reverse sharply, consolidate, chop, or mean revert. ES can do all of those things too, which means neither contract permanently owns one trading environment. The three market states still have to be evaluated in the market that exists today.
This is why claims such as “NQ trends better” or “ES is better for mean reversion” are too broad to be useful. A strategy depends on location, extension, momentum, volatility, structure, available room, and the current market state rather than the ticker alone. Choose the contract after understanding the strategy—not the strategy after choosing a favorite contract.
Sector concentration can still make the contracts react differently to the same catalyst. Large technology or growth-company earnings may influence NQ more strongly, while strength elsewhere in the S&P 500 can help ES hold up even when NQ is lagging. A shared macro event does not require identical index behavior.
Interest rates provide another example. Growth-oriented equities can be sensitive to changing discount rates, so NQ may sometimes respond strongly when Treasury yields move, but the relationship is not a permanent inverse rule. Why yields moved, earnings expectations, inflation, growth, positioning, and the broader regime still matter.
Liquidity and Session Conditions Still Matter
ES and NQ are both heavily traded benchmark futures contracts. That does not mean their spreads, depth, slippage, or execution conditions remain identical throughout every session. Liquidity changes with time of day, volatility, news, order size, and the number of participants currently active.
A trader executing one Micro contract has a different liquidity requirement from someone moving hundreds of E-mini contracts. Daily volume alone therefore does not settle the ES-versus-NQ question; spread, depth, resiliency, fill quality, and expected slippage also matter. Liquidity is part of market fit, not a permanent ranking stamped onto the ticker.
Session matters as well. A contract can behave very differently around the U.S. cash open than it does overnight or during a quiet midday period, so one dramatic hour should not become the permanent personality assigned to the market. The participants currently trading the contract help shape the behavior the trader experiences.
The Psychological Difference May Matter More Than the Specification Sheet
Two trades can carry the same planned dollar risk and still create very different emotional experiences. A position that moves from +$180 to +$60, then +$230, then back to +$90 in a short span may pressure the trader to move stops, take profit early, chase re-entries, or abandon the original target. A contract fits you only if you can still follow your rules while trading it.
This is where movement envy becomes expensive. A trader watching ES may see NQ rally 150 points and conclude that they chose the wrong market, then switch contracts the next session only to discover that the pullbacks and P&L swings feel very different with money at risk. The move you watched from the sidelines is not the same move you would have managed with money at risk.
Switching repeatedly based on yesterday’s chart is performance chasing at the instrument level. The trader never builds familiarity with one market long enough to evaluate the strategy properly and keeps adapting to whichever contract recently looked better. Market selection should be deliberate rather than reactive.
Test the Strategy on Both Markets
A setup tested on ES is not automatically validated on NQ simply because the pattern looks similar. Different volatility, range, execution, concentration, structural stop distances, and price behavior can change the distribution of outcomes. Same setup rules do not guarantee the same strategy statistics across different markets.
A more useful comparison looks across a meaningful sample. Examine win rate, average winner, average loser, expectancy, drawdown, average stop distance, MAE/MFE, slippage, trade frequency, time in trade, and behavior across different volatility regimes. Market fit should be measured across a sample—not remembered from the biggest move.
This also prevents gross movement from becoming the only criterion. NQ may offer more raw movement during a particular period while producing worse execution discipline for one trader, while another strategy may genuinely benefit from its larger directional rotations. The market that travels farther is not automatically the market that fits the process better.
Sometimes neither E-mini fits the risk plan. If the structural stop implies $600 of ES risk or $700 of NQ risk while the trader’s permitted risk is $100, the solution is not to declare one E-mini “safer.” Sometimes the correct ES-versus-NQ decision is neither E-mini, which is where MES, MNQ, or simply passing on the trade become relevant.
A Practical ES-vs-NQ Decision Framework
Use Index → Concentration → Volatility → Dollar Math → Liquidity → Strategy → Size → Behavior → Fit. The framework forces the trader to compare the markets through the actual process rather than through whichever chart had the largest move yesterday.
- Index: What market exposure am I actually trading?
- Concentration: Which companies and sectors have the greatest influence?
- Volatility: How is the contract moving in the current regime?
- Dollar Math: What do the structural stop and target mean in dollars?
- Liquidity: Can the strategy execute efficiently during the session I trade?
- Strategy: Has my actual setup been tested separately on this market?
- Size: Does the E-mini fit, should I use the Micro, or should I pass?
- Behavior: Can I still follow my rules while the contract is moving?
- Fit: Which market gives the better combination of strategy performance, risk control, and execution quality?
The better question is not “Which is better, ES or NQ?” Ask, “Which contract lets my strategy and risk plan operate without the contract’s normal movement changing my behavior?” That question turns the comparison away from excitement and back toward process.
Cross-market information can still contribute to context. ES and NQ confirming one another may show broader participation, while disagreement may highlight concentration or sector leadership, but neither should replace the actual setup. Cross-market confirmation can strengthen context without replacing the trade.
Final Thought
ES and NQ are related markets, but they are not interchangeable. ES represents a broader 500-company large-cap benchmark, while NQ represents a more concentrated 100-company non-financial Nasdaq index, and those different weights can produce different responses even when the broad market direction is the same.
Contract specifications matter, but they do not settle the decision by themselves. Tick value, stop distance, volatility, notional exposure, liquidity, and position size all have to be considered together. A smaller tick value does not automatically mean lower risk, and a market covering more points does not automatically create a better trading opportunity.
The final test is whether the market fits the actual trader and strategy. Choose the contract you can trade well—not the contract you most enjoy watching—and measure that fit across enough trades to separate evidence from one memorable session. That process-first approach is part of the broader market-reading discipline developed throughout Decode the Market.
Educational content only. Trading involves substantial risk and is not suitable for everyone.