
A trading result can be completely real and still support a conclusion that is much stronger than the evidence allows.
A result can be real without the conclusion drawn from it being justified.
When traders see a perfect screenshot, a 100% win-rate bot, or a backtest with thousands of trades, the instinct is often to decide whether the claim is real or fake. That is usually the wrong first question. A better question is: What does this evidence actually prove—and what does it not prove?
This belongs inside The Trader because evaluating evidence is part of trading decision quality. A trader who cannot distinguish a genuine result from a representative track record is vulnerable to both excessive skepticism and excessive belief. Better evidence can increase confidence, but it never turns uncertainty into certainty.
Start by Classifying the Result
Before reading the headline number, identify what kind of number it is. ACTUAL means trades were genuinely executed; SIMULATED means orders were modeled without real capital at risk; BACKTESTED means rules were applied retrospectively to historical data. Those categories can all contain useful information, but they support different conclusions.
A backtest may be good evidence that a defined rule behaved a certain way historically. It is much weaker evidence that a trader can reproduce the same performance live under real costs, slippage, pressure, and changing conditions. Evidence has to match the claim.
A Screenshot Is a Snapshot, Not a Distribution
Suppose someone posts a brokerage screenshot showing +$4,800 for the day. The image may be authentic, but it does not tell you what happened yesterday, what the account started with, how much risk was taken, what the current drawdown is, or whether the day was typical. REAL RESULT ≠ REPRESENTATIVE RESULT.
That distinction matters because selection can mislead without fabrication. A trader can post the best day of the year and accurately show exactly what happened while still creating an impression that the result is normal. A screenshot can tell you what happened at one moment; an edge is a claim about what happens across many moments.
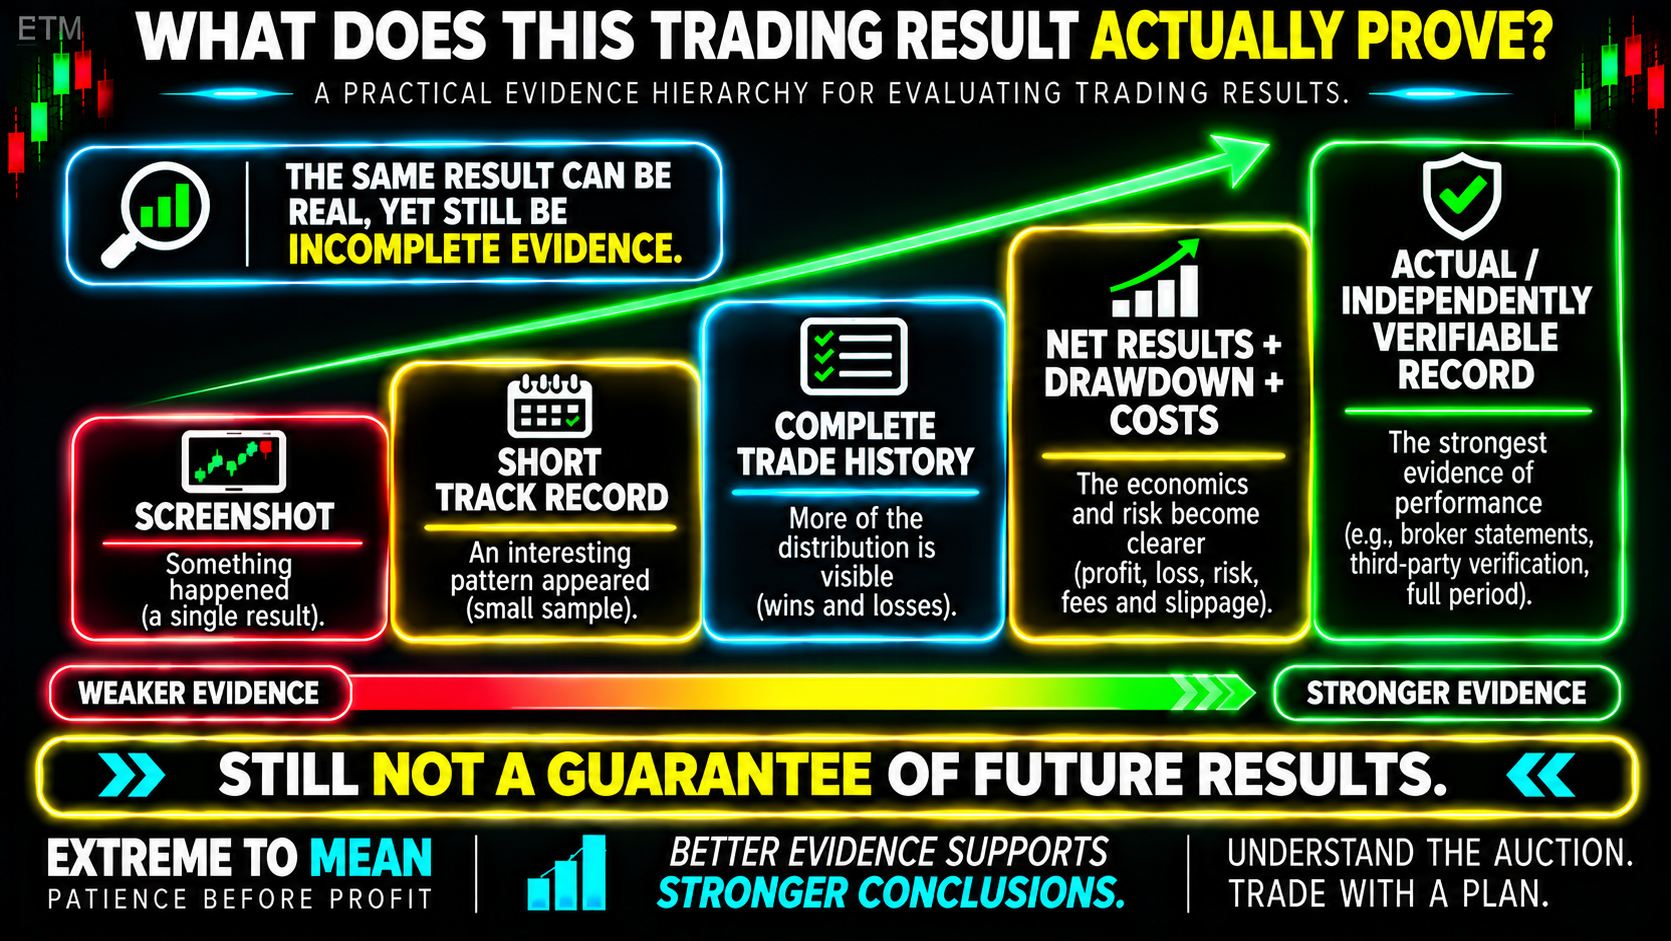
When someone chooses which slice of the record you see, ask what happened in the part you were not shown. The denominator matters too: $20,000 profit out of what capital, 12 winners out of how many trades, and 20 profitable students out of how many students? Performance without the denominator, time period, and risk context is incomplete performance.
What a “100% Win Rate” Actually Means
Imagine a bot showing 14 trades, 14 wins, and a headline that says 100% WIN RATE. The observed statement may be accurate: the bot won every closed trade in that sample. The unsupported leap is turning 100% observed into 100% expected.
Short winning streaks can occur even when the true long-run win probability is lower. As a purely illustrative example, if independent trades had a 60% chance of winning, five consecutive wins would occur about 7.8% of the time and ten consecutive wins about 0.6% of the time. Across many traders, systems, and time windows, unusual streaks will appear somewhere.
The more impressive the win rate, the more important it becomes to ask what happens when the strategy finally loses. Closed-trade statistics can also hide open losses if a system realizes winners quickly while allowing losers to remain open. A closed-trade win rate can look perfect while the account itself is losing money.
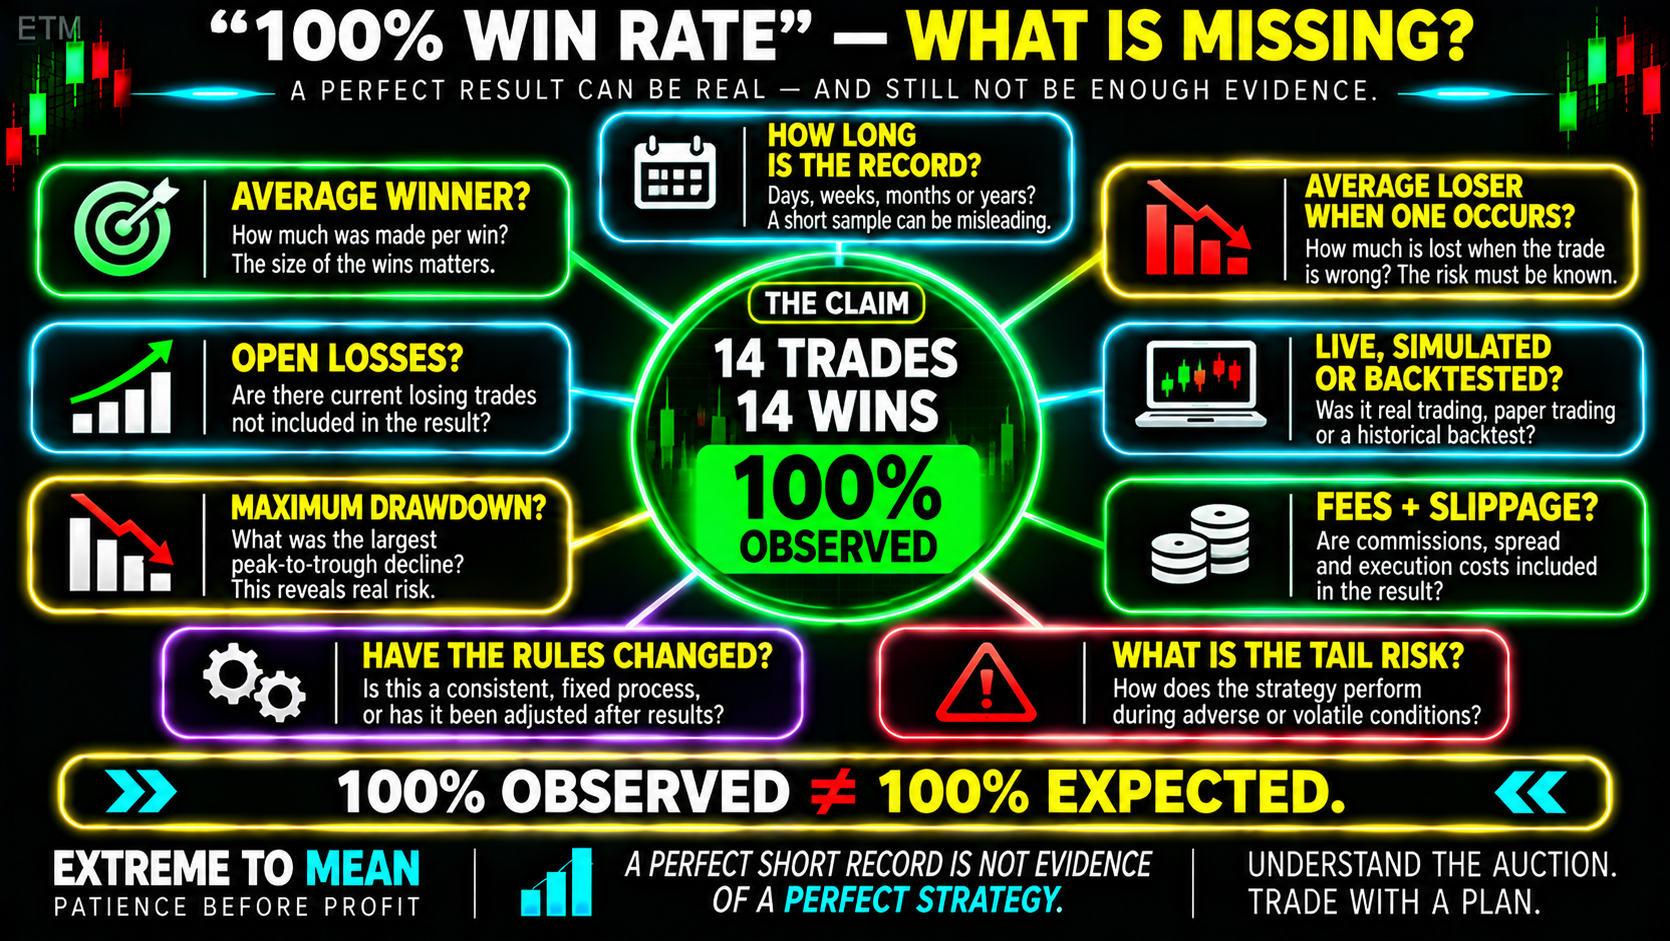
High win rates can also come from strategies that accept many small gains while carrying occasional large losses. That does not mean every high-win-rate system is structurally dangerous, but it does mean win rate cannot be interpreted alone. WIN RATE ≠ EXPECTANCY.
For example, 90% winners averaging +$10 and 10% losers averaging −$150 produces negative economics despite the impressive win rate. Conversely, a strategy winning only 40% of the time can have positive expectancy if average winners are sufficiently larger than average losers. What an edge actually is depends on the whole payoff distribution, not the most flattering statistic.
Large Samples Deserve Attention—Not Automatic Trust
Now consider 7,137 trades, a 63.6% win rate, and profit factor 1.84. That is materially more information than 14 wins in two weeks, but the next question is still: How were those numbers produced? Profit factor summarizes historical gross profits relative to gross losses; it does not prove that fills were realistic, costs were included correctly, parameters were not overfit, or performance will persist.
A large sample reduces some forms of sampling uncertainty, but it cannot repair a biased model. If the backtest contains look-ahead bias, unrealistic executions, omitted fees, regime concentration, or parameters selected after testing thousands of alternatives, more trades can make the result look more convincing without making the assumptions better. LARGE SAMPLE ≠ VALID MODEL.
The stronger questions are whether the rules were defined consistently, unseen out-of-sample data was reserved, costs were realistic, and performance survived different environments. The more frequently a strategy trades, the more often friction affects the result. Historical length is also not the same as time survived after the strategy was created.
Hindsight Charts: Prediction and Explanation Are Different Records
A chart posted after the close can show a beautiful reversal level, perfect support, and an apparently obvious target. That analysis may be insightful, but unless the plan was timestamped before the move, it does not independently establish that the trade decision existed beforehand. EX POST EXPLANATION ≠ EX ANTE PREDICTION.
Ex ante means before the outcome; ex post means after it. A premarket statement such as “If price reaches X, rejects, and holds below Y, I will look for Z” has different evidentiary value from a post-market chart saying “X was obviously the level.” Hindsight can make uncertainty look like inevitability.
Calling the level is also not the same thing as defining and executing the trade. You still need the entry condition, invalidation, stop logic, target, sizing, and whether the trade was actually taken. A correct directional forecast can coexist with a losing trade if execution and risk management were poor.
This is why a trading plan made before the session has evidentiary value beyond organization. It creates a record of what the trader believed before the market supplied the answer. Prediction accuracy and trading profitability are different records.
Selection Bias Can Be More Important Than Fabrication
A public feed can become misleading without anyone fabricating a screenshot. People naturally post winners, forget boring forecasts, emphasize spectacular levels, and stop discussing ideas that failed. The visible sample can therefore become systematically more flattering than the full decision history.
Ask how many other calls were made, whether misses remain visible, whether messages can be edited, and whether yesterday's history can be rewritten today. SCREENSHOT ≠ TRACK RECORD. A complete, immutable record is stronger because it limits retrospective selection.
Timestamped entries, exits, stops, targets, visible edits, open losses, and losing calls make reconstruction easier. That is also why protecting your next decision includes protecting yourself from narratives built after the result is already known. You do not need fabricated results to create a misleading sample; selective visibility can do it.
Independent Verification Is Stronger Evidence, Not Future Certainty
Independent verification can improve confidence, but “verified” still needs a definition. Ask who verified the results, what source data was used, whether the full account and period were reviewed, and whether the verifier depended on the seller to select the trades. VERIFIED AUTHENTICITY ≠ GUARANTEED FUTURE PERFORMANCE.
A genuine broker statement can establish that real trades occurred while leaving questions about starting capital, deposits, withdrawals, leverage, other accounts, and representativeness. Verification can establish authenticity without establishing typical performance. Historical truth and future expectation remain different questions.
The Trading-Results Evidence Checklist
When somebody shows impressive trading results, ask:
- Is this actual, simulated, or backtested?
- What exact claim is being made from the result?
- How many trades and how much time does the record cover?
- Is this the complete record or a selected slice?
- Are open losses and mark-to-market equity included?
- What are the win rate, average winner, and average loser?
- What was the maximum drawdown?
- Are results net of realistic fees, spread, and slippage?
- How much capital and leverage produced the result?
- If it is a backtest, was it tested out of sample?
- If it is a public forecast, was it timestamped before the move?
- Can the record be independently verified or reconstructed?
The checklist prevents two opposite mistakes: believing an impressive result too quickly and dismissing it simply because it looks unusually good. The cure for an unbelievable result is not disbelief; it is more complete evidence. The better question is: What additional information would have to be true before this result supported the conclusion being advertised?
The ETM Classify → Complete → Contextualize → Challenge → Verify Framework
Use CLASSIFY → COMPLETE → CONTEXTUALIZE → CHALLENGE → VERIFY. CLASSIFY asks whether the record is actual, simulated, or backtested; COMPLETE asks whether the full history is visible; CONTEXTUALIZE adds sample size, time, capital, costs, payoff, drawdown, and open equity. CHALLENGE asks what alternative explanation could produce the impressive number, and VERIFY asks what independent evidence can support the claim.
Then use evidence labels rather than accusations: SUPPORTED, PROMISING, INCOMPLETE, or UNVERIFIED. “Unverified” describes the evidence; it is not an accusation about the person. The ETM free tools can help organize review, but the discipline is matching the strength of the conclusion to the strength of the record.
Final Thought
When someone shows impressive trading results, neither immediate belief nor immediate disbelief is a strong analytical process. Start by classifying the record, then determine whether it is complete, representative, net of costs, exposed to real risk, and supported by enough time and trades to justify the claim being made.
A perfect two-week bot record can be genuine without implying a perfect future win rate. A 7,000-trade backtest can deserve serious attention without proving the model is robust, and a chart posted after the close can be excellent explanation without proving prior prediction. A genuine result can still support an exaggerated conclusion.
Judge the evidence before judging the person behind it. Incomplete evidence is not proof of dishonesty, and strong verification is not a guarantee of future performance. The useful question is simpler: What does this evidence actually allow me to conclude?
Educational content only. Trading involves substantial risk and is not suitable for everyone.