
Profit Factor is useful because it compresses the gross profits and gross losses from a group of trades into one understandable ratio. That can make it easier to compare historical performance, but it cannot tell you by itself whether the result is reliable, repeatable, emotionally tolerable, or likely to survive another market regime. Inside The Trader, the number should be treated as part of a review process rather than a final verdict on whether a strategy works.
What Profit Factor Actually Measures
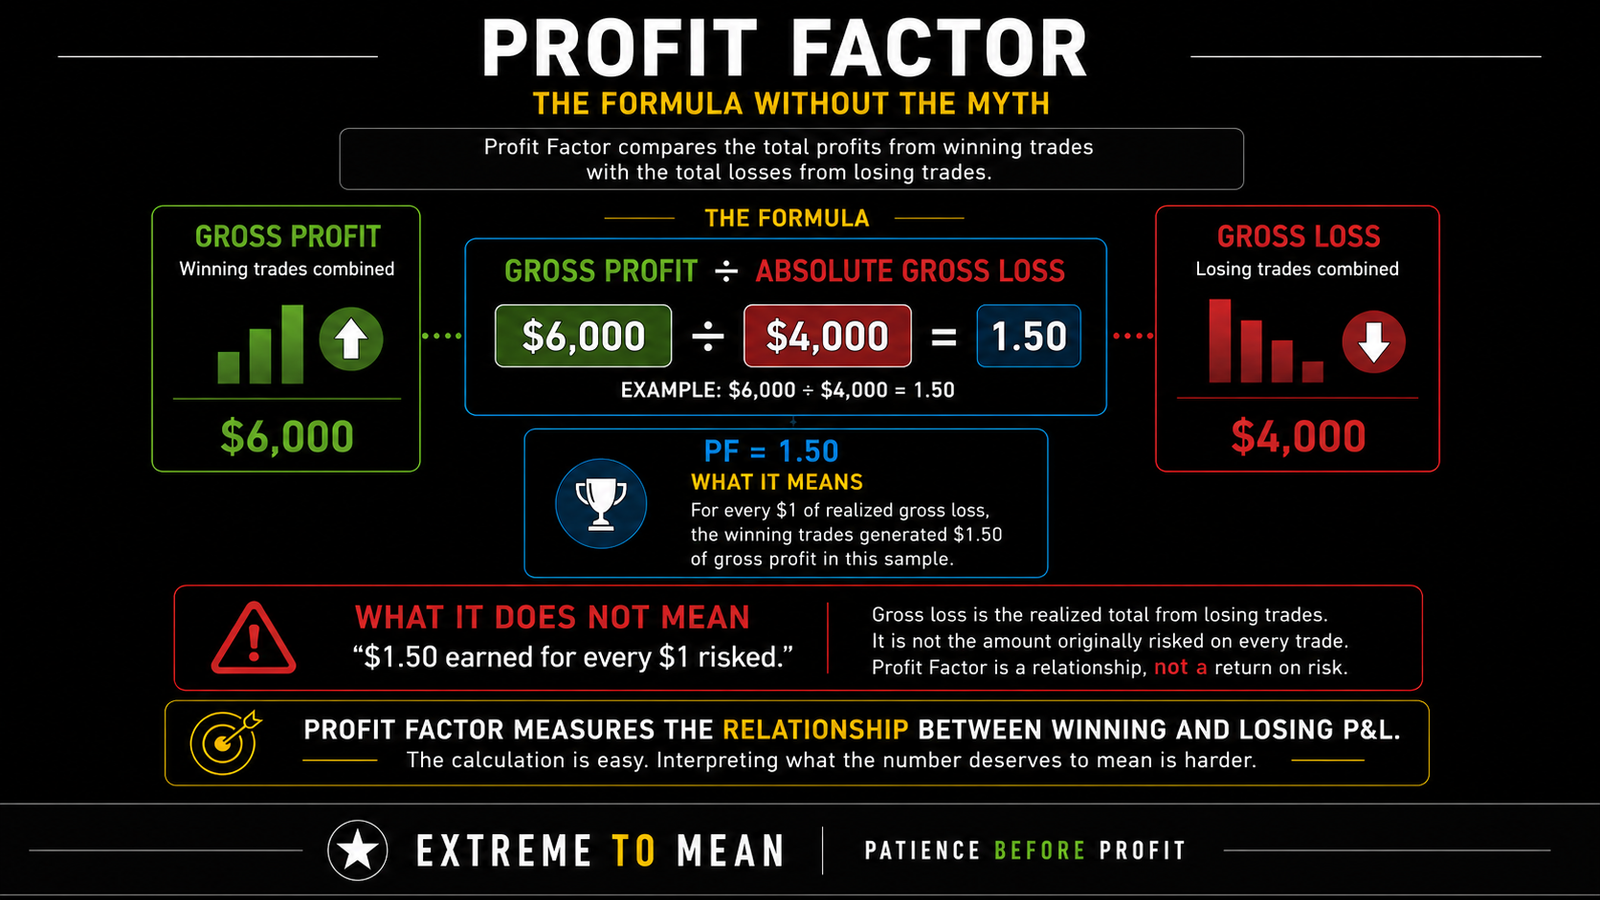
Profit Factor compares the total profits generated by winning trades with the total losses generated by losing trades. The basic formula is:
Profit Factor = Gross Profit ÷ Absolute Gross Loss
Suppose a strategy produces $6,000 in gross profit from its winning trades and $4,000 in gross losses from its losing trades. The Profit Factor is 6,000 ÷ 4,000 = 1.50. In plain English, the winning trades generated $1.50 of gross profit for every $1 of realized gross loss in that sample.
That wording matters. Profit Factor does not mean the strategy made $1.50 for every $1 it risked because gross loss is the realized total from losing trades, not the amount originally placed at risk on every trade. Profit Factor describes the relationship between aggregate winners and aggregate losers.
What a Profit Factor of 1.0 Means
If gross profit equals gross loss, Profit Factor equals 1.0. For example, $5,000 of gross profit divided by $5,000 of gross loss produces a Profit Factor of 1.0, meaning the winning and losing trade results offset each other within that calculation. A value above 1.0 means aggregate winners exceeded aggregate losers in that sample.
That is useful information, but it should not immediately become “Profit Factor above 1 means the strategy has an edge.” Execution costs, slippage, commissions, sample size, and the underlying distribution still matter. A Profit Factor above 1 tells you what happened in the sample; it does not prove why it happened or whether it will continue.
This distinction connects naturally with what an edge actually is. A historical ratio can contribute evidence that a process has behaved favorably, but one metric cannot establish durability by itself. The trader still has to investigate how the result was produced.
Profit Factor Is Not Net Profit
Two strategies can have identical Profit Factors and very different dollar results. Imagine Strategy A produces $20,000 of gross profit and $10,000 of gross loss, while Strategy B produces $2,000 of gross profit and $1,000 of gross loss. Both have a Profit Factor of 2.0.
Strategy A produced $10,000 more gross winning P&L than gross losing P&L, while Strategy B produced only $1,000 more. The ratio is the same because the relationship between winners and losers is proportional. Profit Factor measures a relationship, not the scale of the result.
That is why Profit Factor should sit beside other performance information rather than replace it. Dollar return, number of trades, capital used, exposure, and time can all differ even when the headline ratio looks identical. One number cannot preserve every dimension of the strategy.
Profit Factor Is Not Win Rate
Win rate tells you how often trades won. Profit Factor helps describe how the dollars from those winners compared with the dollars from the losers. Those are related questions, but they are not interchangeable.
Consider a strategy that wins eight of ten trades, with an average winner of $100 and an average loser of $500. Eight winners produce $800 of gross profit, while two losers produce $1,000 of gross loss, creating a Profit Factor of 0.80. The strategy won 80% of its trades and still lost money across the sample.
Now consider a strategy that wins four of ten trades, with an average winner of $400 and an average loser of $150. Four winners produce $1,600, while six losers produce $900 of gross loss, creating a Profit Factor of about 1.78. The strategy won only 40% of the time, yet the winning dollars outweighed the losing dollars.
The lesson is not that low win rate is better. It is that how often you win is only part of the economics of a strategy. Profit Factor is influenced jointly by win frequency and the size of the wins and losses.
The Same Profit Factor Can Hide Very Different Strategies
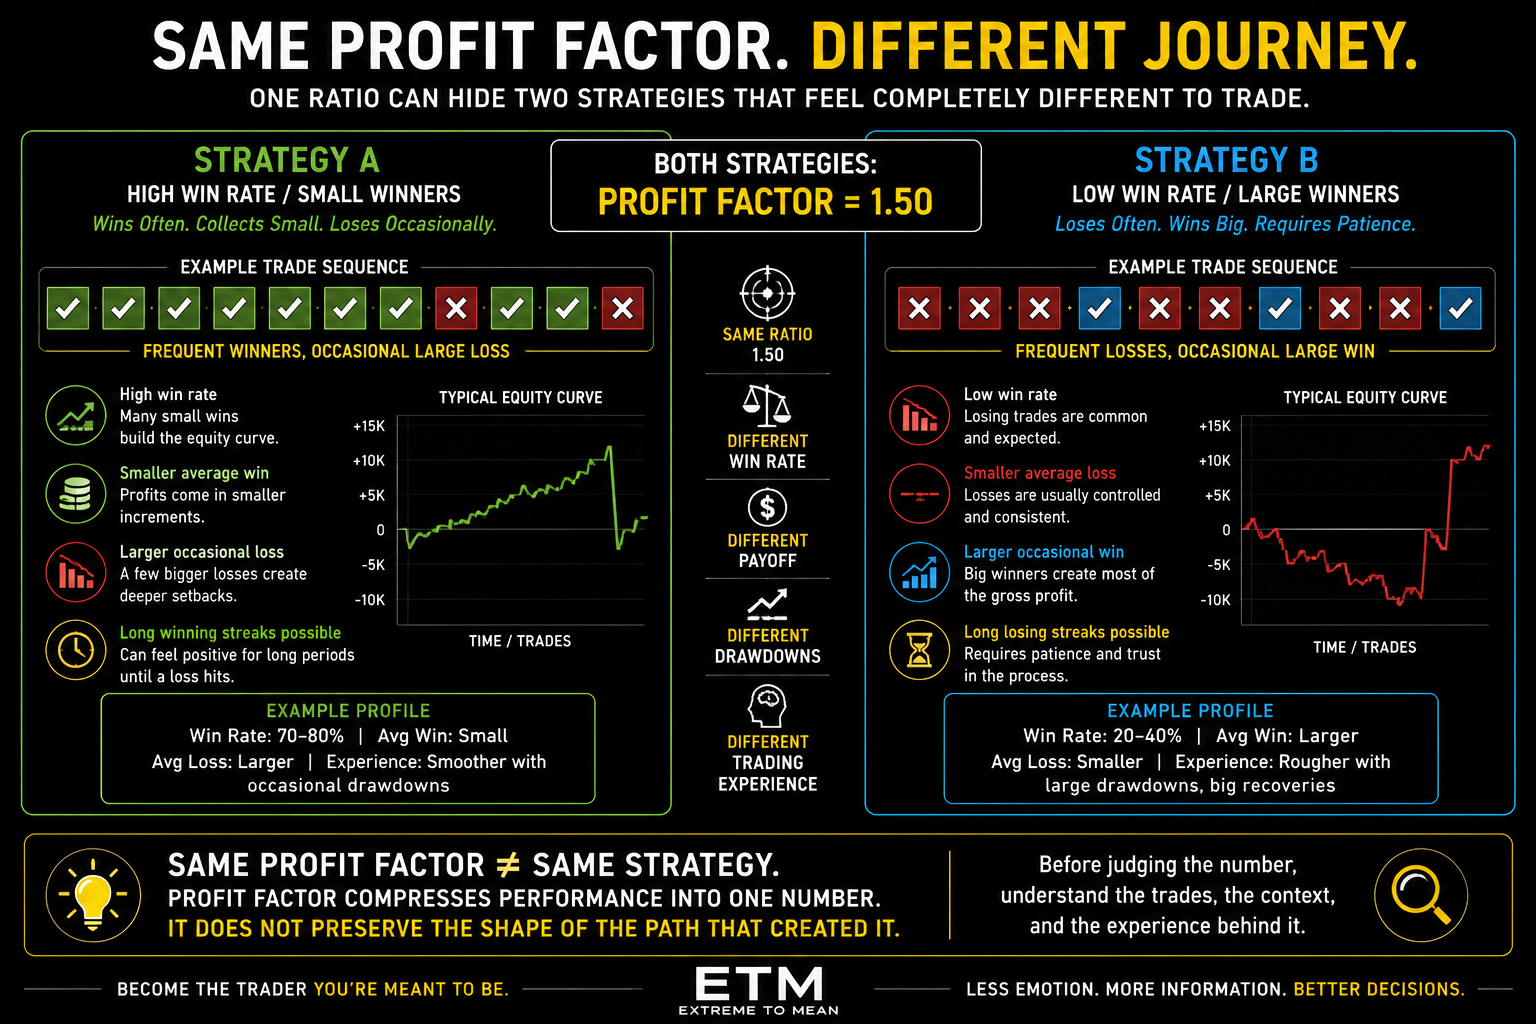
Imagine two strategies that both produce a Profit Factor of 1.50. One wins frequently, collects relatively small profits, and occasionally takes a large loss, while the other loses frequently but occasionally captures a much larger winner. The final ratio can be identical even though trading the two strategies would feel completely different.
One trader may experience long stretches of positive results interrupted by abrupt setbacks. Another may sit through repeated small losses waiting for less frequent but larger winning trades. Profit Factor compresses the result into one ratio; it does not preserve the shape of the journey that created it.
This is why a strategy should be judged as a process rather than by the attractiveness of one output field. A consistent trading plan also matters because changing rules from trade to trade changes the population of results being evaluated. The metric becomes more meaningful when the underlying decisions belong to the same defined process.
Sample Size Changes How Much the Ratio Deserves Your Trust
A Profit Factor of 3.0 across six trades and a Profit Factor of 1.6 across 600 trades should not automatically be treated as equivalent evidence. Six trades can be dominated by a few unusual outcomes, while hundreds of trades provide a much larger body of observed decisions. That does not automatically make the lower ratio better, but it changes how confidently the result can be interpreted.
The right response is also not to invent another universal rule such as “100 trades proves the system.” Sample adequacy depends on strategy frequency, outcome variability, holding period, the number of independent opportunities, and whether the test covered different market conditions. A Profit Factor without sample size is incomplete information.
A useful review question is: How many decisions are hiding behind the ratio? The smaller the sample, the more carefully the trader should investigate whether a few trades are doing most of the work. Precision in the displayed number does not create precision in the underlying evidence.
One Large Winner Can Distort the Headline
Suppose 50 trades produce $8,000 in gross profit and $5,000 in gross loss, creating a Profit Factor of 1.60. Now imagine one winning trade contributed $4,500 of that gross profit. The ratio is mathematically correct, but the strategy’s performance is heavily concentrated in one outcome.
That does not mean the large winner should automatically be deleted. A trend-following process, for example, might be designed specifically to tolerate many small losses in exchange for occasionally capturing a large move. Removing the winner simply because it looks unusual could remove the exact behavior the strategy is supposed to produce.
The better process is to investigate concentration. Was the trade generated by the actual rules, was the fill realistic, could an outcome like that reasonably occur again, and does the strategy structurally depend on occasional outliers? Investigate unusual trades; do not automatically erase them.
Costs and Platform Methodology Matter
A backtest that ignores commissions, fees, slippage, spreads, or unrealistic execution assumptions can materially overstate Profit Factor. This becomes especially important for strategies with high trade frequency or very small average trade values. A ratio that looks attractive before realistic costs may look very different after execution is modeled properly.
The word gross can also create confusion. Gross Profit inside a platform report does not necessarily mean that all fees and execution assumptions have been excluded because software packages can incorporate commissions or specified slippage into reported trade results. The trader should understand how the specific platform constructs the metric before comparing it with another report.
Open trades can create another methodology difference. Some software calculates Profit Factor from realized closed trades only, while other reporting conventions may differ. Before treating two Profit Factors as comparable, make sure the underlying accounting rules are comparable too.
There Is No Universal “Good Profit Factor”
Search for a good Profit Factor and you will find tables claiming that 1.2 is acceptable, 1.5 is good, 2.0 is excellent, or extremely high values are suspicious. Those benchmarks can be personal heuristics, but they are not market laws. A Profit Factor of 1.49 does not suddenly become a bad strategy because someone placed the “good” category at 1.50.
A more useful interpretation depends on trade count, costs, drawdown, strategy frequency, variability, market regime, robustness, and realistic execution. A Profit Factor of 1.3 produced across a large, diverse, realistically modeled sample may be more interesting than a Profit Factor of 4.0 produced by twelve heavily optimized trades. The headline number cannot answer that comparison on its own.
Very high Profit Factors should not automatically be punished either. They can occur legitimately, but they deserve questions about tiny samples, cherry-picked dates, missing costs, look-ahead bias, overoptimization, or one enormous outlier. Do not reward or reject the number first; investigate what created it.
Profit Factor Does Not Show Drawdown or Trade Sequence
Two strategies can have the same Profit Factor and radically different maximum drawdowns, losing streaks, recovery times, and volatility of results. Profit Factor only sees the aggregate winning and losing dollars. It does not know whether the journey between those totals was smooth or brutal.
Trade sequence makes the limitation even clearer. One set of 100 trades might alternate between wins and losses, while another contains 15 losses in a row before the winners arrive. If the final dollar totals are identical, Profit Factor can also be identical.
Profit Factor can tell you that the winners outweighed the losers without telling you how painful the path between them was. That matters because drawdown and losing-streak behavior affect capital requirements and whether a process can realistically be followed. The ratio is useful precisely because it is simple, but simplicity means information has been discarded.
Market Regime Can Hide Inside the Lifetime Number
A strategy can perform differently in trending, rotational, and high-volatility environments. One lifetime Profit Factor can average all of those conditions together and hide the fact that the process performs well in one environment and poorly in another. That can be strategically more useful than knowing the lifetime number alone.
This connects to the three market states. If the same setup behaves differently across different market environments, segmenting performance can help test a specific hypothesis about where the process works best. The purpose is to understand the strategy, not to keep slicing the data until something attractive appears.
Segmentation can examine long versus short trades, instruments, time periods, or market conditions, but every additional slice increases the opportunity to discover noise by accident. Start with a reason for the comparison. Do not use segmentation as a search for a flattering number.
Backtest Profit Factor and Live Profit Factor Can Diverge
Backtest Profit Factor tells you what relationship between gross winners and gross losers occurred under the assumptions used in the historical test. Live Profit Factor tells you what has actually happened in executed trades so far. Those numbers can diverge because fills, slippage, missed trades, rule deviations, execution mistakes, and market conditions differ.
A lower live Profit Factor does not automatically mean the strategy stopped working. It creates an investigation: were the rules executed consistently, were historical assumptions realistic, did costs change, or did market conditions move away from those represented in the backtest? The answer may involve the strategy, the implementation, or both.
The same patience should apply to short-term journal changes. Three losing trades can noticeably move the ratio, particularly in a small sample. Do not turn every fluctuation in Profit Factor into permission to rewrite the strategy.
Profit Factor and Expectancy Answer Different Questions
Profit Factor compares aggregate gross winning P&L with aggregate gross losing P&L. Expectancy focuses on the average result produced per trade across the sample, using the frequency and size of winning and losing outcomes. The metrics are related because they draw from the same trade distribution, but they answer different questions.
Two strategies can have the same Profit Factor while producing very different average dollars per trade. A strategy taking 1,000 tiny trades can produce a Profit Factor of 1.5, while another taking 100 much larger trades can also produce 1.5. The ratio is identical even though the economics of each individual trade may be very different.
That is why Profit Factor should not replace expectancy, win rate, net profit, drawdown, or planned risk-to-reward. Each metric removes some information in order to summarize another part of performance. The next useful question is not which metric wins, but what additional question each one helps answer.
A Practical Profit Factor Review Stack
Use Trades → Gross Profit & Loss → Ratio → Sample → Distribution → Durability. The calculation should happen early in the review, not at the end of the thinking. Once you have the number, the real work is understanding what created it.
- Calculate Profit Factor: Gross profit divided by absolute gross loss.
- Check trade count: How many outcomes produced the ratio?
- Check costs: Were commissions, slippage, and other assumptions realistic?
- Check concentration: Did one or two trades dominate the result?
- Check drawdown: What did the path between the trades look like?
- Check win rate and average win/loss: How was the Profit Factor created?
- Check regimes: Did the relationship persist across different conditions?
- Check time: Is performance stable, improving, or deteriorating?
- Check live versus backtest: Do actual executions resemble the historical assumptions?
- Interpret the ratio: Only now decide how much confidence the number deserves.
| Metric / Observation | What It Tells You | What It Does Not Tell You |
|---|---|---|
| Profit Factor | Gross winning P&L relative to gross losing P&L | Future profitability |
| PF above 1 | Winners exceeded losers in the included sample | Strategy is robust |
| PF below 1 | Losers exceeded winners in the included sample | Strategy can never work |
| High PF | Strong historical winner/loss relationship | Adequate sample size |
| Win rate | Percentage of winning trades | Magnitude of wins and losses |
| Net profit | Dollar result | Efficiency of win/loss relationship |
| Drawdown | Capital decline and path risk | Winner/loss ratio |
| Expectancy | Average result per trade | Full distribution or drawdown |
| Risk-to-reward | Payoff relationship for a trade or setup | Aggregate strategy Profit Factor |
Instead of asking only “Is 1.7 a good Profit Factor?”, ask “What trades produced the 1.7?” Then ask how many there were, what costs were included, whether a few trades dominated the result, what drawdown came with it, and whether the relationship survived different conditions. The final question is the most useful: “Would I still be impressed by this Profit Factor if I saw the entire equity curve and trade distribution beside it?”
Final Thought
Profit Factor is a genuinely useful trading metric because it forces the trader to consider both winning and losing dollars in one intuitive ratio. It gives more information than win rate alone and can help compare comparable samples, monitor deterioration, and review a trading process over time. Its usefulness does not require pretending that it answers every question.
Profit Factor is a ratio, not a grade. A value above 1 tells you that aggregate winners exceeded aggregate losers in the selected sample, but reliability still depends on trade count, concentration, costs, drawdown, market conditions, and the assumptions behind the data. The trader’s job is to understand what produced the number before deciding how much confidence to place in it.
Before deciding that a Profit Factor of 1.5, 2.0, or 3.0 proves you have a good strategy, ask whether you can explain how many trades created it, how dependent it is on a few outcomes, what costs and drawdowns came with it, and whether the result remained stable outside the exact sample that produced the ratio. That longer-horizon way of judging trading decisions is central to The Patience Principle.
Educational content only. Trading involves substantial risk and is not suitable for everyone.