
Risk of ruin is where expectancy meets position size. A strategy can have positive expectancy and still produce five, eight, or ten losses in a row. The sharper question inside The Setup is not “What percentage should I always risk?” but “Can my capital survive the ugly sequence this strategy is statistically capable of producing?”
What Does “Ruin” Actually Mean?
Ruin does not have to mean a $0.00 balance. For a futures trader, it may mean falling below margin requirements, reaching a personal maximum drawdown, shrinking below the minimum practical contract size, breaching a prop-account loss boundary, or reaching a threshold where the strategy can no longer be executed. Mathematical survival to the last penny can therefore be irrelevant.
A trader can be functionally finished while substantial nominal equity remains. Ruin means reaching the point where the strategy can no longer be executed—not necessarily the literal last dollar. Trade risk asks what can happen once; risk of ruin asks whether repeated outcomes can reach the failure boundary before the process can continue.
Expectancy Does Not Tell You the Order of Outcomes
Suppose a strategy wins 50% of its trades, the average winner is +1.5R, and the average loser is −1R. Its simplified expectancy is (0.50 × 1.5R) − (0.50 × 1R) = +0.25R per trade. That is positive expectancy, but it does not mean every four trades produce +1R or that losses arrive politely one at a time. Expectancy describes the average destination—not the order in which trades arrive.
As we explain in what an edge actually is, an advantage only matters if the process can survive enough attempts for it to show up. Two traders can receive the same 100 outcomes in different orders and experience very different drawdowns. The average may eventually be similar, but the path can be radically different.
Losing Streaks: “Next Five” Is Not “Somewhere in 100”
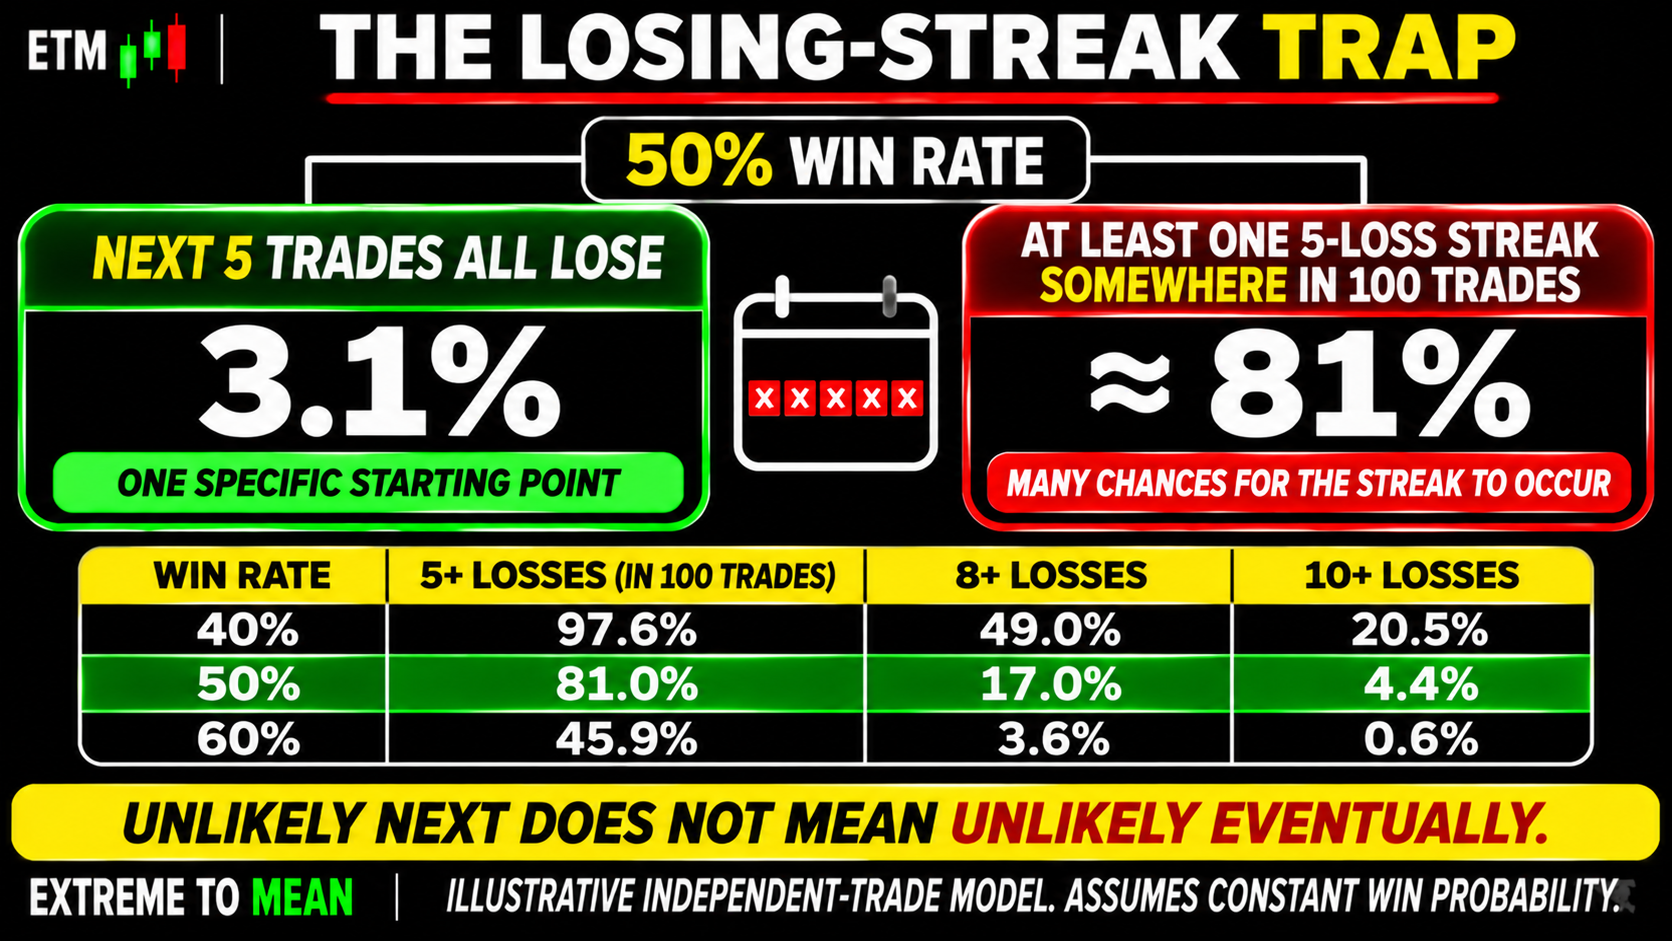
Assume for illustration that trades are independent and a strategy wins 50% of the time. The probability that the next five specified trades all lose is 0.5⁵ = 3.125%. That is not the probability of seeing at least one five-loss streak somewhere across 100 trades. A longer sample gives the streak many overlapping opportunities to occur, so under the same independent 50/50 assumptions the chance of at least one five-loss run somewhere in 100 trades is about 81%.
| Win Rate | 5+ Losses Somewhere in 100 Trades | 8+ Losses | 10+ Losses |
|---|---|---|---|
| 40% | 97.6% | 49.0% | 20.5% |
| 50% | 81.0% | 17.0% | 4.4% |
| 60% | 45.9% | 3.6% | 0.6% |
These are mathematical probabilities under a simplified model with independent trades and a constant win probability, not forecasts for a real trading system. A streak can be unlikely next and likely eventually. High win rate reduces streak probability; it does not repeal probability.
Position Size Turns the Same Streak Into Different Damage
Now keep the losing streak constant and change only position risk. If a trader loses a fixed percentage of current equity on each trade, the drawdown after \(n\) consecutive losses is 1 − (1 − r)ⁿ, where r is the risk fraction.
After ten straight losses:
| Risk Per Trade | Drawdown After 10 Losses |
|---|---|
| 0.5% | 4.9% |
| 1% | 9.6% |
| 2% | 18.3% |
| 5% | 40.1% |
A $50,000 account risking 1% of remaining equity falls to about $45,219 after ten losses. The same account risking 5% falls to about $29,937. The losing streak did not change. The position size changed the consequence.
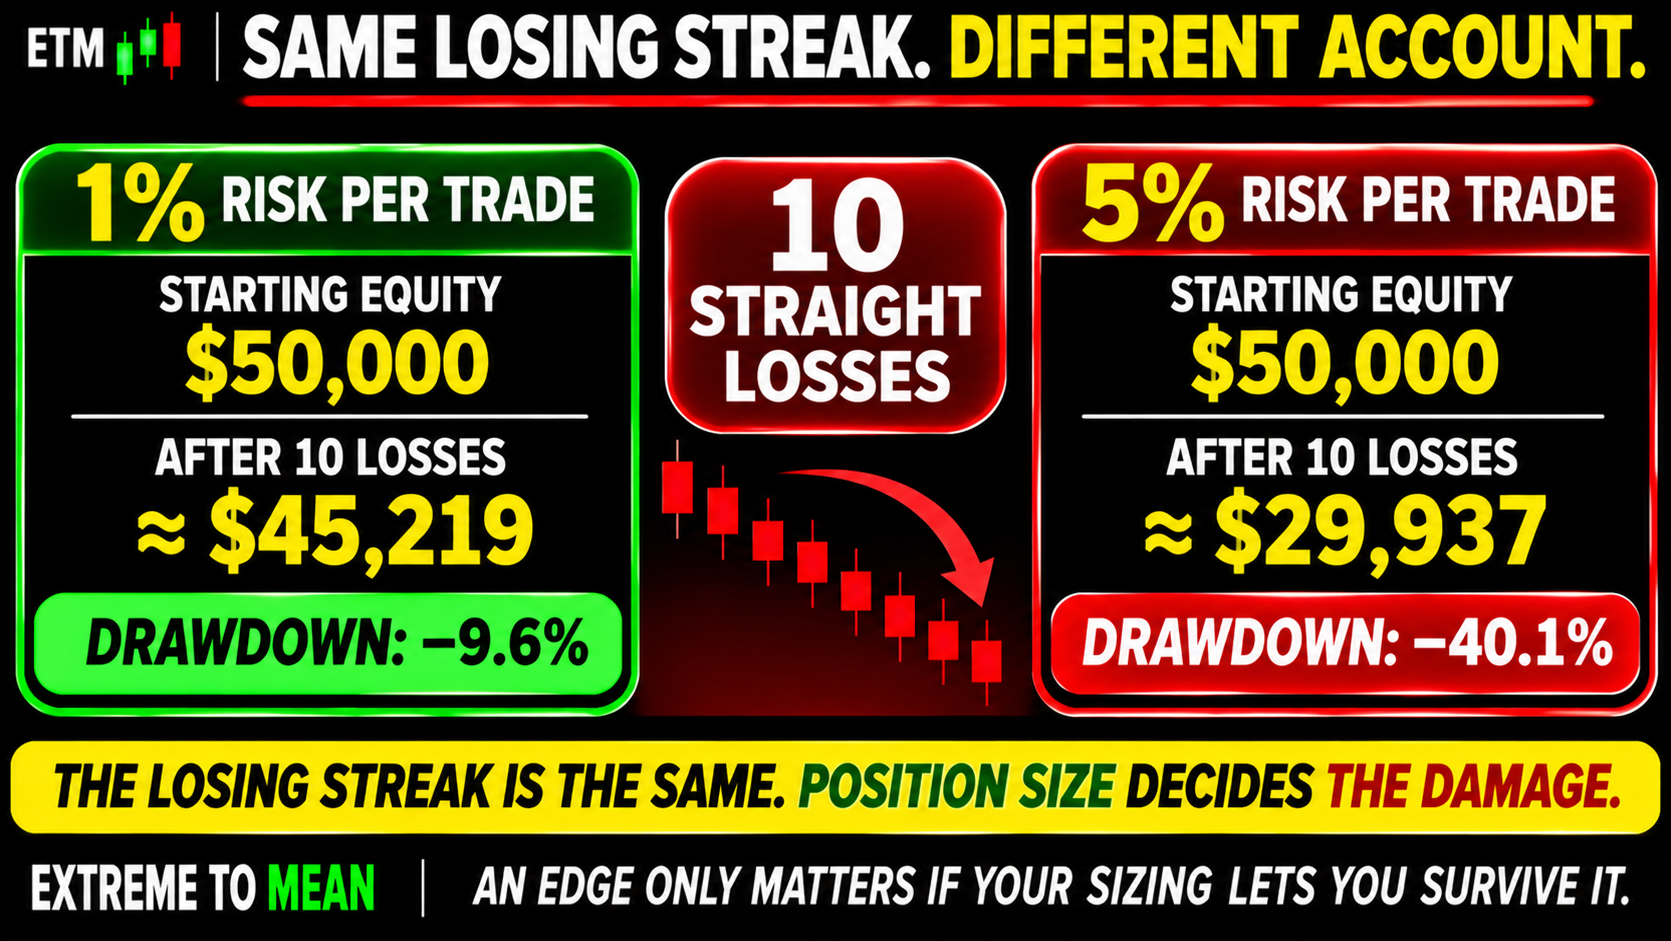
After fifteen straight losses, the drawdowns are roughly 7.2% at 0.5% risk, 14.0% at 1%, 26.1% at 2%, and 53.7% at 5%. The streak is identical in every case. Position size does not change whether the next trade wins; it changes whether the account survives being wrong repeatedly.
Fixed Dollars and Fixed Fractions Behave Differently
A fixed $1,000 risk on a $50,000 account becomes an increasingly large percentage as equity shrinks. Fixed-fractional sizing reduces dollar risk during drawdown. But it does not eliminate risk of ruin because futures still have minimum contract sizes, margin, costs, gaps, slippage, and practical account limits.
Drawdown Makes Recovery Harder
Losses compound downward just as returns compound upward. A 10% drawdown requires about 11.1% to recover, 20% requires 25%, 30% requires about 42.9%, and 50% requires 100%. The deeper the drawdown, the harder the climb back becomes. Avoiding deep drawdowns is not timid—it is arithmetic.
This is why the trade is not ready until the risk is clear. Risk needs to include what a sequence of losses can do, not merely what one stop costs. Survival is part of trade construction, not a separate problem to discover later.
Win Rate Alone Cannot Calculate Risk of Ruin
Consider two strategies. Strategy A wins 60% of the time but averages only +0.5R per winner and −1R per loser, giving expectancy of −0.10R. Strategy B wins only 40% but averages +2R per winner and −1R per loser, giving expectancy of +0.20R.
The lower-win-rate strategy is economically superior under those assumptions, even though it will naturally experience more frequent losing streaks. WIN RATE ≠ RISK OF RUIN. The payoff distribution, position size, failure boundary, trade count, and dependence between outcomes all matter.
The Classic Formula Is Useful—but It Is Still a Model
Classical gambler’s-ruin mathematics examines whether a random walk reaches a failure boundary before an upper boundary. In the simplest version, each trial is independent, each win adds one unit, each loss removes one unit, and the probabilities remain constant. That framework shows how edge and distance to failure interact, but real strategies can have unequal outcomes, changing size, costs, gaps, correlation, and regime shifts. A risk-of-ruin percentage is meaningless unless you know what model produced it. CLASSICAL MODEL ≠ REAL-WORLD CERTAINTY.
Real Trading Can Cluster Losses
Independence is one of the fragile assumptions in simple streak math. A strategy can repeatedly fail during the same trend, volatility state, or market regime, so one loss may occur in conditions that make another loss more likely. Portfolio correlation creates the same problem: a trader long ES, NQ, and YM on one broad equity thesis may call them three trades, but economically they can behave like one concentrated risk event. Three tickets can still be one bet.
After several losses, traders may also increase size, loosen standards, or move stops; the mathematical streak becomes a behavioral streak. Increasing size during drawdown moves failure closer exactly when the evidence is getting worse. A survival plan has to account for both market dependence and human behavior.
Your Real Risk Capital May Be Smaller Than the Headline Balance
A $50,000 account does not necessarily contain $50,000 of usable loss capacity. If trading must stop at $40,000, the practical loss budget is $10,000; at $500 of fixed initial risk, that is roughly 20 loss units, while $2,000 of risk leaves only five. ACCOUNT BALANCE ≠ PRACTICAL LOSS BUDGET.
The same principle matters in prop-style structures. A nominal $50,000 account with a $2,000 loss boundary has an operational budget much closer to $2,000 than $50,000. For background on those account structures, see what a prop firm is. Risk capital is the distance to the point where the strategy becomes untradeable, not always the large number shown on the account.
Stress-Test the Size for Survival
Before choosing size, ask what five, ten, or fifteen full losses would do, then stress weaker win rates, smaller winners, larger losses, realistic costs, and correlated exposure. MAX HISTORICAL DRAWDOWN ≠ MAX FUTURE DRAWDOWN. A plan with almost no room between historical pain and failure is fragile.
The Risk-of-Ruin Checklist
Before selecting position size, ask:
- What does “ruin” mean for this account?
- What is the true loss budget to that boundary?
- What are the estimated win rate, average winner, and average loser?
- What streaks are plausible over the expected number of trades?
- What would 5, 10, or 15 losses do at the proposed size?
- Am I using fixed-dollar or fixed-fractional risk?
- Are my trades really independent, or am I stacking correlated exposure?
- Can a planned −1R loss become worse because of gaps or slippage?
- How much recovery would the stress drawdown require?
- Would I still execute the strategy after that drawdown?
- Does the plan survive if the historical edge is weaker than estimated?
The point is not to discover one universal risk percentage, but to build sizing around a distribution the account can survive. The ETM free tools can support the research, but no calculator removes its assumptions. The model should inform the plan, not replace judgment about the model.
The ETM Edge → Streak → Size → Drawdown → Survive Framework
Use EDGE → STREAK → SIZE → DRAWDOWN → SURVIVE. EDGE asks what the strategy earns on average; STREAK asks what adverse sequences can plausibly occur; SIZE asks how much capital is exposed per attempt. DRAWDOWN converts the sequence into damage, and SURVIVE asks whether the trader and account can still execute the plan afterward.
The operating rule is:
SIZE FOR SURVIVAL → LET THE EDGE EARN THE RIGHT TO MATTER
POSITIVE EXPECTANCY ≠ GUARANTEED SURVIVAL. An edge only matters if your sizing lets you survive long enough to realize it.
Final Thought
Risk of ruin is what happens when an edge, a sequence of outcomes, position size, and a finite loss budget meet. Under a simple independent model, even a 50% win-rate strategy has about an 81% chance of seeing at least one five-loss run somewhere across 100 trades. Losing streaks are not evidence by themselves that the edge disappeared.
Ten straight losses at 1% fixed-fractional risk cost roughly 9.6% of equity; the same ten losses at 5% cost roughly 40.1%. The streak did not decide the damage by itself. Position size did. Same sequence, very different survival problem.
Real trading is messier than the model because outcomes can cluster, losses can exceed planned stops, edges can weaken, and traders can make worse decisions under pressure. Define the failure boundary, measure the true loss budget, stress the strategy against plausible bad sequences, and size so normal statistical pain does not become permanent financial failure. The goal is not to eliminate losing streaks; it is to remain capable of taking the next valid trade.
Educational content only. Trading involves substantial risk and is not suitable for everyone.