
Directional Trading vs. Relative-Value Trading
A directional trader might buy NQ because they expect Nasdaq futures to rise. A relative-value trader cares less about the outright direction and more about how one instrument performs compared with another. Both markets can rise or both can fall while the relative-value trade still works.
Imagine two historically related instruments called A and B. If A becomes unusually weak compared with B, a pairs strategy might buy A and short an appropriately weighted amount of B because the research suggests their relationship has sometimes normalized after similar divergences. The thesis is not necessarily that A must rise or B must fall; the thesis is that A should improve relative to B.
That is the first major shift in thinking. Directional trading asks where price may go, while relative-value trading asks whether two prices have moved unusually far apart under a relationship the trader has already researched. That relationship—not either individual chart—is the real subject of the trade.
What Statistical Arbitrage Actually Means
Statistical arbitrage is a broad family of strategies that uses data, historical relationships, quantitative rules, and probability to search for relative-pricing opportunities. Professional implementations can involve baskets, factors, portfolio hedges, and many simultaneous positions, so pairs trading is only one accessible example. For a beginner, though, a two-instrument pair makes the underlying logic much easier to see.
The word arbitrage can create the wrong impression. Classical arbitrage usually refers to exploiting a price discrepancy that can be locked in with very little economic risk under the required assumptions, while statistical arbitrage normally depends on a relationship behaving enough like its past for the opportunity to work. That introduces model risk, market risk, execution risk, and the possibility that the historical relationship simply stops behaving as expected.
Statistical arbitrage is therefore statistical because the edge is probabilistic, not because convergence is guaranteed. That distinction connects directly to what an edge actually is: a repeatable tendency can improve the quality of a decision without making the next outcome certain. Mathematics can measure the hypothesis more precisely, but it does not remove uncertainty.
The Relationship Comes Before the Trade
Two instruments should not become a pair simply because their charts happened to look similar for a few months. A useful relationship may have an economic reason: common industry exposure, similar products, shared macro drivers, index membership, a supply-chain connection, or exposure to the same underlying factor. Statistics can reveal a relationship, but economic logic can help explain why that relationship might persist.
Neither side is enough by itself. A convincing business story with no statistical evidence can become storytelling, while a beautiful historical relationship with no sensible reason for existing may simply be a coincidence discovered through data mining. A stronger candidate has both an understandable connection and historical evidence worth investigating.
This is why pairs trading is a research problem before it becomes a chart setup. The quality of the pair matters before the quality of the entry, because no entry technique can rescue a relationship that never had a reasonable basis for mean reversion. The real work begins long before the spread becomes exciting.
This research-first approach is why the lesson belongs in the Setup curriculum: the edge is built through defining and testing the relationship before the real-time divergence ever appears.
Correlation Is Not Enough
Correlation tells us whether two variables have tended to move together, but that alone does not tell us whether the relationship between them returns toward a stable reference. Two stocks can both trend higher for years and show strong positive correlation while one consistently outperforms the other. Their prices move together, yet the gap between them can continue expanding.
Pairs trading requires a more demanding question. Does some properly defined relationship between the instruments behave in a sufficiently stable way that temporary deviations have historically tended to normalize? This is where traders eventually encounter cointegration, which examines whether a particular long-run relationship between changing price series tends to hold together over time.
P042 does not need the statistical machinery behind that test. The important lesson is that two markets can move together without having a spread that reliably comes back together. Correlation may help identify candidates, but it does not prove a mean-reverting pair.
The Spread Is the Relationship You Actually Trade
A spread is the calculated relationship the model tracks between the two instruments. In a simplified classroom example, that might resemble A minus some adjusted amount of B, but real pairs can require different weighting because the instruments may have different volatility, price scale, beta, multipliers, or exposure. One unit long versus one unit short is not automatically balanced.
That adjustment is often described through a hedge ratio. The exact calculation can be done several ways and belongs in the deeper quantitative lessons, but the purpose is straightforward: determine how much of one instrument belongs against the other if the strategy is trying to isolate relative performance. Two positions do not automatically create one hedged trade.
The same caution applies when traders use words such as cheap and expensive. If A is relatively cheap versus B, the model is not claiming that A is fundamentally undervalued; it means A sits on the inexpensive side of the relationship being studied. Relative value only has meaning relative to the model that defined it.
Divergence Is a Measurement, Not a Trade Signal
Once the relationship is defined, the strategy can measure when the spread moves unusually far from its historical behavior. A common quantitative tool is a z-score, which expresses how far a current observation sits from an estimated mean using units of standard deviation. That helps standardize the idea of “far,” but it does not tell the trader that reversion must happen.
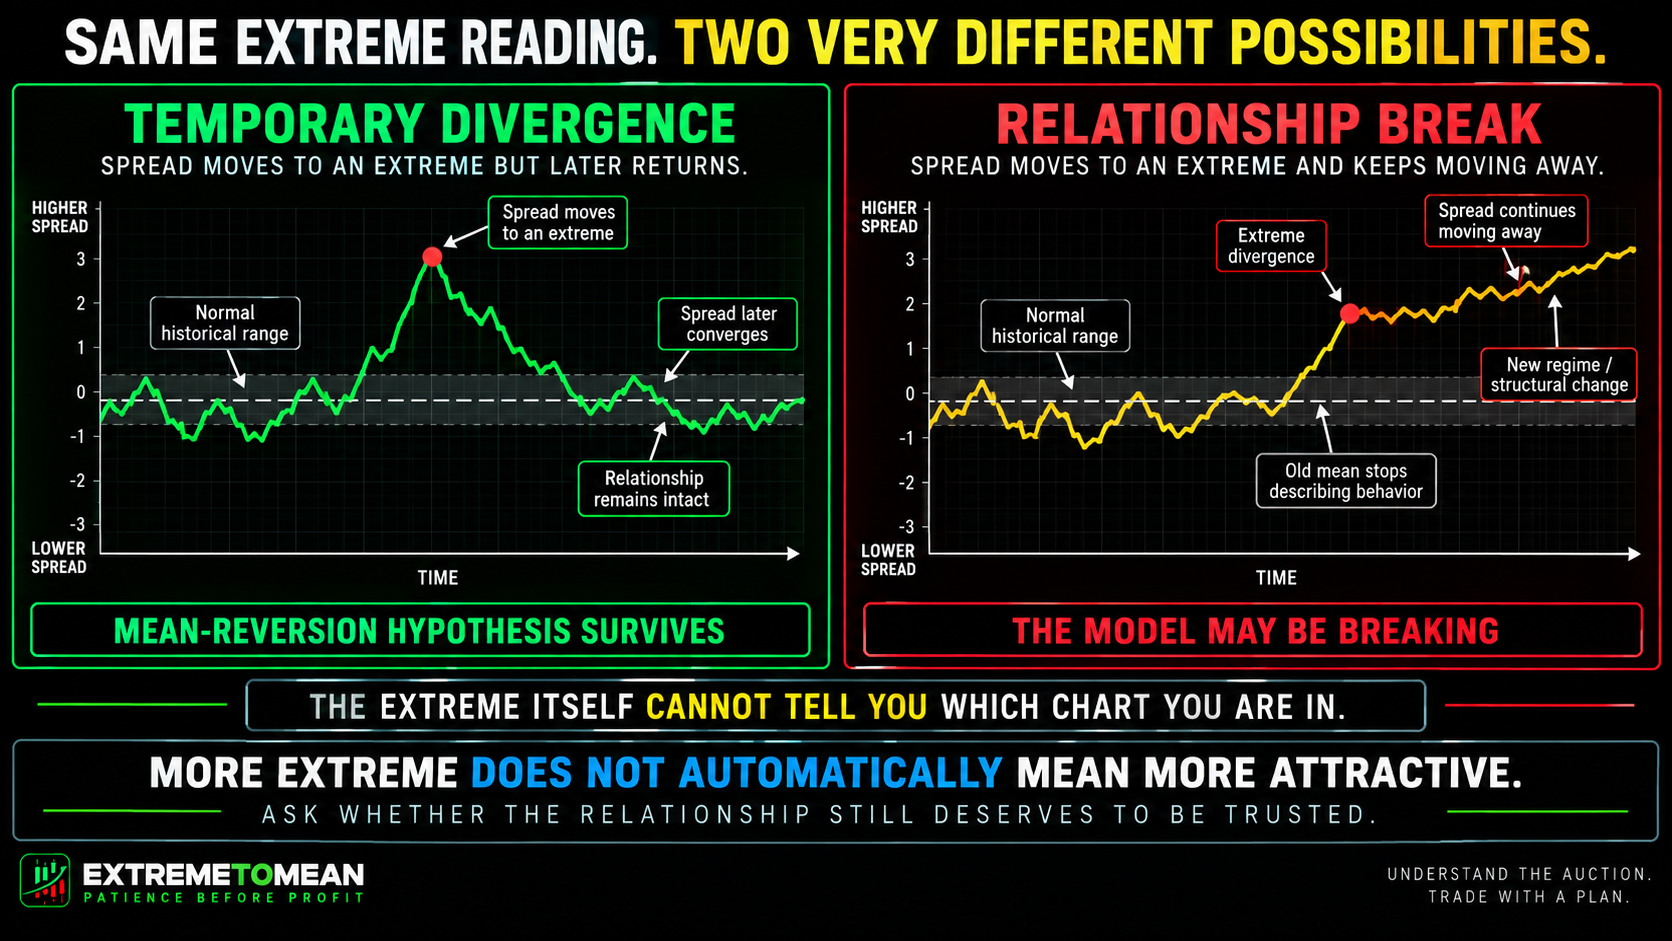
A statistically unusual reading can represent temporary dislocation, but it can also be the first evidence that the relationship itself has changed. Company news, regulation, changing industry economics, a macro regime shift, contract-roll effects, liquidity problems, or changing factor exposure can all create divergence for reasons that may persist. Far from the average is a measurement; “must come back” is an assumption.
This is also why a larger deviation is not automatically a better trade. If adding exposure every time the spread becomes more extreme was not part of the tested strategy, the trader may simply be averaging into a model that is failing. An extreme creates a research question before it creates permission to add risk.
How a Pair Can Work Without Predicting Market Direction
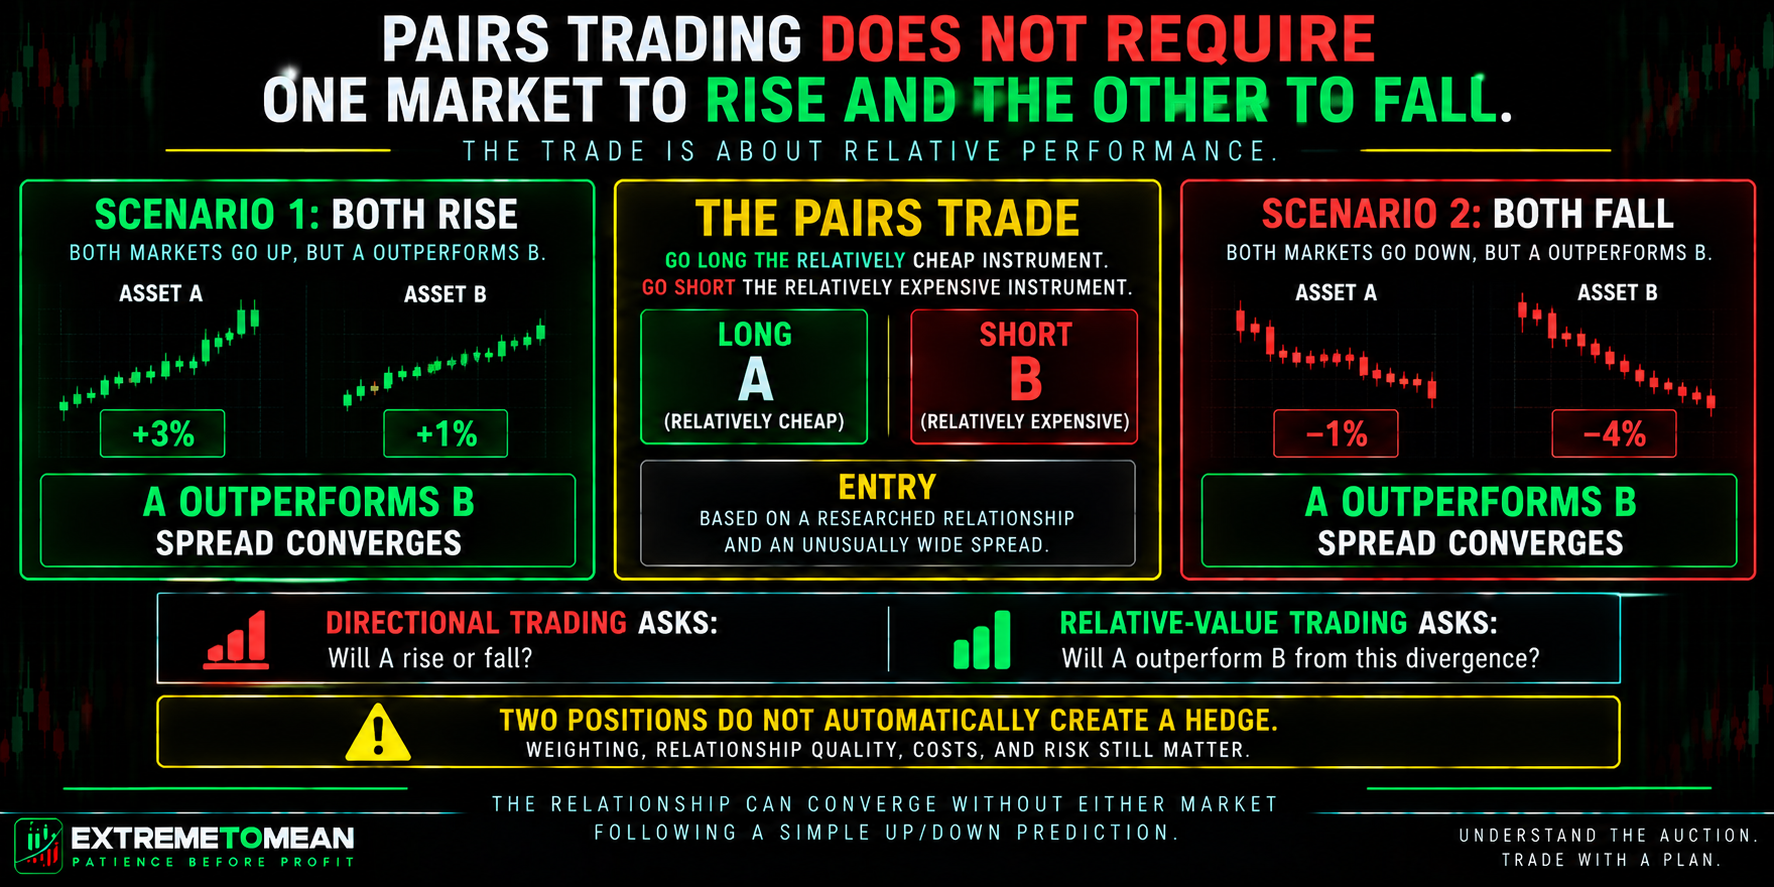
Suppose research identifies a hypothetical pair and the strategy becomes long A and short B after A has underperformed. Both instruments then rally, with A gaining 3% while B gaining 1%. The trader did not need the overall market to fall or rise; the important event was A outperforming B as the relative gap narrowed.
The opposite example makes the same point. If A falls 1% while B falls 4%, the long side loses money but the short side can gain more, allowing the relative trade to benefit from convergence. Relative-value trading is about the performance difference between the legs rather than requiring each individual position to move in the direction that would look “correct” on its own.
This does not make pairs trading naturally safe or perfectly hedged. If A continues badly underperforming B, the spread can widen and both the sizing and model assumptions can work against the trader. A well-constructed pair may reduce some common directional exposure, but neutral to one source of risk does not mean neutral to every source of risk.
Research Has to Survive Reality
A historical relationship should be defined clearly enough that another researcher could test the same idea without knowing the result in advance. Pair selection, spread construction, entry conditions, exits, failure conditions, weighting, holding period, and any regime filters should be established before the backtest is judged. Otherwise the researcher can keep adjusting the rules until yesterday's chart looks perfect.
Testing also needs information the model did not use to design itself. Developing rules on one historical period and then examining another period gives the strategy a harder test than designing and evaluating everything on exactly the same sample. Even successful out-of-sample testing does not guarantee tomorrow, but it gives the idea a more honest challenge.
Costs can eliminate the apparent edge as well. Pairs trading usually means two legs, so commissions, spreads, slippage, financing or borrow expenses where applicable, and futures contract or roll considerations can matter on both sides. A small statistical advantage that disappears after realistic implementation is not a tradeable edge.
Futures traders have another layer to consider. Related contracts can have very different multipliers, tick values, volatility, expirations, liquidity, and margin treatment, so buying one contract and shorting one contract does not automatically create balanced exposure. The relationship must be expressed in actual economic exposure, not simply equal contract counts.
Relationship Breakdown Is the Central Risk
Mean reversion is not a force pulling a spread home. It is historical behavior that must be observed, measured, and continually re-tested because the reference itself can change. Businesses evolve, index composition changes, interest-rate regimes shift, industries restructure, and markets that once behaved together can separate for legitimate reasons.
This is the deepest danger in a pairs trade. The model assumes historical relationship → temporary divergence → possible convergence, while the reality may be historical relationship → structural change → new relationship. More extreme does not automatically mean more attractive; sometimes it means the model is breaking.
Time belongs in that risk analysis too. A spread that eventually converges six months later may still represent a failed strategy if the tested thesis expected normalization within days, because capital, costs, and risk remained tied up much longer than planned. Eventually right can still be a poorly defined trade.
The trader therefore needs an invalidation process just as they do in any other setup. Failure may be defined through the spread, time, relationship stability, volatility, a structural event, or another tested condition rather than one simple price level. The trade is not ready until the risk is clear, even when the trade contains two instruments and statistical equations.
A Practical Statistical-Arbitrage Research Filter
Before a divergence becomes a possible setup, the trader should be able to work through the relationship from first principle to risk:
- Relationship: Why should these instruments have a meaningful connection?
- Representation: How will that relationship actually be measured?
- Stability: Has it behaved consistently enough across different periods to deserve further study?
- Divergence: What objectively counts as unusual?
- Reversion: Have similar deviations historically tended to normalize?
- Timing: How long has that process usually taken?
- Implementation: Can both legs be traded realistically after costs and practical constraints?
- Validation: Does the idea survive data that did not determine the rules?
- Failure: What evidence says the old relationship may no longer be valid?
- Risk: How much can be lost when the historical tendency does not repeat?
The better question is not, “How far from the mean is this spread?” Ask, “Do I still have good evidence that this mean is relevant?” That puts relationship quality ahead of excitement over an extreme reading.
It also prevents a common mistake in all mean-reversion trading: assuming distance automatically creates opportunity. As the lesson on room to revert reinforces in a different context, a potential move only matters after the setup, reference, and risk make sense. Statistical extremity is one input into qualification, not qualification by itself.
Final Thought
Statistical arbitrage is not about finding two charts that look similar and betting that they will reconnect. It is about defining a relationship, measuring when that relationship becomes unusual, and testing whether comparable divergences have historically converged often and efficiently enough to deserve risk. Pairs trading is simply one accessible way to understand that broader research process.
The mathematics can make the measurement more precise, but it cannot turn a false relationship into a true one. Correlation can mislead, historical means can move, costs can erase small edges, and a relationship that looked temporary can break permanently. The research must leave room for all of those outcomes.
The ETM question remains the same even when the charts and statistics become more sophisticated: what are we actually observing, what are we assuming, what would prove the idea wrong, and does the risk justify acting? Define the relationship, test the hypothesis, account for implementation, and accept that the model can fail. That research-first mindset is part of the broader Extreme to Mean system.
Educational content only. Trading involves substantial risk and is not suitable for everyone.