
Trading expectancy combines win frequency with the size of winning and losing outcomes to describe the average result per trade across a defined sample. That makes it more informative than win rate alone, but it does not turn historical results into a promise about the next trade or market regime. Inside The Trader, expectancy belongs in the review of repeated decisions rather than in judging yourself by the most recent outcome.
What Trading Expectancy Actually Measures
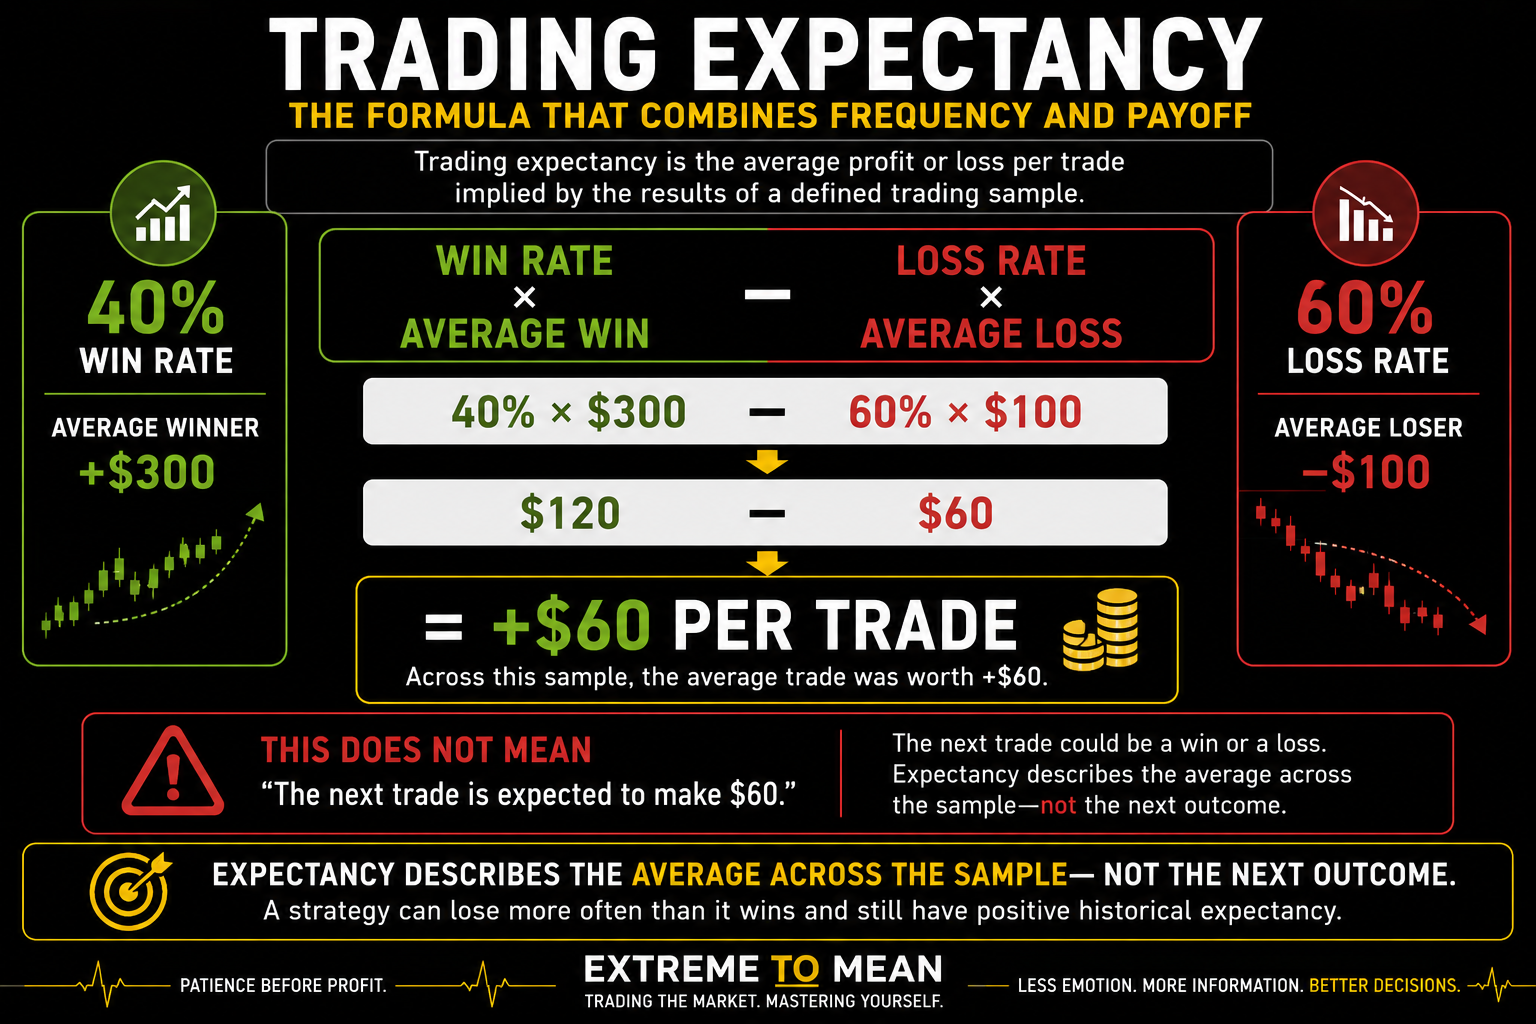
Trading expectancy is the average profit or loss per trade implied by a defined sample. The common formula is Expectancy = (Win Rate × Average Win) − (Loss Rate × Average Loss), with the average loss treated as a positive magnitude inside the subtraction. It combines two essential pieces of a trading process: frequency and payoff.
Suppose a strategy wins 40% of its trades, the average winner is $300, the loss rate is 60%, and the average loser is $100. The calculation is (0.40 × $300) − (0.60 × $100) = +$60 per trade. In plain English, the measured sample produced an average result of positive $60 per completed trade.
That does not mean the next trade should make $60. The next result might be a $150 loss, a $400 gain, a scratch, or something else entirely. Expectancy describes the process across repetition; it does not schedule the outcome of the next one.
Win Rate Alone Tells Only Half the Story
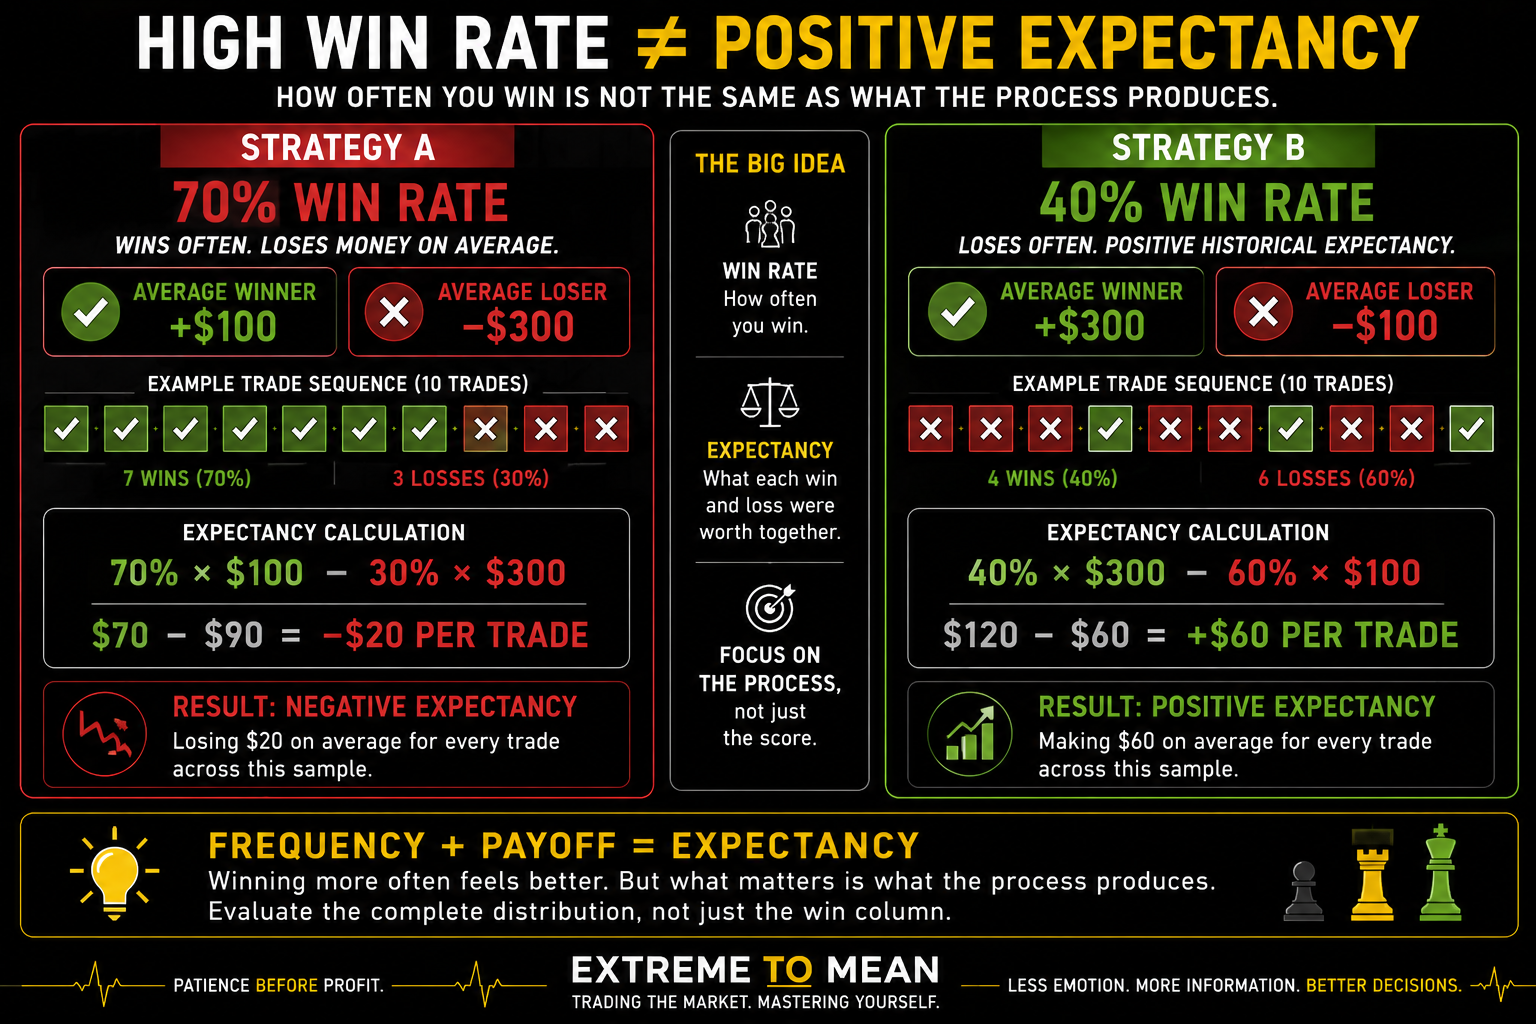
Consider Strategy A, which wins 70% of the time, averages $100 on winners, and loses $300 on the average loser. Its expectancy is $70 − $90 = −$20 per trade. The trader wins seven out of ten trades and still loses money on average across the sample.
Now consider Strategy B, which wins only 40% of the time, averages $300 on winners, and loses $100 on the average loser. Its expectancy is $120 − $60 = +$60 per trade. The trader loses six out of ten trades and still has positive historical expectancy.
Winning often and making money are not the same statistic. A high win rate can feel better because it provides frequent reinforcement, while a lower-win-rate process can create uncomfortable losing streaks even when its measured economics are favorable. That emotional difference is one reason traders sometimes optimize for comfort instead of the complete distribution.
Positive Expectancy Is Historical Evidence, Not a Guarantee
A positive expectancy means the measured sample produced a positive average result per trade under the assumptions included in the data. An expectancy of +$35 means the average completed trade contributed positive $35, not that each trade earned $35 or that the next ten trades will do so. If expectancy is below zero, the sample lost money per trade on average, but neither sign is a permanent verdict on what the strategy will do next.
A positive result can still be distorted by a small sample, one unusual winner, favorable conditions, unrealistic execution, missing costs, or inconsistent position sizing. There is no universal dollar or R threshold that turns expectancy into a passing grade without considering the sample, distribution, costs, and risk. This is closely related to what an edge actually is: favorable historical results are evidence to evaluate, not proof that future outcomes are secured.
Expectancy Is an Average, Not a Smooth Path
Suppose historical expectancy is +$40 per trade. Multiplying $40 by ten trades can provide a simple expected-value reference, but it does not guarantee that the next ten trades will produce $400. Short sequences can land far above or below the historical average because outcomes arrive unevenly.
One sequence may contain several losses before a large winner appears, while another alternates wins and losses and arrives at a similar average. A trade is one outcome; a strategy is a distribution of outcomes. Expectancy describes the center of that distribution without preserving the exact path.
Sample size therefore changes how much confidence the average deserves. A +$150 expectancy across eight trades and +$35 across 800 trades cannot be ranked by the headline number alone because the smaller sample can be dominated by random variation or one outlier. There is no universal trade count that suddenly makes expectancy reliable.
Expectancy in Dollars and Expectancy in R
Dollar expectancy is intuitive because it expresses the average result in money. If a strategy wins 45% of trades with an average winner of $220 and loses 55% with an average loss of $150, expectancy is +$16.50 per trade. The limitation is that changing position size can change the dollar number even when the underlying trading behavior has not improved.
Expressing expectancy in R can normalize results when the risk unit is defined consistently. A strategy with a 40% win rate, a +2R average winner, and a −1R average loser has expectancy of +0.20R per trade. That means the sample averaged 0.20 times the defined risk unit per trade, not a 20% account return per trade.
Normalization only works when the unit remains stable. If the trader changes what counts as 1R after partial exits, oversized losses, or rule-breaking trades, the comparison becomes unreliable. R standardizes the language of outcomes; it does not remove the need for consistent accounting.
Reward-to-Risk, Profit Factor, and Expectancy Are Different Metrics
A planned 3:1 reward-to-risk ratio does not automatically produce +3R expectancy because the calculation still needs to know how often the 3R outcome occurs. If only 10% of trades win 3R while 90% lose 1R, expectancy is −0.60R per trade. A beautiful planned payoff means little without occurrence frequency.
Profit Factor answers a different question. Profit Factor compares aggregate gross winning P&L with aggregate gross losing P&L, while expectancy asks what one trade contributed on average across the sample. A Profit Factor of 1.50 does not translate into +0.50R expectancy or any other fixed per-trade value.
Costs, Breakevens, and Market Conditions Matter
Expectancy is only as useful as the trade data placed into the calculation. If a strategy shows +$8 per trade before commissions, fees, and slippage but those costs average $11 per trade, the economically realized expectancy is negative. Costs should be included inside trade results or subtracted consistently afterward, but never ignored or double-counted.
Breakeven trades need careful handling too. The shortcut Loss Rate = 1 − Win Rate works only when every trade is classified as either a winner or loser; if scratches are separate, each outcome category should be measured as a share of all completed trades. A useful sanity check is whether the expectancy calculation agrees with total net P&L divided by total completed trades.
An all-history expectancy can also hide differences across market regimes. A setup may produce favorable economics in trending conditions and weak economics during rotation, so reviewing performance alongside the three market states can reveal whether context changes the distribution. Segment to test a reasoned hypothesis, not to slice the data until noise produces a flattering subgroup.
A Practical Expectancy Review Stack
Use Frequency → Payoff → Expectancy → Sample → Variation → Durability. The formula is the beginning of the review rather than the end because the trader still needs to understand how much evidence supports the average and what path created it. Expectancy is useful because it forces frequency and consequence into the same conversation.
- Gather completed trades: Use one clearly defined strategy or setup sample.
- Calculate win and loss frequencies: Include scratches correctly.
- Calculate average winner and loser: Use realized outcomes.
- Calculate expectancy: Express it in dollars, percentage, or R.
- Confirm against average net trade: Sanity-check the arithmetic.
- Verify costs: Include commissions, fees, and slippage consistently.
- Examine sample size and concentration: Ask how much evidence supports the average and whether a few trades dominate it.
- Examine context: Determine whether expectancy changes materially by market regime.
- Compare with Profit Factor and drawdown: Do not interpret one average alone.
- Review over time: Look for durable change rather than reacting to every short sequence.
| Metric | Main Question | What It Does Not Tell You |
|---|---|---|
| Win Rate | How often did trades win? | Whether winners outweighed losers |
| Average Winner | How large was the typical winning trade? | How often wins occurred |
| Average Loser | How large was the typical losing trade? | How often losses occurred |
| Expectancy | What was the average result per trade? | Next-trade outcome |
| Profit Factor | How did total winning P&L compare with total losing P&L? | Per-trade economic scale |
| Drawdown | How severe was the equity decline? | Average trade economics |
| Reward-to-Risk | What payoff relationship was planned or realized? | How frequently each outcome occurred |
Instead of asking only “What percentage of my trades do I win?”, ask “When I combine how often I win with how much I actually win and lose, what is one trade worth on average across the sample?” Then ask whether enough trades produced that average, whether it survives realistic costs and different conditions, and whether you can tolerate the losing streaks required for the distribution to unfold. A mathematically tolerable strategy can still be behaviorally intolerable to the person trading it.
Final Thought
Expectancy is useful because it makes the trader stop asking only whether they win often and start asking what the entire process produces. Win frequency matters, but so do winner size, loser size, costs, sample quality, and the distribution of outcomes. Winning often and having favorable economics are not the same thing.
Historical expectancy still deserves restraint because execution, market regime, position sizing, and the strategy itself can change. Even a positive average can coexist with uncomfortable losing streaks and drawdowns. Expectancy is an average across repetition—not an appointment with profit.
If you stopped judging your strategy by how often it lets you feel right and instead looked at what every win and loss contributes across a meaningful sample, what is one trade actually worth on average—and is that relationship stable, realistic, and tolerable enough to trust? Learning to judge a process across repeated outcomes instead of demanding validation from each individual trade is central to The Patience Principle.
Educational content only. Trading involves substantial risk and is not suitable for everyone.