
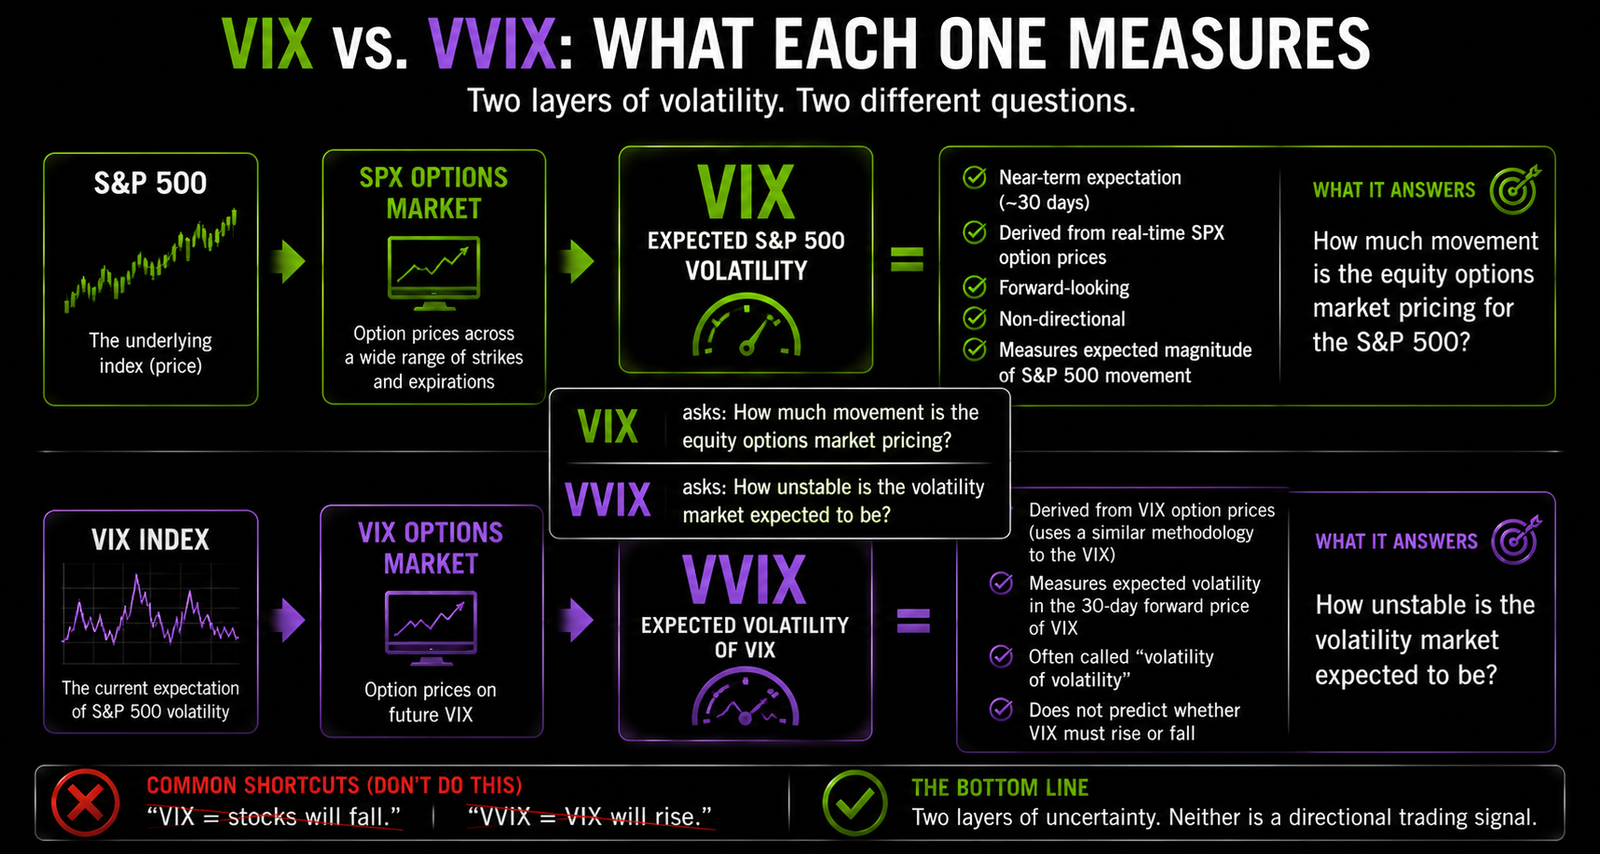
The names make VIX and VVIX sound more complicated than the basic distinction requires. VIX asks how much movement the S&P 500 options market is pricing over the near term, while VVIX asks how uncertain the VIX options market is about the future behavior of volatility itself. One is volatility; the other is commonly called volatility of volatility. The useful information comes from understanding what changes in each index actually represent.
The lessons in The Market category emphasize that secondary indicators should provide context rather than replace price structure. A rising VIX does not automatically mean the S&P 500 must fall next, and a rising VVIX does not mean VIX must immediately explode higher. Both are option-derived measures of expected movement rather than directional forecasts. The trader’s job is to evaluate what they add to the market environment already visible elsewhere.
Start With What VIX Actually Measures
VIX is a measure of the market’s expectation of S&P 500 volatility over approximately the next 30 days. It is calculated from real-time SPX option quotations across a range of strikes and is expressed as an annualized expected standard deviation. That makes VIX forward-looking compared with realized volatility, which describes movement that has already occurred. It is also non-directional by construction: expected movement can increase without specifying whether the next large move must be up or down.
This distinction matters because traders often call VIX the “fear gauge” and then treat the nickname as the definition. Equity selloffs frequently coincide with rising VIX because demand for downside protection and expected movement can increase rapidly during stress. That relationship is common enough to be useful, but it does not turn VIX into a bearish prediction tool. The cleaner interpretation is that the options market is pricing a wider range of possible S&P 500 outcomes.
A VIX reading should therefore be considered relative to its recent behavior and the market environment around it. A move from a quiet regime into a more volatile regime can matter even if the absolute number would have looked ordinary during a previous crisis. Likewise, an elevated VIX can decline while remaining historically high. Context matters more than memorizing one level and labeling everything above or below it.
VVIX Adds a Second Layer of Uncertainty
VVIX moves one level higher in the volatility structure. VVIX measures expected volatility in the 30-day forward price of VIX and is calculated from VIX options using a methodology related to the VIX calculation itself. In practical language, VVIX describes how much movement the VIX options market is pricing in VIX. That is why traders commonly call it the “volatility of volatility.”
It is useful to be precise here. VVIX is not simply the historical standard deviation of the VIX spot index, and it is not a directional prediction that VIX must rise. It reflects option prices around future VIX behavior, so changes in demand for volatility protection and convexity can affect it. A high VVIX tells the trader that the market is pricing greater uncertainty around volatility itself.
This creates an intuitive hierarchy. SPX options produce information about expected S&P 500 volatility, which appears in VIX, while VIX options provide information about expected movement in volatility, which appears in VVIX. VIX therefore helps describe the width of the expected equity-market distribution, while VVIX helps describe how unstable that volatility expectation may be. The second measure can add information even when the first has not moved dramatically yet.
When VIX and VVIX Rise Together
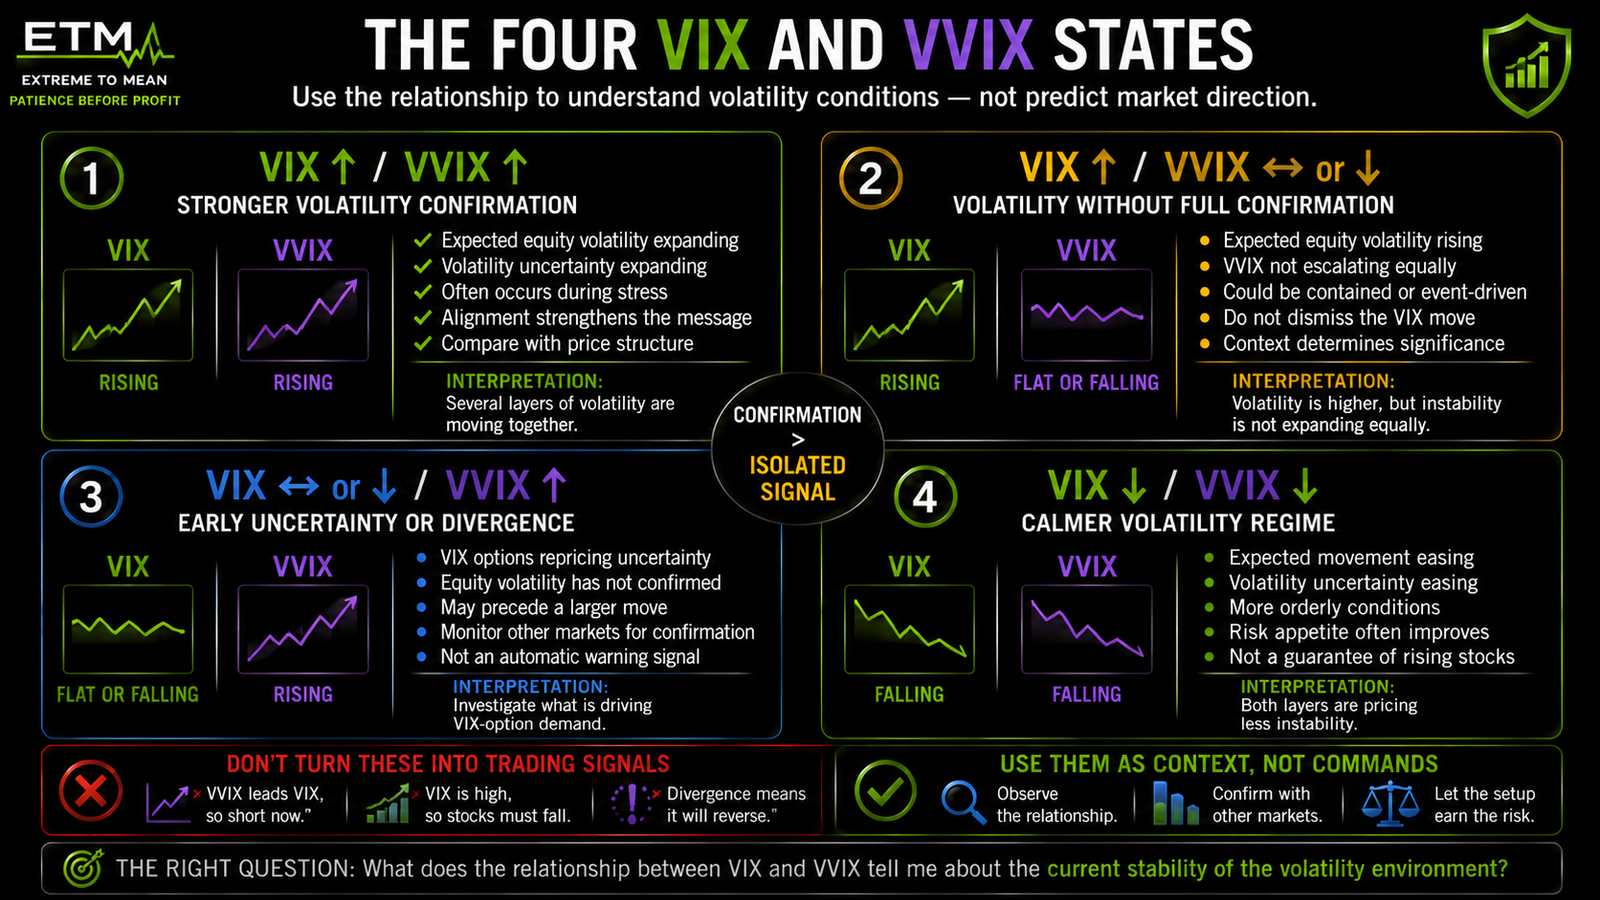
When VIX and VVIX rise together, two layers of volatility pricing are strengthening at the same time. The S&P 500 options market is pricing greater expected movement, while VIX options are also pricing greater uncertainty about the behavior of volatility. That combination often appears during periods when risk conditions are becoming more unstable. The alignment can therefore provide stronger volatility confirmation than a VIX move by itself.
The important word is confirmation, not prediction. If equities are weakening, market structure is deteriorating, and both VIX and VVIX are expanding, the trader has several pieces of evidence pointing toward a less stable environment. The volatility complex is agreeing with what price is already showing. It still does not tell the trader exactly how far the decline will travel or where an entry should occur.
This is where context comes before the candle. A rise in both indexes deserves more attention when it accompanies broader evidence of stress than when it occurs around a temporary options event with little change in the underlying market. The pair should strengthen or weaken a market thesis that has already been built from structure and conditions. It should not become the thesis by itself.
When VVIX Moves Before VIX
VVIX can sometimes rise while VIX remains relatively subdued. That tells the trader that VIX options are repricing uncertainty even though the current 30-day S&P 500 volatility estimate has not moved nearly as much. Traders may reasonably pay attention to that divergence because it suggests growing demand to hedge or position for movement in volatility itself. It does not establish that a VIX spike or equity selloff is about to occur.
There are several reasons the relationship can separate. An approaching event may increase demand for VIX options, volatility traders may reposition, or participants may pay more for convex protection while the SPX options underlying VIX remain comparatively stable. The change can be informative before a larger volatility move develops, but it can also fade without producing one. Treating every VVIX increase as an early-warning alarm would turn a contextual measure into an unreliable timing rule.
The better interpretation is that VVIX can raise a question before VIX provides an answer. If VVIX is rising while equities remain firm and VIX is quiet, the trader can look for confirmation from market breadth, yields, credit, price structure, and other risk measures. If those markets also begin deteriorating, the volatility divergence gains significance. If nothing else confirms it, the trader has less reason to elevate the signal.
When VIX Rises but VVIX Does Not Confirm
The opposite divergence can occur when VIX rises while VVIX remains relatively stable or declines. Expected S&P 500 volatility is increasing, but the options market around VIX is not increasing its uncertainty to the same degree. That can suggest that the volatility increase is being treated as more contained or more familiar than a move in which both measures accelerate sharply. It does not mean the VIX move is false.
A known event provides a useful example of the concept. Markets can price greater near-term movement around scheduled economic data, policy decisions, elections, or major event risk without simultaneously pricing an uncontrolled volatility regime. VIX may increase because the expected S&P 500 range has widened, while VVIX provides less evidence that volatility itself is becoming unstable. The distinction helps the trader separate higher volatility from escalating volatility uncertainty.
The principle connects naturally with three market states. The same VIX level can carry different meaning during orderly directional movement, rotational trading, or rapidly changing conditions. VVIX gives the trader another way to ask whether volatility pressure is becoming more disorderly. Price and market state still remain the primary evidence.
When Both VIX and VVIX Fall
Falling VIX and VVIX generally indicate that both expected S&P 500 volatility and uncertainty around volatility are being priced lower. That combination can accompany improving risk appetite, orderly markets, or the removal of an event that previously justified protection. The volatility complex is becoming calmer at two levels. For traders, that can confirm a transition toward less defensive conditions.
Calm should not be confused with safety. A low VIX does not guarantee that equities will rise, and a low VVIX does not guarantee that volatility cannot return quickly. Markets can remain quiet for long periods, and sudden information can change option pricing rapidly. Low volatility is a description of current expectations rather than protection from future surprises.
This is another reason fixed threshold rules are weak. A trader who automatically buys because volatility is low or sells because volatility is high is replacing context with a label. The cleaner process is to ask how volatility is changing relative to price behavior and the current market regime. How market conditions change the quality of a setup remains more important than one isolated index reading.
Four VIX and VVIX States
The relationship becomes easier to use when it is organized into four simple states. The purpose is not to create mechanical trading signals but to classify the volatility environment. Each state answers a different question about whether equity volatility and volatility-of-volatility are confirming one another. The classification then becomes one input inside the wider market read.
- VIX up + VVIX up: volatility and volatility uncertainty are expanding together; stronger confirmation of increasing instability.
- VIX up + VVIX flat or down: expected equity volatility is rising without the same escalation in volatility-of-volatility; investigate whether the move is contained or event-specific.
- VIX flat or down + VVIX up: VIX options are repricing uncertainty before or without a major VIX move; monitor for confirmation rather than predicting a spike.
- VIX down + VVIX down: both layers of volatility pricing are easing; calmer conditions are being confirmed, but future direction remains unresolved.
No quadrant tells the trader to buy or sell the S&P 500. The framework tells the trader whether two related volatility markets are agreeing, diverging, or changing character. That information can help determine how much confidence to place in a broader interpretation of the session. It cannot replace entry location, structure, invalidation, or risk.
Do Not Turn VVIX Into a Secret Leading Indicator
VVIX becomes especially tempting when traders see it rise before a large VIX move in hindsight. The earlier movement can create the impression that VVIX reliably predicts volatility spikes before everyone else sees them. Sometimes the sequence will occur that way because VIX options are repricing risk before SPX option volatility moves materially. Other times VVIX will rise and the expected event never develops.
The same problem occurs with almost every secondary indicator. A trader remembers the dramatic examples when the indicator “worked” and forgets the periods when the divergence resolved without a large market move. The lesson in Market Comes First applies directly: secondary evidence earns weight when it confirms observable market behavior. It should not outrank the market being traded.
This prevents a common process error. If VVIX rises while the S&P 500 remains structurally strong, breadth is healthy, and VIX is subdued, the trader does not need to manufacture a bearish thesis simply because one volatility measure looks unusual. The divergence deserves observation. It does not automatically earn risk.
A Practical VIX and VVIX Review
A useful review begins with VIX and VVIX separately before combining them. First identify what each index is doing relative to its recent range and trend, then ask whether the two are confirming one another. Finally, compare that volatility message with the market actually being traded. The sequence keeps interpretation grounded in context rather than reaction.
A practical review can ask:
- Is VIX rising, falling, or remaining stable relative to its recent regime?
- Is VVIX moving in the same direction as VIX?
- Are both measures accelerating or merely drifting?
- Is VVIX changing meaningfully while VIX remains quiet?
- Is VIX rising without a corresponding expansion in VVIX?
- Is a scheduled event affecting demand for options?
- Is equity price structure confirming the volatility message?
- Are breadth, yields, credit, or other market measures supporting the same interpretation?
- Has the relationship persisted long enough to matter, or is it one brief move?
- Am I using VIX and VVIX as context or trying to turn them into an entry signal?
The better question is not, “Is VVIX predicting the next VIX spike?” It is, “What does the relationship between VIX and VVIX tell me about the current stability of the volatility environment?” That question allows confirmation and divergence to matter without pretending either index predicts direction. It also keeps the trader focused on the quality of the complete market read.
Final Thought
VIX and VVIX measure different layers of the same volatility complex. VIX reflects the S&P 500 options market’s expectation for near-term equity volatility, while VVIX reflects expected movement in VIX derived from VIX options. When they rise or fall together, the volatility message has stronger internal confirmation. When they diverge, the divergence becomes a reason to investigate rather than an instruction to predict.
The goal is not to find a hidden indicator that announces the next market move before price does. Use VIX to understand expected equity volatility, use VVIX to understand uncertainty around volatility, and then compare both with structure and the broader market state. The more independent evidence agrees, the clearer the environment becomes without making the outcome certain. Readers who want to build a deeper cross-market framework can continue through Decode the Market.
Educational content only. Trading involves substantial risk and is not suitable for everyone.