
For clarity, this article will avoid ambiguous shorthand whenever possible. “1R risk for 2R reward” means an average reward/risk payoff of 2.0; “1R risk for 1R reward” means 1.0; and “1R risk for 0.5R reward” means 0.5. Before debating the ratio, make sure everyone is talking about the same side of the fraction.
That is why this lesson belongs inside The Setup. The sharper question is not, “Is 1:2 good?” It is: Does the strategy make enough when it wins, often enough, to pay for what happens when it loses?
Why 1:2 Became a Rule—and Why It Shouldn't Be One
A fixed ratio feels useful because it appears to solve two problems at once. If every winner makes twice what every loser loses, the trader seems to need fewer winning trades. That logic is useful, but it becomes misleading when the ratio is treated as sufficient evidence of an edge.
Profitability comes from win rate × average win versus loss rate × average loss. Lower win rates can be supported by larger winners, while smaller winners can be supported by higher win rates. The ratio does not create the edge; it determines the win rate the edge has to support.
The Breakeven Win-Rate Table
Ignoring trading costs for the moment:
| Average reward for each 1R loss | Theoretical breakeven win rate |
|---|---|
| 0.25R | 80.0% |
| 0.50R | 66.7% |
| 0.75R | 57.1% |
| 1.00R | 50.0% |
| 1.50R | 40.0% |
| 2.00R | 33.3% |
| 3.00R | 25.0% |
| 4.00R | 20.0% |
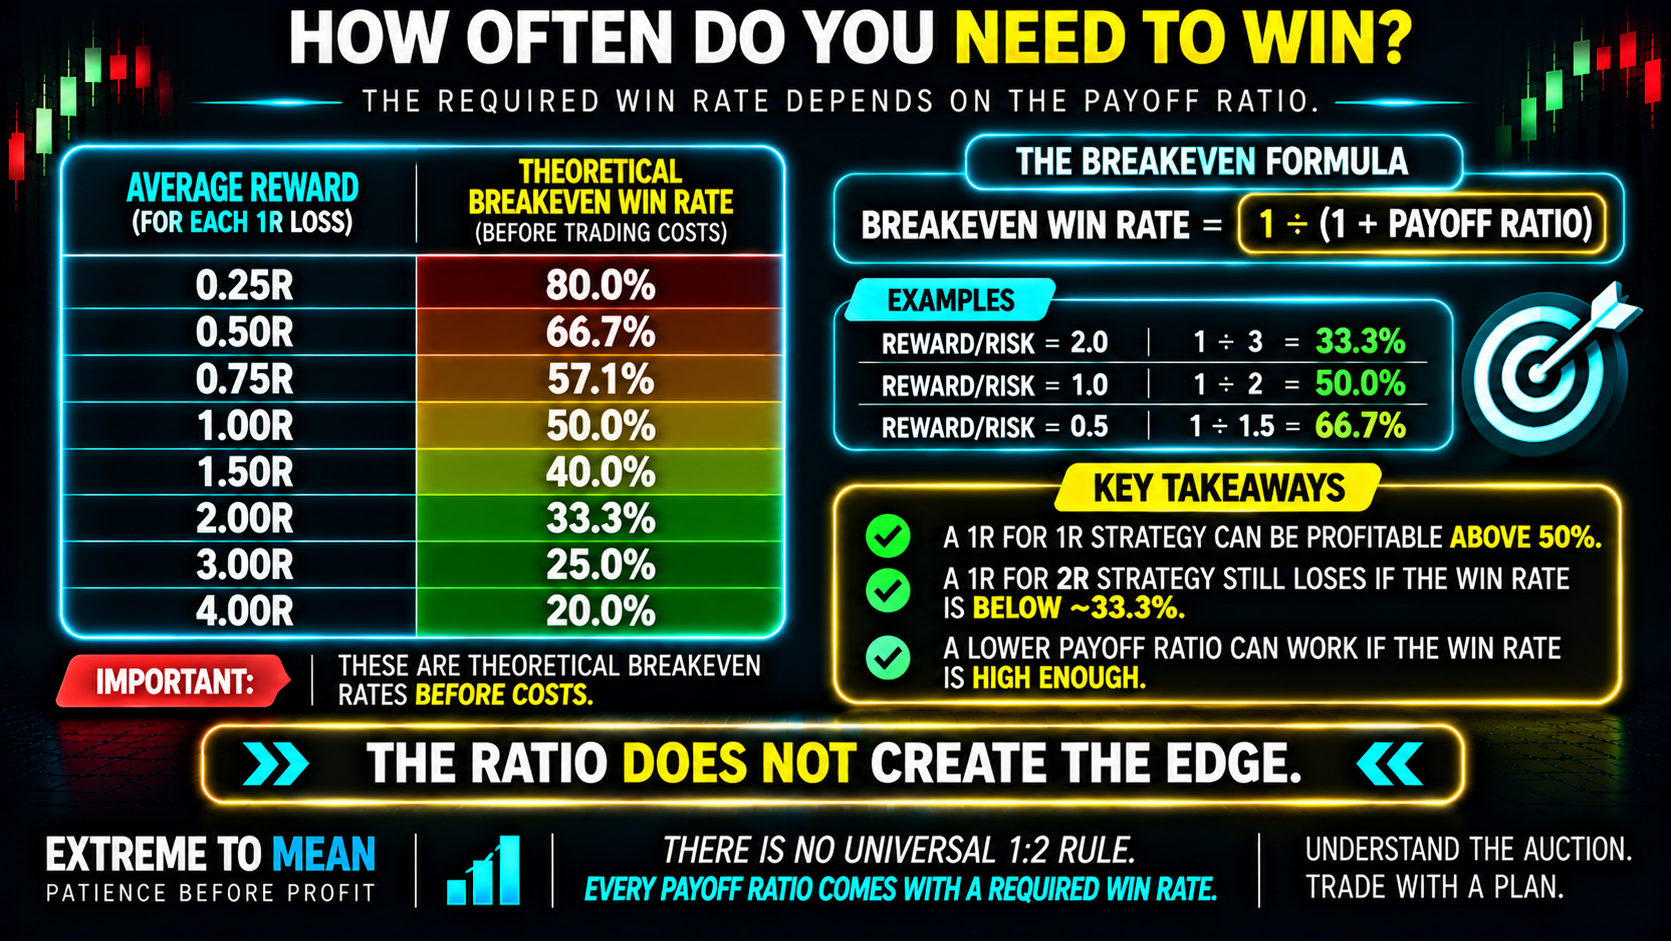
The table shows why no universal 1R-for-2R rule can fit every strategy. A 1R-for-1R strategy can be positive above 50% before costs, while a 0.5R-for-1R strategy can be positive above roughly 66.7%. A 2R average winner can still lose if wins fall below about one-third.
If P = average reward ÷ average risk, the frictionless breakeven win rate is 1 ÷ (1 + P). A payoff ratio of 2.0 therefore needs about 33.3% wins to break even before costs; 1.0 needs 50%; and 0.5 needs about 66.7%. A lower payoff ratio raises the required win rate—it does not make profitability impossible.
Theoretical Breakeven Is Not Live Profitability
The table is a mathematical floor before friction, not a live-performance target. Commissions, fees, spread, and slippage move the breakeven line against the trader. A 1R-for-1R strategy therefore needs more than exactly 50% once real costs are included.
Those costs do not affect every strategy identically. Small-payoff or high-frequency systems may surrender more of their gross edge to friction. Use actual net results, not only clean theoretical ratios.
A 1:1 Strategy Can Make Money
Suppose a strategy wins 55% of trades, averages +1R on winners, and averages −1R on losers. Before costs, expectancy is (0.55 × 1) − (0.45 × 1) = +0.10R per trade. Symmetrical payoff does not imply zero expectancy unless the win probability is symmetrical too.
That does not prove a particular 1:1 strategy will remain profitable. It only disproves the claim that 1:1 is inherently unprofitable. The real question is whether the strategy can sustain the necessary net win rate across a meaningful sample.
A 1R-for-2R Strategy Can Still Lose
Now suppose a strategy wins 30% of trades, averages +2R on winners, and averages −1R on losers. Expectancy becomes (0.30 × 2) − (0.70 × 1) = −0.10R per trade before costs. A beautiful payoff ratio cannot rescue an entry that does not win often enough.
This is why what an edge actually is matters more than the visual attractiveness of a stop-and-target box. WIN RATE ≠ EDGE, and R:R ≠ EDGE. The edge is in the combination produced by the full process.
Why Forcing a Bigger Target Can Make a Good Strategy Worse
Suppose a setup historically wins 60% of the time with +1R average winners and −1R average losers, producing +0.20R expectancy before costs. Then the trader moves every target to +2R because “professional trades need at least 1:2.” If only 30% of trades now reach the farther target, expectancy becomes −0.10R.
The advertised ratio improved while the strategy got worse. Demanding more reward can reduce the probability of receiving any reward at all. You cannot change the payoff and assume the win rate will stay frozen.
Can “Negative Reward-to-Risk” Work?
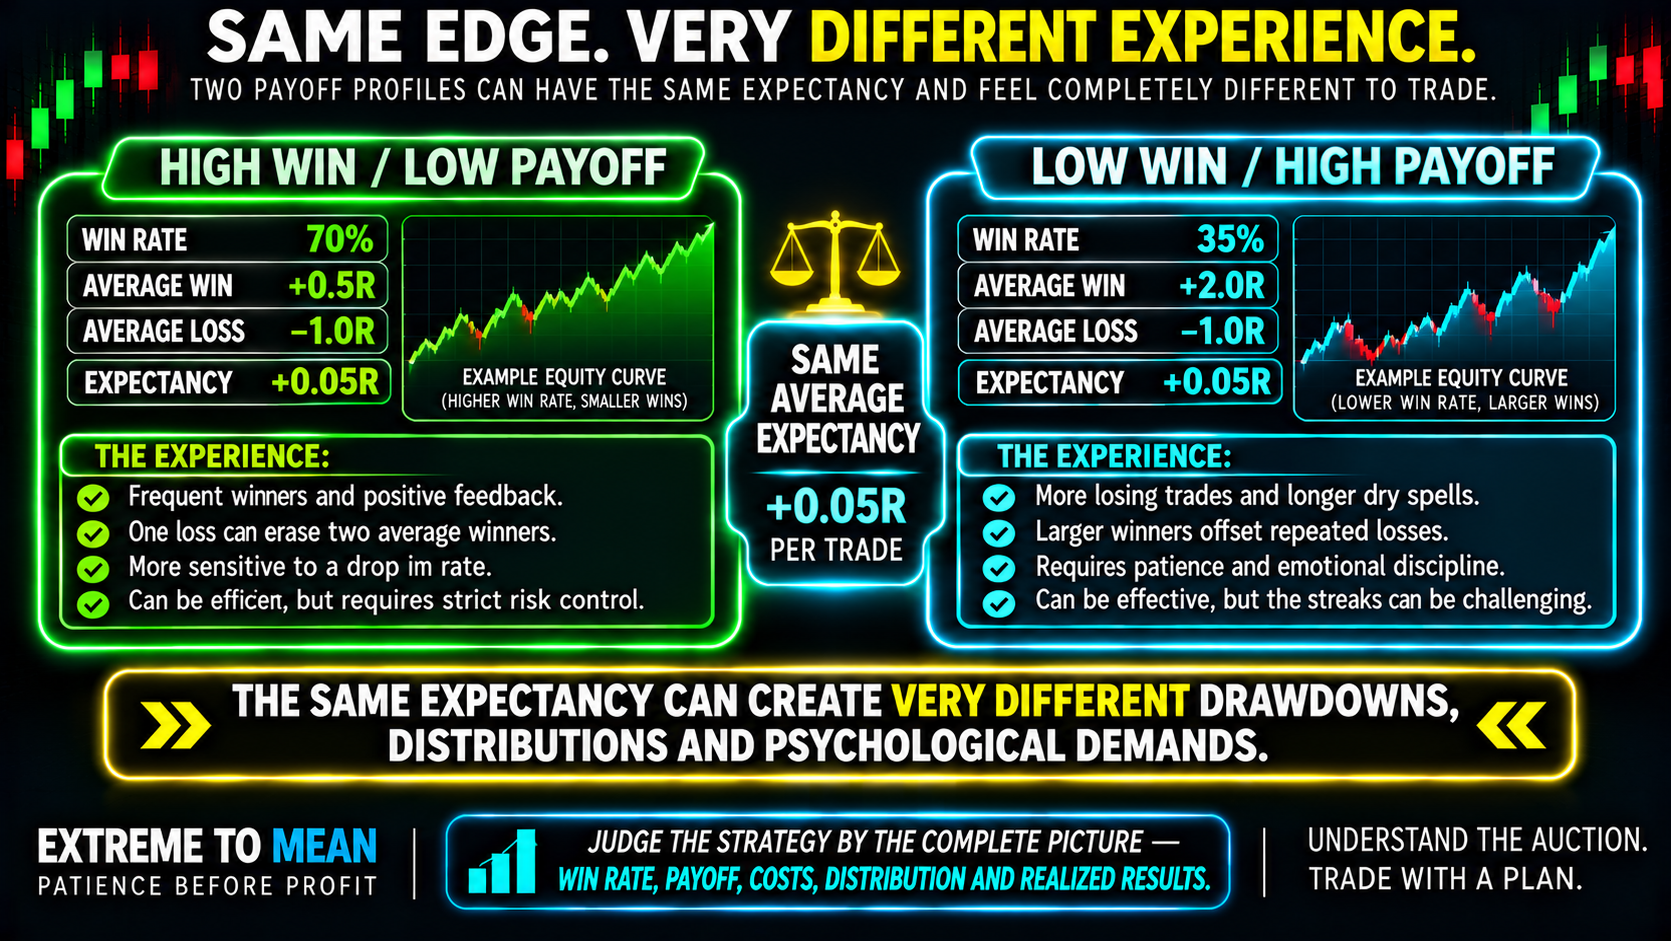
Traders often use that phrase for a profile where the average winner is smaller than the average loser. Imagine a strategy that wins 70% of trades, averages +0.5R on winners, and loses −1R on losers. Its frictionless expectancy is (0.70 × 0.5) − (0.30 × 1) = +0.05R per trade.
Mathematically, that profile can work, but one full 1R loss erases two 0.5R winners. It can therefore be more sensitive to a drop in win rate, larger-than-planned losses, or rising costs. An unattractive payoff ratio can still produce positive expectancy, but with less room for error.
High win rate does not automatically mean low risk. Frequent small winners can conceal vulnerability to infrequent outsized losses, though a low-payoff strategy with hard, reliably executed stops does not automatically have catastrophic tail risk. Negative skew is a distribution question—not an insult attached to every high-win-rate strategy.
Same Expectancy, Very Different Trading Experience
Consider two strategies with the same theoretical expectancy. Strategy A wins 70% of trades, averages +0.5R on winners, and loses −1R, producing +0.05R. Strategy B wins 35%, averages +2R on winners, and loses −1R, also producing +0.05R.
The mathematics may match while the experience does not. Strategy A gives each full loss more power to erase prior winners; Strategy B produces more losing trades and requires patience through misses. A mathematically sound payoff profile still has to be behaviorally executable.
Planned R:R and Realized Payoff Are Not the Same
A trader may describe a system as “1:2” because every chart begins with a 2R target. Early exits, partials, missed targets, slippage, or execution errors can make realized averages very different. Expectancy uses what the trading record actually produced.
The strategy's payoff ratio should therefore use realized average win ÷ realized average loss. Your trade plan has a target ratio; your trading history has a realized payoff ratio. The second one determines expectancy.
This is also why the trade is not ready until the risk is clear. Planned risk and reward define the trade before entry, while the journal later reveals what the process actually delivered. PLANNED R:R ≠ REALIZED PAYOFF.
The Payoff Profile Check
Before judging a strategy by its reward-to-risk ratio, ask:
- What is the actual win rate across comparable trades?
- What is the realized average winner?
- What is the realized average loser?
- What is the theoretical breakeven win rate for that payoff?
- What do costs do to the breakeven point?
- How sensitive is the edge to a small drop in win rate?
- How sensitive is it to a reduction in average win?
- What do the worst losses look like?
- Can I behaviorally execute the losing streaks this profile creates?
- Am I changing targets to improve the economics—or merely to make one statistic look prettier?
A higher win rate is not automatically better if it was purchased by shrinking winners too far, and a larger target is not automatically better if too few trades reach it. Optimize the economics—not the statistic you enjoy looking at.
Let the Market Help Define the Target
A trader should not say, “My rule is 1R risk for 2R reward, therefore the target must be here.” Define a realistic target from structure and context, then ask whether the available reward is supported by the setup's historical hit rate. The market should help define the target; the ratio should help decide whether the trade is worth taking.
If correct invalidation is 20 points away and realistic reward before major resistance is only 10 points, the available payoff is 0.5. That can work mathematically, but if the setup's historical win rate does not support it, the decision is PASS. A poor trade does not become good because the stop and target are redrawn until the ratio looks respectable.
A trading plan made before the session can make those criteria explicit. Its job is not to force every setup into one universal ratio. It should define what combination of location, invalidation, realistic target, and evidence earns risk.
The ETM Win Rate → Payoff → Cost → Distribution → Expectancy Framework
Use WIN RATE → PAYOFF → COST → DISTRIBUTION → EXPECTANCY. Ask how often the strategy wins, how large realized winners are relative to losses, what friction removes, and what the distribution looks like. Include unusually large losses and losing streaks.
Only then evaluate expectancy and decide KEEP / ADJUST / REJECT. A strategy that survives only at one perfect win rate or one perfect average winner may have less margin for error than the headline expectancy suggests. Judge the combination—not the ratio in isolation.
The ETM free tools can support that review, but the record reveals the payoff profile. The strategy's payoff ratio is discovered in the journal—not declared in the trade plan. That distinction matters.
Final Thought
There is nothing magical about risking 1R to make 2R. That payoff needs to win roughly one-third of the time before costs just to break even; a 1R-for-1R profile needs roughly half its trades to win, while a strategy averaging only 0.5R for each 1R loss can still be positive if its win rate is high enough.
The important question is whether the strategy's actual win rate, realized average win, realized average loss, and trading costs combine into positive expectancy over a meaningful sample. Even then, expectancy is not the entire story: high-win, low-payoff systems can be sensitive to rare large losses, while low-win, high-payoff systems can demand long stretches of being wrong.
Let market structure define realistic targets. Let the journal reveal the payoff the strategy actually achieves. Then judge the complete distribution—not a universal 1R-for-2R rule borrowed from someone else's strategy.
Educational content only. Trading involves substantial risk and is not suitable for everyone.