
Financial markets continuously discover prices through interaction between buyers and sellers. Auction Market Theory, or AMT, gives traders a framework for organizing that process so candles are not viewed simply as isolated patterns bouncing between arbitrary lines. Inside The Market, the purpose is context: understand what the auction appears to be doing before trying to qualify a trade.
What Auction Market Theory Actually Is
Auction Market Theory is a trader's framework for interpreting price discovery as a continuous auction. Buyers submit bids, sellers submit offers, orders interact, transactions occur, and available prices continually adjust as participation, supply, demand, and new information change. CME describes price discovery as an ongoing process created by buyer and seller interaction in an auction-type futures environment where bids and offers continuously change. (cmegroup.com)
AMT is not an indicator, trading signal, prediction model, or guarantee that price eventually returns to some objectively correct value. Market Profile and Volume Profile are also not Auction Market Theory itself; they are ways traders can visualize aspects of activity that the framework tries to interpret. The theory is better understood as a language for asking where trade is developing comfortably and where the market appears to be searching for something different.
The framework is closely associated with J. Peter Steidlmayer and the development of Market Profile at the Chicago Board of Trade, drawing on ideas later documented in Markets and Market Logic and Steidlmayer on Markets. The history does not need to become the lesson. More important is understanding that this is a practitioner framework for organizing market behavior rather than a scientific law that dictates what price must do. That distinction keeps AMT useful without giving it more predictive authority than it deserves.
What It Means to Say the Market Is an Auction
The word auction can sound more theoretical than it really is. In an exchange-traded futures market, participants continually bid for contracts and offer contracts for sale, and a trade occurs when orders can match at an agreed price. CME explains that futures prices are discovered through bidding and offering until a match occurs, which is the mechanical foundation underneath the auction metaphor. (cmegroup.com)
This is also why saying that price rises because there are simply "more buyers than sellers" is misleading. Every completed trade has both sides, so the more useful questions involve which side is demanding immediacy, where liquidity is available, whether resting orders can absorb that pressure, and whether transactions can continue around the current prices. CME's discussion of liquidity similarly distinguishes the need for immediacy from the supply of liquidity available to satisfy it. (cmegroup.com)
Within AMT, imbalance therefore does not mean trades somehow stop having both a buyer and a seller. It describes an environment in which the previous region is no longer comfortably containing activity and price begins repricing directionally. That connects naturally to the deeper mechanics discussed in how the stock market actually moves through auction, liquidity, and emotion.
Value Means Acceptance, Not One Correct Price
The word value causes trouble because it can sound like the market has discovered a mathematically correct fair price. That is not the useful interpretation here. In Auction Market Theory, value is better treated as an observed area where the market has demonstrated meaningful acceptance through activity such as time spent, repeated transactions, or volume.
Different tools can display that activity differently. Market Profile emphasizes how the auction developed through time at price, while Volume Profile organizes activity by volume traded at different prices. Those distinctions will matter more in their dedicated lessons; for now, the important idea is that both are attempting to help the trader visualize where business occurred rather than announce where price belongs.
Value is therefore descriptive, not prophetic. An area that attracted substantial business yesterday can remain an important reference today, but nothing requires the market to continue accepting it. This fits the same principle behind Extreme to Mean's broader teaching: prior activity can matter without becoming a force that controls the future.
Acceptance and Rejection Change How You Read a Level
Acceptance describes an area where price enters and the market demonstrates an ability to continue doing business there. Evidence might include time being spent around the area, repeated rotation, volume building, or a breakout holding while new activity develops beyond the old boundary. There is no universal rule such as two candles above a level or a specific amount of volume that automatically proves acceptance.
Rejection describes the opposite behavior: price tests an area but fails to sustain meaningful business there and moves away. A brief excursion beyond a boundary, a quick return, or repeated failure to remain outside an area can contribute to that interpretation. A wick by itself, however, does not prove rejection because one candle is evidence rather than the entire auction.
That distinction can improve the way traders think about traditional support and resistance. Instead of saying "resistance broke" and immediately assuming continuation, ask whether the market actually accepted trade above the old boundary; instead of saying "support held," ask whether lower prices were genuinely rejected or whether price merely paused. The decision process becomes area tested → response observed → interpretation updated rather than line touched → reaction expected.
Balance, Imbalance, and the Search for a New Area
A balanced market is an environment where the current region continues facilitating two-way business. Price may overlap repeatedly, rotate through similar prices, struggle to sustain directional extension, and accumulate activity inside a recognizable area. Balance is not necessarily useless chop; it tells the trader that the market is still conducting meaningful business in roughly the same region.
An imbalanced market begins behaving differently. Price starts discovering away from the prior area with greater directional progress, less overlap, and potentially new acceptance beyond old boundaries. This is closely related to the distinction between environments explored in The Three Market States, but AMT gives us another way to describe the transition: the previous auction is no longer containing activity effectively.
The useful visual sequence is Balance → Imbalance → New Balance. ES might rotate repeatedly between 6,000 and 6,015, move above that region, explore higher prices, and eventually begin conducting substantial business around 6,025–6,035. The trader does not need to predict the new accepted area while price is still leaving the old one; the job is to observe how the auction develops.
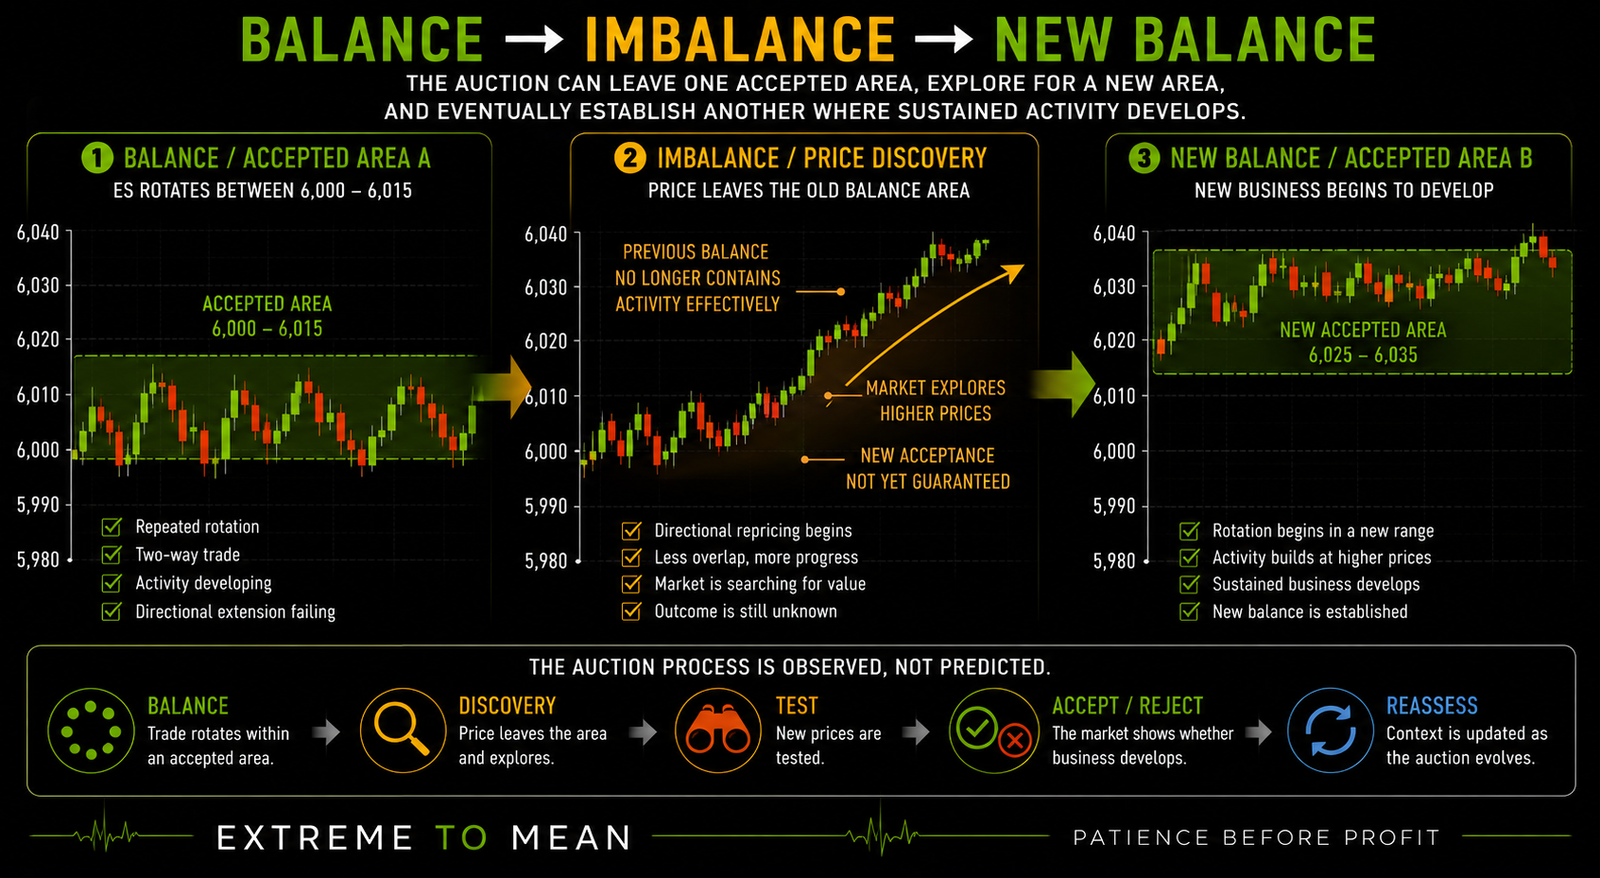
Price discovery is the bridge between those areas, but it does not have to be clean. It can be fast, slow, erratic, news-driven, thin, volatile, or abruptly reversed, which is why saying that price "must travel from one fair-value area to another" gives the framework too much certainty. CME's definition is simpler: price discovery develops through the interaction of buyers and sellers as bids, offers, and transactions establish current tradable prices. (cmegroup.com)
The important consequence is that the auction is a process, not a label you apply once in the morning and defend all day. Yesterday's accepted value can lose relevance, a balanced market can become imbalanced, and an attempted repricing can fail and return to the previous region. Context has to be reassessed as new information develops.
Previous Value Is a Reference, Not a Magnet
Areas of heavy prior activity can be useful because they show where the market previously found enough participation to conduct substantial business. That does not mean price is gravitationally attracted to them or obligated to return. The same caution applies to Point of Control as an observed activity reference under a particular profile methodology rather than a guaranteed destination.
This is especially important for Extreme to Mean because the phrase return to value can easily become another version of "the mean is a magnet." A balanced environment may make rotational or mean-reversion thinking more coherent, but balance does not automatically mean fade the extremes. Location, room, structure, invalidation, and current conditions still determine whether a recognizable environment produces a usable trade.
The inverse is true during imbalance. Recognizing directional repricing may make continuation thinking more logical, yet a trader who notices that condition only after a large extension may already have poor location, wide required risk, or little remaining room. Context can make a trade idea more logical without making the entry itself tradable.
Auction Market Theory Is Not Market Profile
Auction Market Theory is the conceptual framework. Market Profile is one method for visualizing how the auction developed through time at price, while Volume Profile organizes traded volume by price. A footprint chart goes more granular still by displaying transaction and order-flow information at individual price levels.
Keeping those jobs separate prevents the tools from becoming the theory. Point of Control, Value Area High, Value Area Low, profile shapes, and footprint imbalances may all eventually provide useful information, but none needs to be mastered to understand the core auction concept. The foundation is simply that price continually tests areas and traders observe whether business develops there or fails to develop.
This also prevents a visual midpoint, VWAP, moving average, POC, and profile value area from being treated as interchangeable definitions of "value." Each measures or describes something different. The useful question is not which line represents the market's one true fair price, but what the selected reference tells you about the activity that actually occurred.
The Same Breakout Can Produce Two Different Auctions
Suppose ES has been rotating between 6,000 and 6,020 before trading up to 6,025. Traditional breakout thinking can make the move above 6,020 feel decisive, but Auction Market Theory treats that print as the beginning of new information rather than the conclusion. The better question is what happens after price leaves the old region.
In Scenario A, ES trades 6,025, then falls quickly through 6,015 toward 6,010 and struggles to regain the old high. The market did test above the range, but meaningful business did not sustain there, giving the trader evidence of rejection rather than automatic evidence of a full reversal. The next move remains uncertain because rejection tells us what happened during the test, not the entire future path.
In Scenario B, ES trades 6,025, moves to 6,030, pulls back only to 6,026, and then advances toward 6,034 while activity begins building above the old range. That behavior provides stronger evidence that the market may be accepting higher prices and establishing business outside its prior balance. The important distinction is not simply whether resistance broke but whether trade developed after the break.
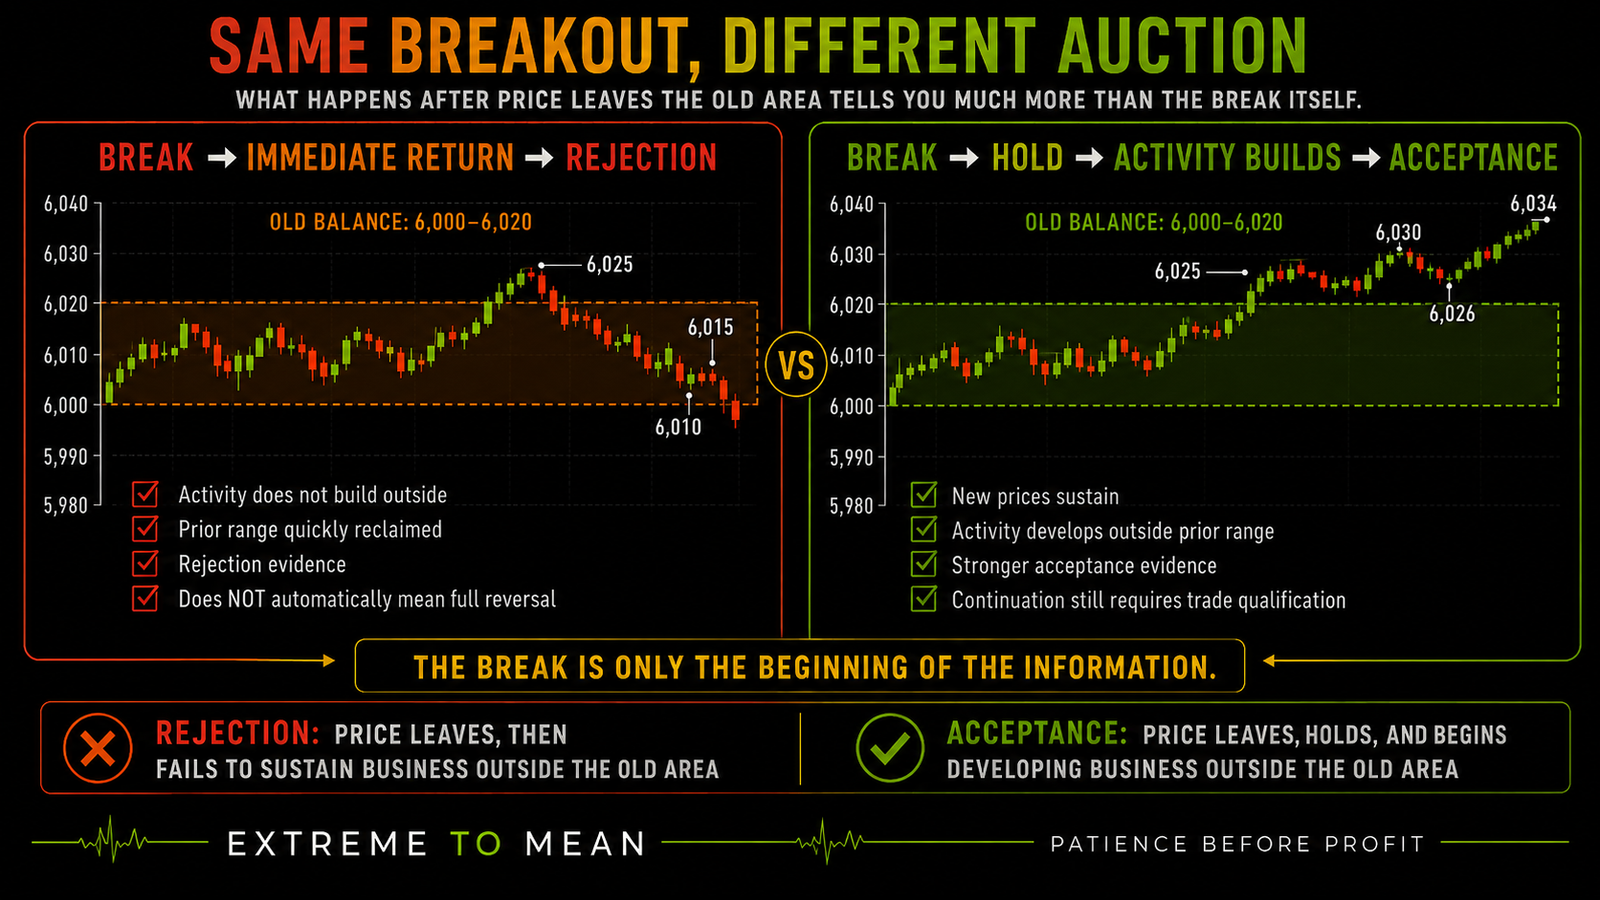
This is where context before the candle becomes especially important. The exact same breakout candle can lead to different interpretations depending on what the market does around it afterward. AMT encourages the trader to keep collecting evidence instead of declaring the meaning of the auction from one print.
Use an Observe-First Auction Decision Stack
A practical way to apply the framework is Reference → Test → Response → Acceptance/Rejection → Context → Trade Qualification. The sequence deliberately keeps Auction Market Theory upstream of the actual trade decision. It is designed to organize evidence before entry logic begins.
- Reference: Identify an area that matters.
- Test: Let price interact with that area.
- Response: Observe what actually happens there.
- Acceptance or Rejection: Is business developing, or is price failing to remain?
- Context: Is the broader auction balanced, imbalanced, transitioning, or unclear?
- Trade Qualification: Only now ask whether location, room, invalidation, and risk make a setup usable.
| Concept | What It Means | What It Does Not Mean |
|---|---|---|
| Price discovery | Buyers and sellers continuously establish tradable prices | Price is finding one permanently correct price |
| Value | Area showing meaningful prior acceptance or activity | Guaranteed fair value |
| Acceptance | Trade continues developing around or through an area | One candle closed above a line |
| Rejection | Price fails to sustain business in an area | Every wick predicts reversal |
| Balance | Repeated two-way trade within an accepted region | Guaranteed mean reversion |
| Imbalance | Directional repricing away from prior balance | More buyers exist than sellers |
| POC | Highest-activity price under the selected profile methodology | A guaranteed magnet |
| Profile | Visualization of auction activity | Auction Market Theory itself |
The better question is not, "Where is price going next?" Ask: "Is the market facilitating trade around the current area, rejecting this area, or searching for somewhere else?" Then add the question that protects you from becoming attached to the interpretation: "What evidence would make me change my mind?"
Final Thought
Auction Market Theory does not make markets predictable. It gives traders a cleaner way to describe what price and participation appear to be doing: discovering, testing, accepting, rejecting, balancing, and repricing. That language can improve context without eliminating the need for setup qualification or risk management.
The deeper benefit is a shift from prediction toward observation. Instead of deciding that support must hold, a breakout must continue, POC must attract price, or balance must mean reversion, the trader watches how the market responds and updates the interpretation as the auction develops. That is a better fit with the Extreme to Mean principle that the trader's job is to evaluate rather than react.
Before deciding what the market should do next, ask whether you can identify where it has actually accepted trade, where it has rejected price, and whether the current auction is still balancing or searching for a new area. Readers who want to continue building that context-first view of market behavior can explore Decode the Market, where trend, volatility, participation, and broader conditions are treated as part of one market-reading process.
Educational content only. Trading involves substantial risk and is not suitable for everyone.