
A Volume Profile organizes traded volume across price, and its Point of Control identifies the price or profile row containing the largest concentration of that volume. That makes POC a useful historical reference, but it does not automatically make the level fair value, support, resistance, a target, or a price magnet. Inside The Market, the cleaner process is to understand what created the reference first and then observe what the current market actually does around it.
What Point of Control Actually Is
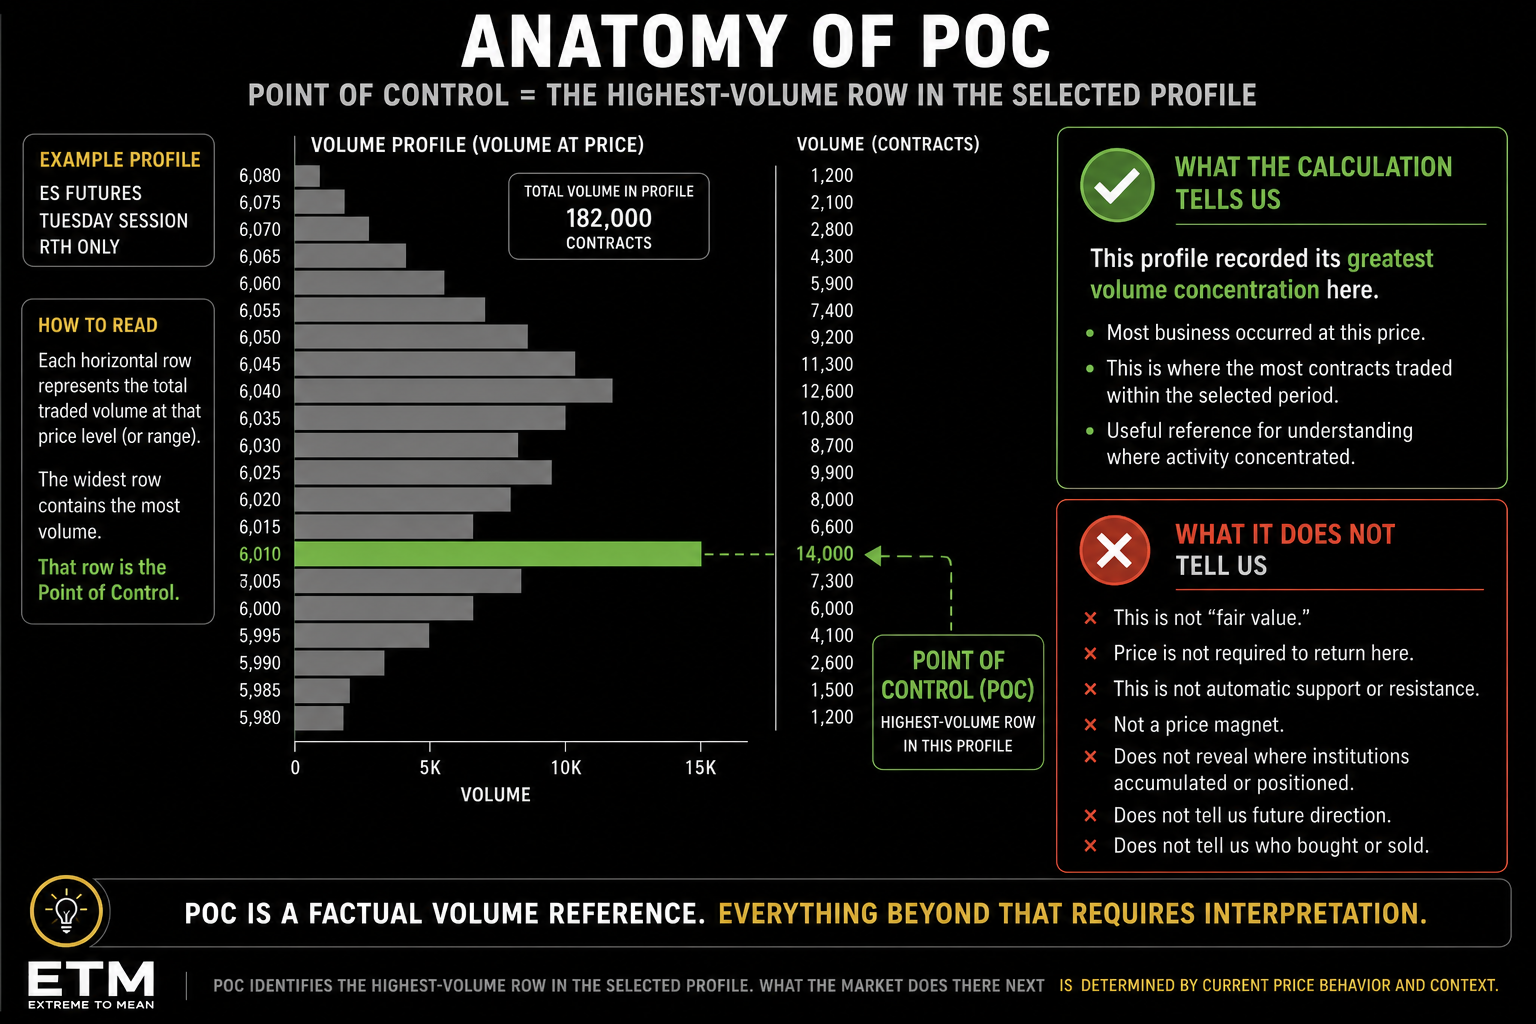
In a Volume Profile, the Point of Control, or POC, is the price level or profile row containing the greatest amount of traded volume within the selected profile. TradingView uses essentially this definition, while NinjaTrader similarly describes POC as the largest data point in the profile. The basic idea does not require a complicated theory.
Suppose the selected profile records 8,000 contracts around Price A, 14,000 around Price B, and 6,000 around Price C. Under that profile configuration, Price B would become the POC because it contains the largest volume concentration. That is what the calculation tells us; everything else requires interpretation.
This is why the broader Volume Profile lesson should come first. POC is not an independent market concept floating above the chart; it is a statistic produced by a particular Volume Profile. Before asking what the POC means, you need to know what data created it.
A POC Belongs to a Specific Profile
There is no single universal “ES POC.” A trader can calculate today’s session POC, yesterday’s POC, a weekly POC, a monthly POC, a fixed-range POC, a visible-range POC, or a multi-session composite POC. Each is built from a different market sample and can therefore produce a different answer.
Imagine Monday’s session POC is 6,010, Tuesday’s is 6,045, and a five-day composite produces 6,028. None of those levels is inherently more correct because they describe different distributions. A POC cannot be separated from the period used to calculate it.
The same issue applies to futures-session definitions. A Regular Trading Hours profile can produce a different POC from one built with the full electronic session because the two profiles contain different transactions. If two traders disagree about the “daily POC,” the first question should be whether they profiled the same session.
A Precise Line Can Still Contain False Precision
POC is often displayed as one beautifully clean horizontal line, which makes it easy to think the market identified one exact price as uniquely important. In practice, profile software can aggregate nearby prices or ticks into rows. NinjaTrader, for example, allows ticks-per-level settings that can affect how volume is grouped.
That means a displayed POC can be precise within a particular platform configuration without being universally precise across every chart. Data feeds, profile period, trading-hours template, row aggregation, resolution, and other settings can all influence the result. The factual statement is that the displayed POC represents the highest-volume row produced by the selected profile methodology.
This is especially useful to remember when comparing platforms. Slightly different POCs do not automatically mean one chart is wrong. They may simply be calculating the distribution differently.
POC Is a Fact; “Fair Value” Is an Interpretation
We can say factually that the selected profile recorded more volume at its POC than at any other row. We cannot move from that statement directly to “therefore, this was the market’s true fair value.” Fair value can mean many different things in finance, while POC is fundamentally a volume-distribution statistic.
A better formulation is that POC identifies concentrated historical participation. Calling that concentration fair value adds an interpretation the raw volume calculation does not prove. The distinction matters because descriptive data should not quietly become predictive theory.
The same caution applies to institutional explanations. High volume at POC does not tell us whether institutions accumulated there, whether retail traders dominated activity, whether positions were being opened or closed, or who remains positioned now. As explained in what volume and liquidity mean, volume records transactions; it does not reveal the identity or intention of every participant behind them.
Every completed futures transaction also has both a buyer and a seller. High volume therefore does not justify saying “huge buying occurred at POC” simply because the profile is wide there. The cleaner conclusion is that a lot of trading occurred around that price relative to the rest of the selected sample.
POC Earns Attention, Not Obedience
Suppose yesterday’s POC was 6,020 and today ES falls from 6,050 toward that level. Weak reasoning says, “POC is support, so buy.” Better reasoning says that yesterday’s largest concentration of volume occurred around 6,020 and the current market is now testing that historical reference.
Several outcomes remain possible. Price can bounce, stall, chop through the area, trade straight through, break and reclaim, or break and continue lower. The prior POC gave the trader a location to observe; it did not provide the outcome.
The same reasoning applies when price approaches from underneath. POC is not automatically resistance simply because it is overhead. POC earns attention—not obedience.
POC Is Not a Magnet
One of the most common stories around Point of Control is that price is somehow attracted back toward it. The metaphor sounds intuitive because substantial business occurred there previously, but the POC calculation contains no gravitational mechanism. Price can return to an old POC, remain above it, remain below it, or establish an entirely new distribution elsewhere.
An old POC can still be relevant without becoming a magnet. It may overlap with prior balance, Value Area, support or resistance, session structure, or another heavily traded region, and market participants may continue paying attention to the area. That is very different from saying price is mathematically required to revert toward it.
This connects directly to the broader Extreme to Mean principle that the mean is not a magnet. Historical references can organize context without controlling future price. POC deserves the same restraint.
Previous POC and Developing POC Are Different References
A completed profile has a completed POC. Once yesterday’s session ends, yesterday’s POC becomes fixed under that profile’s calculation and settings. A developing POC behaves differently because new volume continues entering the current distribution.
Suppose the early-session developing POC is 6,000. Later, substantial activity begins accumulating around 6,018, and eventually that row contains more volume than the earlier concentration. The developing POC can then migrate from 6,000 to 6,018.
That shift does not mean the indicator suddenly became bullish. It means the session’s largest concentration of traded volume moved higher. Interpretation should come afterward, alongside price structure, trend, volatility, pullbacks, and other session context.
The reverse warning matters too. A static developing POC can be consistent with concentrated activity around one region, but it does not guarantee a range day. POC is one description of the distribution, not a complete diagnosis of market state.
POC, Value Area, HVNs, VWAP, and TPO POC Are Not the Same Thing
POC is one row representing the maximum volume concentration in the selected Volume Profile. Value Area is a broader region containing a configured share of the profile’s total volume, so POC and Value Area should not be treated as interchangeable. A profile can also contain several High-Volume Nodes even though it generally has one Volume POC.
POC and VWAP answer different questions too. POC identifies the single profile row containing the greatest volume concentration, while VWAP calculates a volume-weighted average across the selected calculation period. The two can sit close together or diverge considerably without either one invalidating the other.
Volume POC must also remain separate from TPO POC. The Volume Profile vs. Market Profile comparison explains that Volume POC identifies the greatest transaction-volume concentration, while TPO POC identifies the greatest time-price-opportunity concentration. Similar terminology does not make them the same measurement.
What Matters Most Is the Interaction
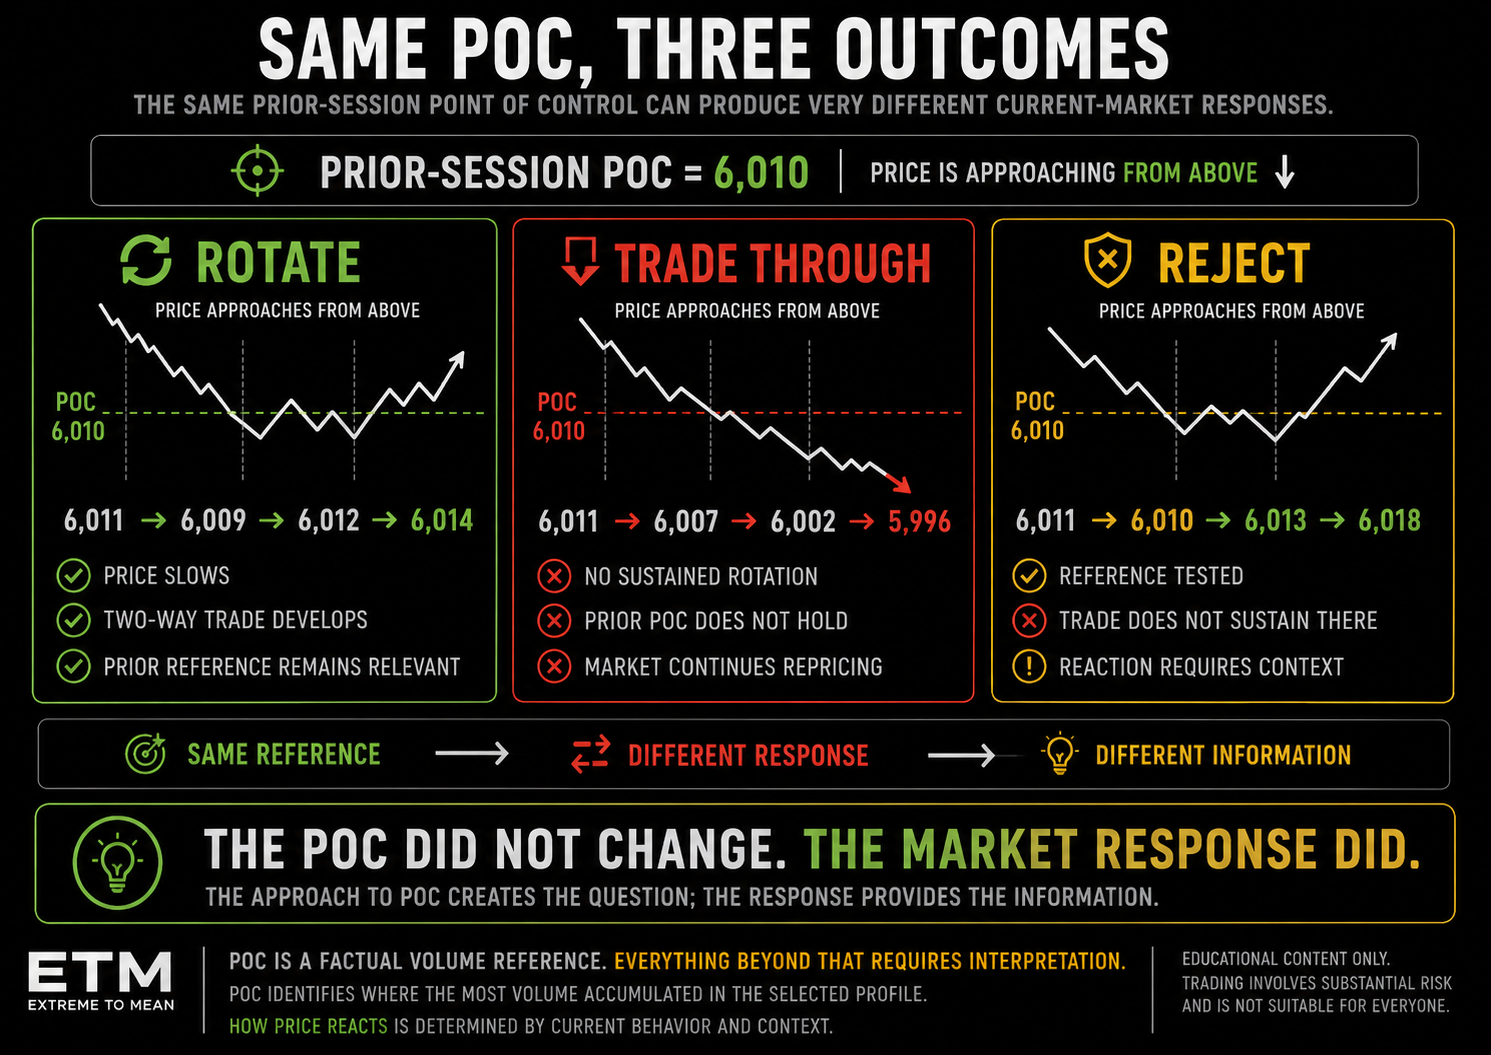
The practical centerpiece of POC trading should not be predicting what the level will do. It should be observing what happens when price gets there. The approach to POC creates the question; the market’s response supplies the new information.
Imagine yesterday’s ES POC is 6,010 and today opens at 6,035 before trending lower. In one outcome, price reaches the area and trades 6,011 → 6,009 → 6,012 → 6,014, beginning to rotate around the prior reference. That is useful evidence of one kind of response.
In another outcome, price reaches the same POC and trades 6,011 → 6,007 → 6,002 → 5,996 without sustained rotation. The reference did not change, but market behavior around it did. The level did not determine the trade; the interaction supplied new evidence.
That observation-first process fits the broader Auction Market Theory framework. Acceptance, rejection, balance, and repricing are determined by developing market behavior rather than by assigning a predetermined outcome to one historical line. POC gives the trader somewhere worth looking.
Distance From POC Is Context, Not a Reversal Signal
Mean-reversion-minded traders can also get into trouble when current price is far from an old POC. If ES is trading at 6,060 while a prior POC sits at 6,010, it can be tempting to conclude that price is “too far from value” and therefore should revert. Nothing in the POC calculation supports that conclusion by itself.
Price may be repricing after major news, trending, breaking higher-timeframe structure, entering a new volatility regime, or building an entirely new distribution. An old POC can remain visible while the market has moved on to a different auction. Distance from POC is context—not a reversal signal.
The same restraint should be used with “naked” or untested POCs. An untested prior POC simply means price has not revisited that completed profile’s POC since the period ended. Saying the market has “unfinished business” there or must eventually fill the level adds a trading belief that the POC calculation itself does not establish.
A Practical POC Evaluation Stack
Use Profile → POC → Context → Test → Response → Trade Qualification. The sequence keeps the historical reference upstream of the actual trade decision. It prevents the process from collapsing into POC → entry.
- Identify the POC: Session, prior session, weekly, composite, or another profile?
- Understand the sample: Which trading hours, period, and settings created it?
- Read the approach: Is price trending into the level, rotating around it, or opening directly on it?
- Observe the interaction: Does price stall, reject, accept, reclaim, or ignore the area?
- Add context: What do market state, volatility, structure, and nearby references say?
- Check room: If a setup develops, is there useful space for it to work?
- Define invalidation: Where would the trade thesis actually be wrong?
- Decide: Only now determine whether the behavior deserves risk.
| Statement | What POC Actually Supports | What It Does Not Prove |
|---|---|---|
| “POC had the most volume” | Yes, within the selected profile methodology | That it is true fair value |
| “A lot of business occurred here” | Yes | That institutions accumulated there |
| “This area deserves attention” | Reasonable contextual use | That price must react |
| “Price may revisit it” | Possible | That POC is a magnet |
| “POC can be a reference” | Yes | Automatic support or resistance |
| “Developing POC moved higher” | Highest-volume concentration shifted higher | Automatic long signal |
| “Prior POC is untested” | Price has not revisited it since completion | Market must fill unfinished business |
| “POC and VWAP overlap” | Two distinct references are nearby | Guaranteed confluence trade |
The better question is not “How do I trade the POC?” Ask: “What profile created this POC, what exactly does the level tell me about prior activity, and what is the market proving when it interacts with that area now?”
Then apply a second filter: “If I removed the POC line from the chart, would the actual price behavior still justify this trade?” If the answer is no, you may be trading the line rather than the market.
Final Thought
Point of Control matters for a specific reason. It tells you where the selected Volume Profile recorded its greatest concentration of traded volume, which can make the area useful for organizing context and focusing attention. It does not need ten additional powers added to it to be useful.
POC is not automatically fair value, institutional cost basis, support, resistance, a magnet, unfinished business, or a prediction of where price goes next. The profile tells you where business was concentrated; current market behavior tells you whether that historical reference matters now. The trader’s job is to observe the interaction and then decide whether the resulting behavior deserves risk.
When price reaches a Point of Control, ask whether you are trading because the market is actually showing you something useful there—or simply because the profile drew a line and you were taught that price is supposed to react. Readers who want to build the broader context-first process behind that distinction can continue with Decode the Market.
Educational content only. Trading involves substantial risk and is not suitable for everyone.