
Traders who are new to the process can start with a beginner's guide to turning an idea into a test before applying these mean-reversion-specific checks.
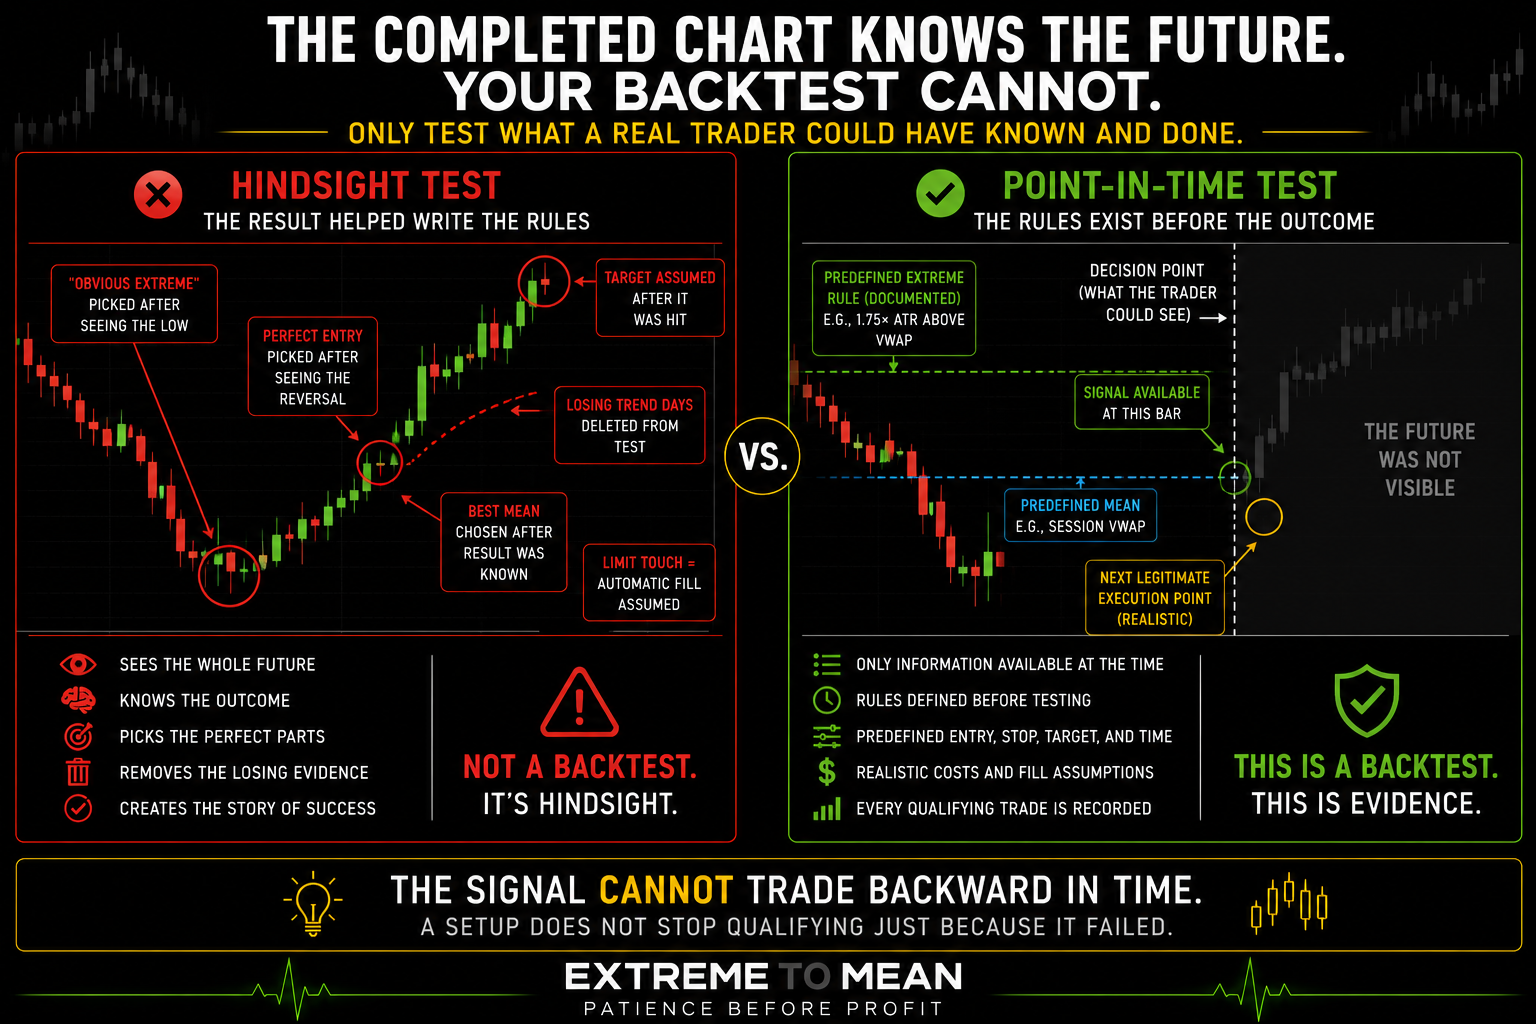
A backtest should ask whether a rule that could actually have been followed in real time produced useful historical results. Inside The Setup, that means defining the setup before seeing how each example ended. The finished chart should not be allowed to improve the simulated trader's decisions.
This matters especially for mean reversion because the reversal makes the earlier extension look obvious in hindsight. Once price has returned, the “right” extreme, entry, mean, stop, and target can all seem easier to identify. The completed chart knows the future; your backtest is only valid if the simulated trader does not.
What Backtesting Is Supposed to Do
Chart review and backtesting serve different purposes. Chart review helps traders study behavior, generate ideas, and understand examples, while a backtest applies predefined rules to a historical sample and records every qualifying outcome. Twenty beautiful screenshots can teach a concept, but they are still twenty selected examples.
A test should begin with a hypothesis rather than software. “Extreme markets revert” is too vague, while a useful hypothesis describes what qualifies as extreme, which mean matters, when a trade may occur, and what outcome will be measured. If those rules cannot be written before testing, they will tend to drift while the results are being observed.
The goal is not to produce the smoothest historical equity curve. It is to discover whether the proposed behavior survives consistent rules, losing examples, realistic trading friction, and different conditions. Examples can teach the idea; only a defined sample can test the idea.
Why Mean Reversion Is So Easy to Backtest Badly
The temptation begins when the researcher scrolls backward, notices a large move that snapped back, and labels it an “obvious extreme.” The reversal itself makes the earlier stretch look important because the outcome is already known. A live trader at the extreme did not have that advantage.
The same problem applies to the mean. As what the mean really is explains, VWAP, moving averages, anchored references, and other equilibrium measures are not interchangeable merely because price eventually reached one of them. If the mean changes whenever the trade fails, the strategy has no testable mean.
Mean-reversion research also invites outcome-based exceptions. A losing trade suddenly becomes “not a real extreme,” while a winning trade becomes proof that the concept works. If every loss creates a new explanation for why the setup should not count, the test is defending a belief rather than examining one.
Define the Mean, Extreme, and Time Horizon First
The test must define what counts as an extreme before the outcome is visible. That might involve point distance, percentage distance, ATR-normalized distance, a z-score, distance from VWAP, or another explicit measurement. You cannot measure an extreme with your eyes after you have seen the reversal.
The target also needs a fixed definition. If the strategy reverts toward a moving average or VWAP, decide whether the target is frozen at the entry-time value or continues updating as the reference moves. A moving mean can meet nearly stationary price, so the backtest must specify whether price, the reference, or both are allowed to create the “reversion.”
Time horizon is equally important. A day-trading setup that reaches the mean three days later did not necessarily produce a successful day trade, especially if the planned position would have been stopped or closed before then. A reversion that happens after the trade's defined time horizon is not a winning trade.
Session rules also belong in the definition. Full futures-session data, cash-session data, overnight trading, and specific intraday windows can produce different VWAPs, volatility, sample counts, and execution conditions. The tester should decide which session exists before examining which version creates better historical results.
Your Historical Trader Cannot Know the Future
Point-in-time data is non-negotiable. A 2026 Review of Financial Studies paper provides a current example of trading results being materially distorted when information unavailable at portfolio-formation time is used in historical research. If the simulated trader knew something the live trader could not have known, the test is contaminated. (academic.oup.com)
Signal timing is a common source of that contamination. If a five-minute setup requires a candle to close, the strategy cannot observe that closing information and then claim an earlier fill inside the same bar; event-based backtesting frameworks commonly delay action until information is actually available. The signal cannot trade backward in time. (interactivebrokers.com)
OHLC bars create another problem when a stop and target both sit inside the same candle's high-low range. The bar proves that both prices traded, but it may not reveal which occurred first. Finer data, a conservative predefined assumption, or another consistent rule is preferable to automatically awarding the favorable outcome.
Limit orders deserve similar skepticism. A historical low touching the limit price does not prove a particular resting order was filled because timing, queue position, and available liquidity can matter. “Price touched my order” is an assumption about a fill—not proof of a fill.
Failed Mean-Reversion Setups Must Stay in the Sample
Suppose the rules identify 100 qualifying extensions and 65 eventually revert while 35 continue far enough to stop the trade. A screenshot folder containing only the 65 successful reversions is not the strategy sample. A setup does not stop qualifying just because it failed.
Trend days are particularly easy to explain away because mean reversion naturally struggles when directional pressure persists. The three market states remind us that trend, chop, and reversion are different environments, but a regime is not an outlier merely because the strategy dislikes it. A predeclared trend filter is legitimate; deleting trend days after discovering their losses is not.
Economic-event days require the same discipline. If the strategy excluded CPI, FOMC, or other scheduled events before testing, that rule can be applied consistently; if those days are removed only after they damage performance, the sample has been rewritten around the result. If failure changes the definition, the strategy can never be wrong—and therefore can never be tested.
Overfitting Can Turn Historical Noise Into an “Edge”
A trader can test dozens of means, thresholds, stop multipliers, targets, sessions, timeframes, and filters until one combination looks exceptional. Bailey and colleagues describe this multiple-testing problem as backtest overfitting: searching enough strategy configurations can produce impressive simulated results that do not survive new data. Optimization can find an edge—or manufacture one. (papers.ssrn.com)
The number of unsuccessful variations matters. The best result among three sensible alternatives carries different evidence from the best result among three thousand combinations, even if only the winner appears in the final report. The best result means less when you had thousands of chances to find it.
Nearby parameter behavior can provide a useful robustness clue. If a strategy looks exceptional at 1.73 ATR but collapses at 1.70 and 1.76, that narrow peak deserves more skepticism than a broad area of reasonable performance. Edges usually deserve neighborhoods; magic numbers deserve skepticism.
Filters need a market reason as well. Adding Tuesday-only, an exact volatility band, a precise candle sequence, and a narrow time window can improve a backtest simply by deleting historical losers one by one. Every filter should solve a market problem rather than merely solve a backtest embarrassment.
Hold Back Data the Strategy Has Never Seen
In-sample data is used to develop the idea, choose rules, and adjust parameters. Out-of-sample data is deliberately withheld so the finished strategy can later be evaluated on history that did not help design it. If the holdout changes the strategy, it has started becoming development data.
Repeated peeking creates the same problem more slowly. Testing the holdout, changing a parameter, testing it again, and repeating until performance improves eventually trains the strategy on the supposedly unseen sample. Out-of-sample data stops being out-of-sample when you repeatedly use it to make design decisions.
Walk-forward testing carries that principle through time. Rules are developed on an earlier window, evaluated on a later window, and then the process advances chronologically so future periods remain unavailable until their turn arrives. It does not eliminate every research problem, but it better resembles the information sequence a real trader experiences.
This is also where what an edge actually is becomes important. A historical pattern is more credible when it survives evidence it did not help select than when its entire “edge” comes from finding the best configuration on one sample. A backtest is evidence, not a certificate.
Costs, Regimes, and Futures Data Can Change the Answer
Mean-reversion strategies can be sensitive to trading friction because many target relatively modest moves. Commissions, bid-ask spread, slippage, and execution effects belong in the economics of the test rather than being added only after the strategy looks attractive. CME's own transaction-cost research treats commissions and execution effects as real components of trading cost. (cmegroup.com)
A strategy with an $18 gross average trade looks very different if realistic costs consume $12 of that amount. Small changes in fill assumptions may matter much less to a strategy whose average trade is hundreds of dollars. The smaller the average trade, the more execution realism matters.
Regime analysis should ask where the behavior strengthens, weakens, or fails. Results might reasonably be examined across trend versus range conditions, volatility states, time of day, long versus short setups, or different instruments, but those comparisons should not become an endless search for the only profitable subgroup. Market conditions change the quality of a setup, and research needs to respect that without mining the data until every losing environment disappears.
Futures data construction matters too. Continuous series may stitch or back-adjust successive contracts, which can change historical absolute levels and create rollover transitions that affect distance-based calculations. A futures backtest is also a test of how you built the futures history.
Measure More Than Win Rate
A strategy that wins 78% of its trades may still be unattractive if its losses are much larger than its winners. Useful review metrics include trade count, win rate, average winner, average loser, expectancy, profit factor, maximum drawdown, consecutive losses, holding time, MAE, and MFE. Win rate tells you how often; expectancy tells you whether the outcomes were worth trading.
Drawdown deserves particular attention because a strategy can finish with a strong historical result while passing through losses a trader could not realistically tolerate. Look at the depth, duration, losing sequences, and regimes responsible for those declines. A strategy that the trader cannot survive is not rescued simply because the spreadsheet later recovers.
Sample size needs context as well. Ten years containing 17 trades is not the same evidence as thousands of observations, while hundreds of trades clustered inside a handful of volatility events may be less independent than the raw count suggests. Calendar length and sample size are not the same thing.
Stress the Backtest Before You Trust It
Robustness testing asks what happens when the assumptions become slightly less favorable. Increase estimated costs, vary nearby parameters, examine different periods, remove a few unusually strong trades, and ask whether one regime or one extraordinary episode explains most of the historical result. A robust edge bends when assumptions change; a fragile backtest breaks.
This is where a research log becomes valuable. Record the original hypothesis, parameter changes, reasons for each change, samples viewed, discarded variations, and assumptions changed along the way. The research log remembers the failed versions your final equity curve would prefer you forget.
At some point development has to stop. Freeze the entry, mean, extreme, stop, target, filters, session, costs, and execution assumptions before the final validation sample is evaluated. A test cannot grade rules that keep changing while the exam is being taken.
A Practical ETM Backtesting Framework
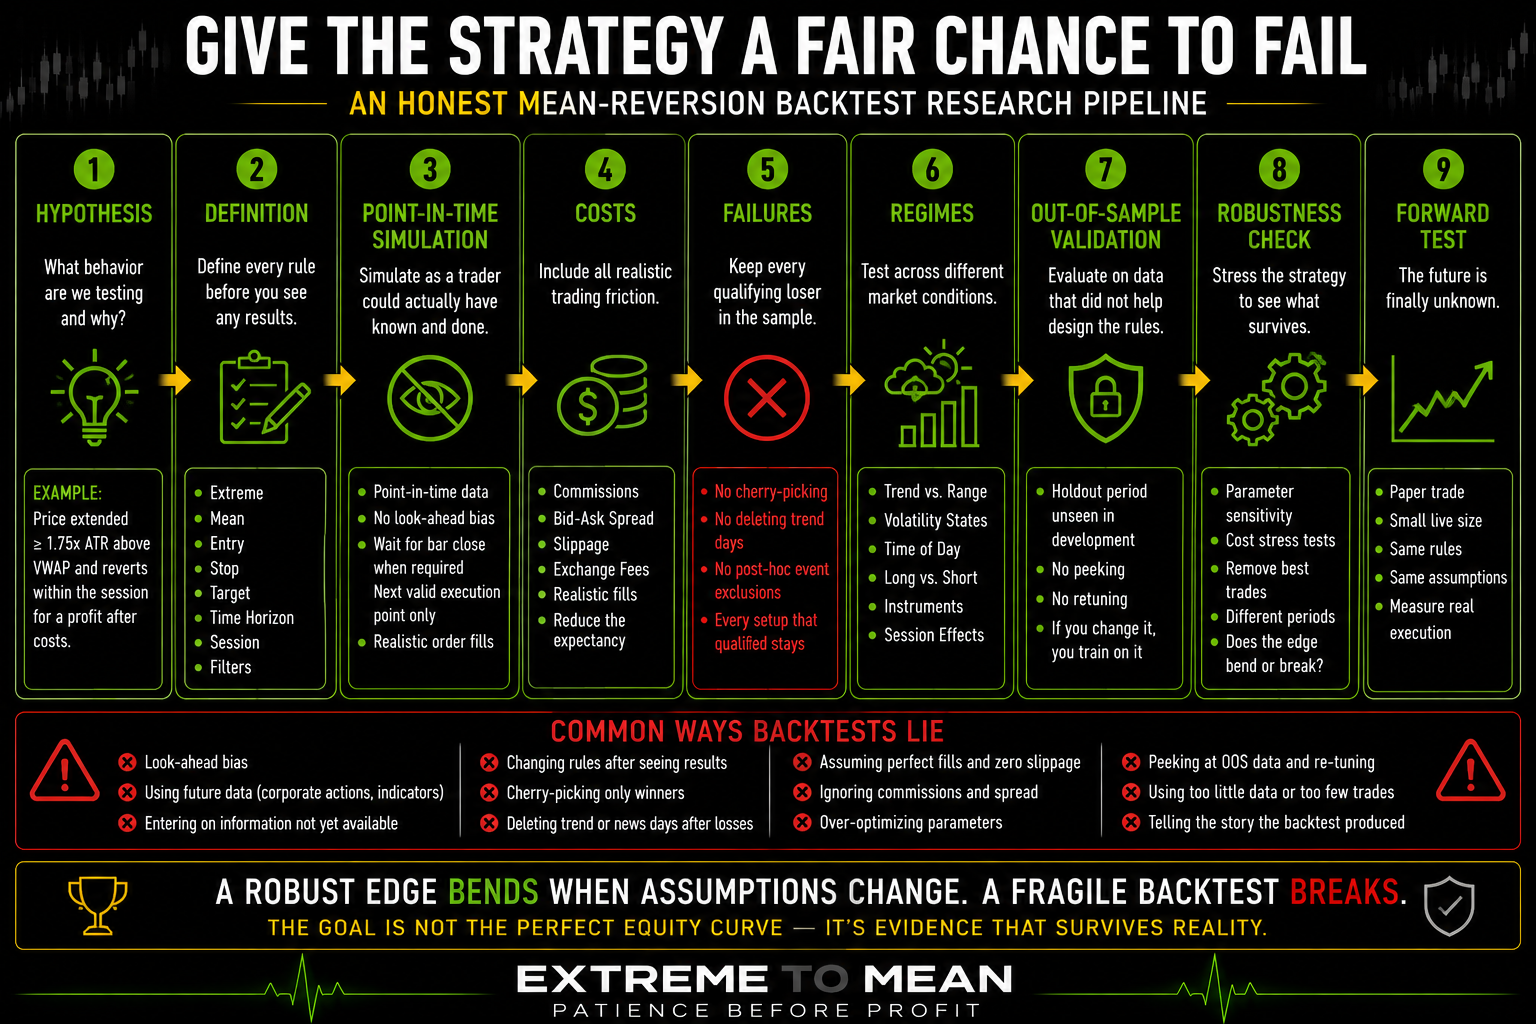
Use Hypothesis → Definition → Historical Simulation → Costs → Failures → Regimes → Validation → Robustness → Forward Test. Each stage is designed to remove one opportunity for hindsight or wishful interpretation before more confidence is placed in the result. The goal is not to make the strategy harder to trade; it is to make the evidence harder to fake.
- Hypothesis: What market behavior do we think exists, and why?
- Definition: Are the mean, extreme, entry, invalidation, target, session, and time horizon fixed?
- Historical Simulation: Could the simulated trader actually know and execute what the test assumes?
- Costs: Does the result survive commissions, spread, slippage, and reasonable fill assumptions?
- Failures: Did every qualifying loser remain in the sample?
- Regimes: Where does the idea work, weaken, or fail?
- Validation: Does it survive data that did not help design it?
- Robustness: Does it survive modest changes to assumptions and parameters?
- Forward Test: Does the same behavior appear when the future is genuinely unknown?
The better question is not “How good is the backtest?” Ask, “What would have to be false about my assumptions for this result to disappear?” That shifts the researcher from protecting the strategy toward actively searching for ways the apparent edge could be an illusion.
A credible backtest should earn the right to be tested forward, not the right to be trusted blindly. Simulation, small real-world observation, execution differences, changing liquidity, and changing regimes can all reveal problems historical testing missed. Backtest the rule—not the story you tell after the chart is finished.
Final Thought
Mean reversion will always look cleaner from the right edge of a finished chart. The completed history reveals which extension finally reversed, which mean was eventually reached, and which stop would have survived. An honest backtest deliberately denies the simulated trader that knowledge.
That usually produces a less impressive result. Failures stay in the sample, costs reduce the numbers, ambiguous fills become less generous, and out-of-sample data may expose rules that looked powerful during development. A worse-looking honest backtest is more valuable than a perfect backtest you could never have traded.
The value of research is not that it protects an idea from being wrong. It is that it shows where the idea breaks and whether anything useful survives after hindsight, overfitting, friction, and changing conditions have been accounted for. That evidence-first approach is part of the broader market-reading process developed throughout Decode the Market.
Educational content only. Trading involves substantial risk and is not suitable for everyone.