
For U.S. equity-index futures, the Initial Balance gives traders a way to organize the first hour of the cash session before judging what happens next. Once that range is complete, the IB High and IB Low become fixed references for the remainder of the session. Inside The Setup, the job is not to react because one boundary broke, but to evaluate whether the extension is being accepted, whether it is failing, and whether the resulting structure still deserves risk.
What an Initial Balance Breakout Actually Is
In traditional TPO and Market Profile usage, the Initial Balance generally comes from the first two 30-minute periods. For the Extreme to Mean U.S. equity-index futures framework, that means the 9:30–10:30 a.m. ET range. The highest price during that hour becomes the IB High, while the lowest becomes the IB Low.
The existing Initial Balance Trading lesson owns the deeper explanation of why that first hour matters. For this lesson, the important point is that the range must finish before its final boundaries exist. If the trader defines the IB as 9:30–10:30, a developing high at 10:12 is not yet the completed IB High.
Once 10:30 arrives, an upside Initial Balance breakout occurs when price trades beyond IB High, while a downside breakout occurs below IB Low. At the most literal level, even a small trade outside the boundary means the completed range has been exceeded. That does not mean one tick beyond the range and a sustained, tradable range extension are the same thing.
Range Extension Measures Distance—It Does Not Promise a Target
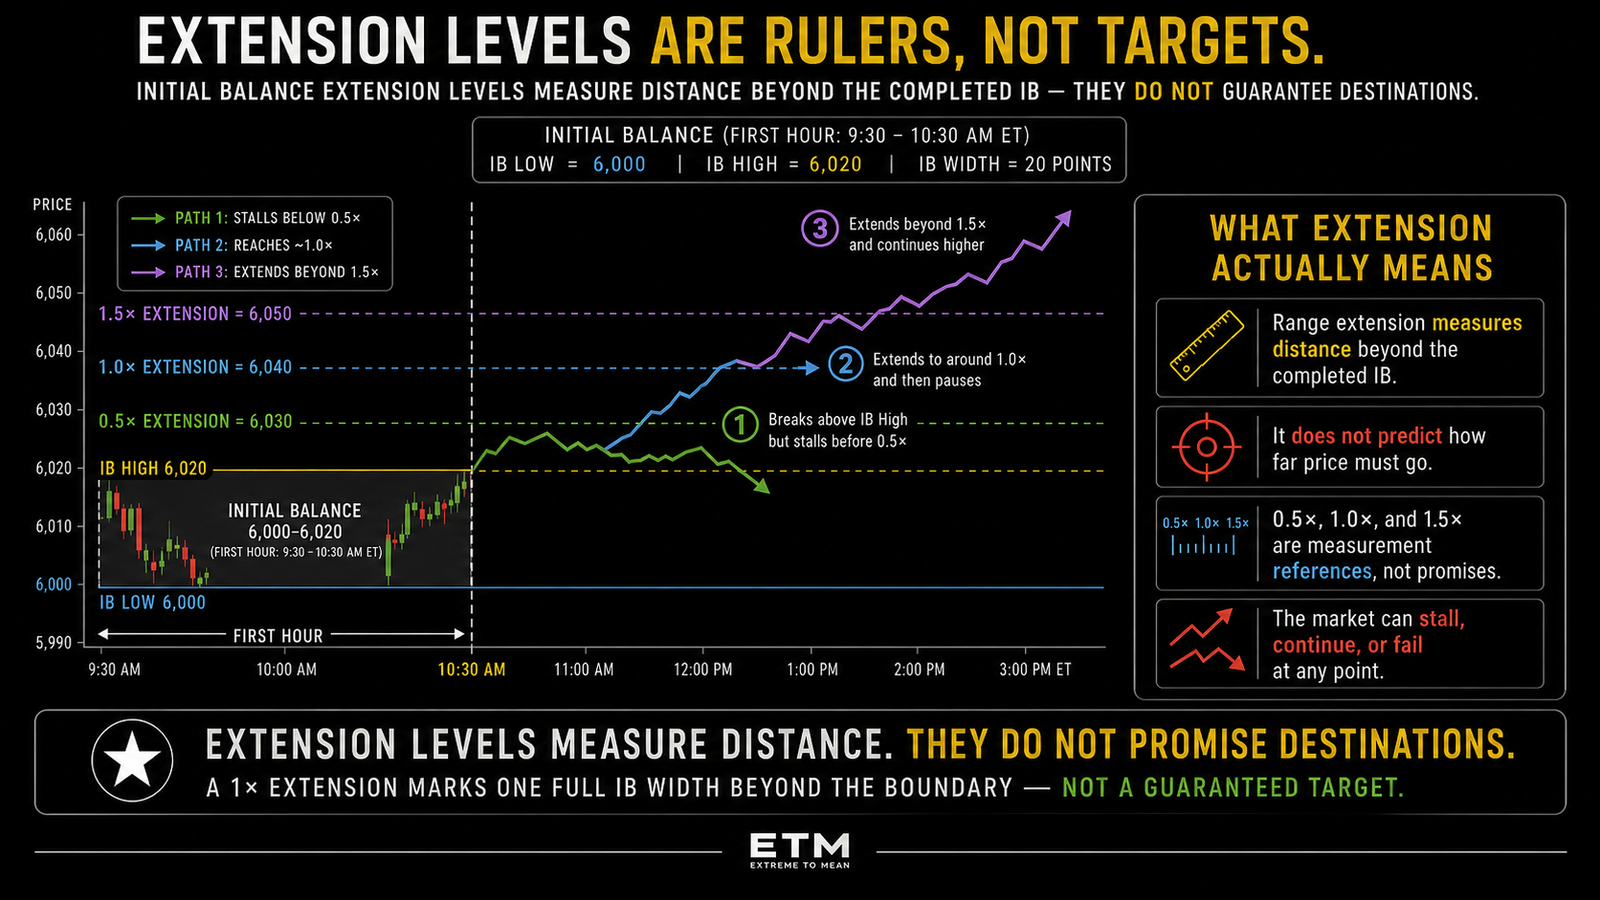
Range extension simply describes how far price travels beyond the completed Initial Balance. Suppose the IB runs from 6,000 to 6,020, giving it a width of 20 points, and price later reaches 6,030. The market has extended 10 points beyond IB High, equal to 0.5 times the original IB width.
That 0.5× measurement can be useful as a ruler. Platforms can also display extensions such as 0.25×, 0.5×, 1×, 1.5×, or other user-configured values. The mistake is quietly turning a measurement of distance into a prediction of destination.
Range extension tells you how far price traveled beyond the Initial Balance. It does not tell you how far price is supposed to go. A 1× extension simply marks a price one full IB width beyond the boundary. Whether the market ever reaches that reference is an entirely separate question.
The First Tick Outside the IB Is Not the Trade
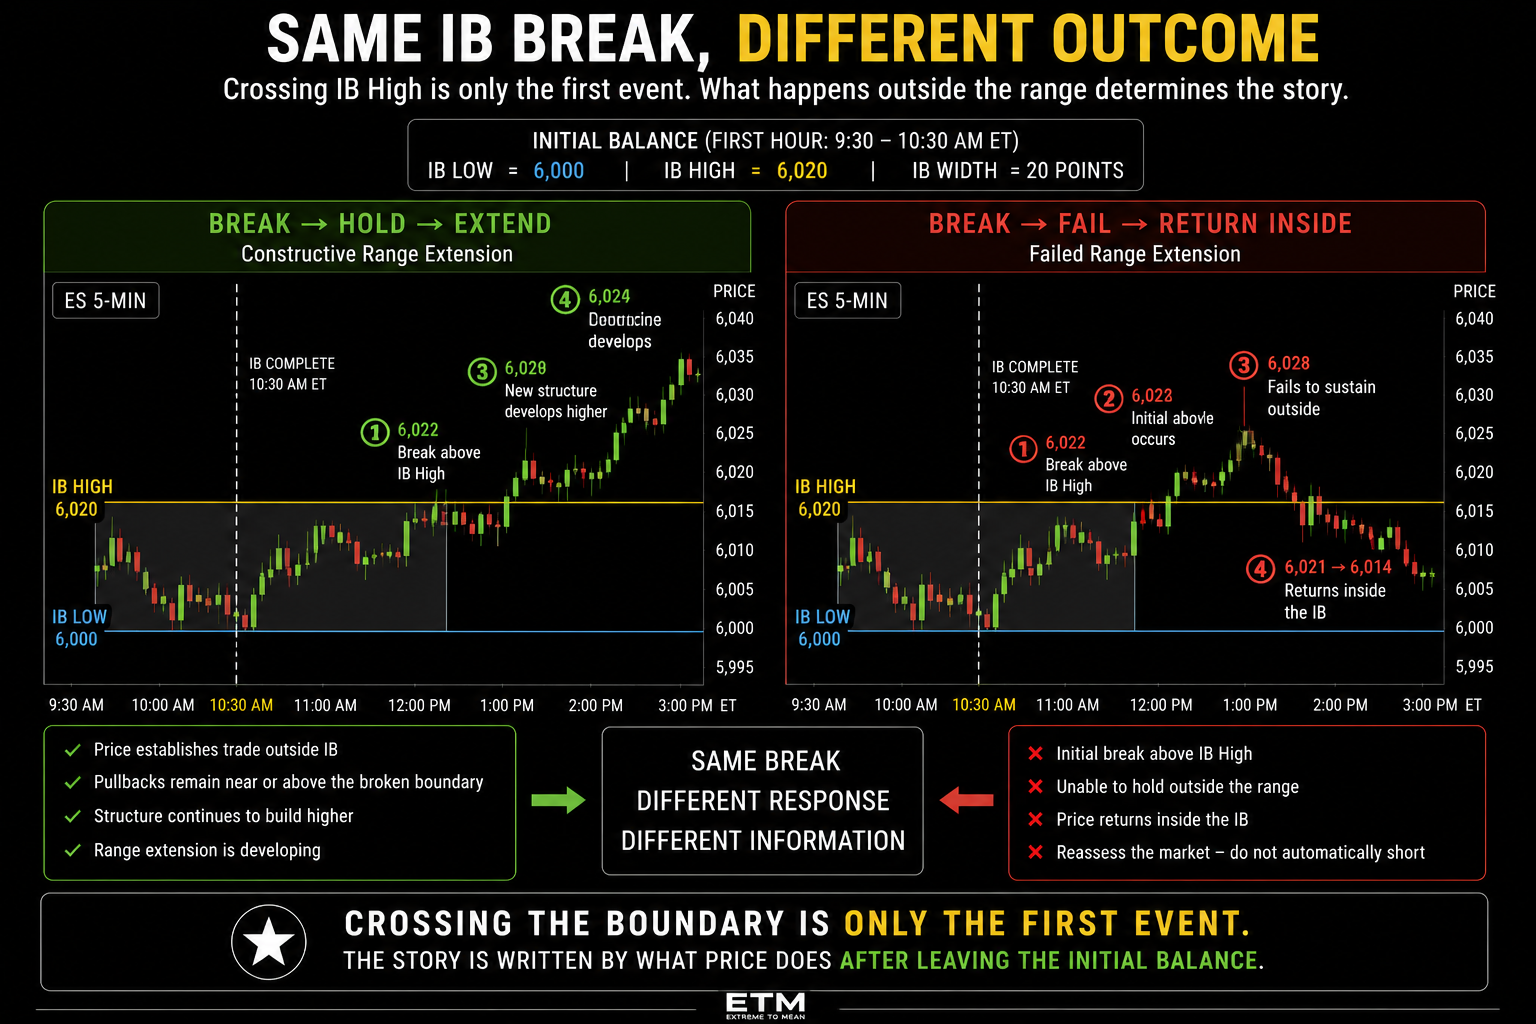
Assume the IB High is 6,020 and ES prints 6,020.25 after 10:30. Technically, the Initial Balance has been exceeded, but very little has been established about what the market will do with that new territory. Price can continue immediately, pause outside, rotate around the boundary, return inside, or eventually break the other side.
The better question is what happens after price leaves the range. Sustained trade beyond the boundary, structure developing outside, shallow pullbacks, continued transactions at new prices, and directional follow-through can all contribute to evidence that the extension is gaining acceptance. No single candle close, time threshold, volume spike, or other mechanical rule universally defines that acceptance.
This is where the broader Auction Market Theory framework becomes useful. Acceptance and rejection are conclusions drawn from developing market behavior rather than from one line being crossed. The Initial Balance provides the reference; the subsequent auction provides the information.
Failed Extension and the Return Inside the IB
Imagine IB High is 6,020 and price trades 6,022 → 6,026 → 6,028 before falling back through 6,021 → 6,018 → 6,014. The market extended above the Initial Balance, but it did not sustain that extension. That failure gives the trader new information because the auction is behaving differently from one that remains above the range and continues developing higher.
A failed bullish extension proves one specific thing: the bullish extension failed to persist. It does not automatically prove that the trader should short, that IB Low is now the target, or that price must rotate through the entire range. Failure of one directional attempt is information to reassess, not permission to manufacture the opposite trade.
A return inside the Initial Balance matters because a market conducting business back inside the first-hour range is different from one holding outside it. Price may rotate toward the midpoint, remain near the broken boundary, chop, make another attempt outside, or eventually move toward the opposite side. Returning to balance does not guarantee traversing the entire balance.
The midpoint can remain a useful reference if price returns inside, but it should be treated the same way as other ETM references. It identifies a location worth observing rather than a destination the market is required to reach. The subsequent price behavior decides whether the midpoint contributes anything useful.
The First Break Does Not Determine the Day
It is possible for the market to break IB High and later trade below IB Low during the same session. That does not invalidate the Initial Balance framework or prove that the first break was somehow “fake.” It simply means the first directional extension was not sustained and the session later explored beyond the other side.
A two-sided expansion can appear during volatile, rotational, news-driven, or transitional sessions. The first break therefore provides evidence about what the market attempted to do, but it does not create a permanent directional contract for the rest of the day. A rule that forbids shorts after an upside break may belong to a tested strategy, but it is not a universal property of the market.
The same caution applies to the popular idea that an Initial Balance breakout automatically identifies a trend day. Sustained extension can become one piece of evidence that directional discovery is developing, but price can also extend and later return, rotate, or finish near the middle. IB breakout and trend day are not synonyms.
Initial Balance Width and Context Change the Opportunity
Consider two ES sessions where one Initial Balance is 12 points wide and the other is 55 points wide. A 20-point extension represents very different movement relative to those two starting ranges, while the wider IB has already consumed considerably more range before 10:30. Width matters because it changes the context in which later extension is occurring.
The useful comparison is relative rather than based on arbitrary point thresholds. A range can be considered in relation to recent volatility, typical session ranges, the instrument, overnight movement, and the current market regime. Twenty points by itself tells you very little until you know whether 20 points is unusually small, ordinary, or unusually large for that market right now.
Available room matters just as much. An IB High at 6,020 followed by a breakout around 6,023 with previous-day resistance at 6,027 is structurally different from the same breakout with the next meaningful reference near 6,055. A valid market read can still produce a poor trade if the location offers no room.
Overnight structure and new information can change the picture further because ES and NQ do not begin trading at 9:30. Overnight highs and lows, previous-day structure, macro-release levels, and later headlines can all matter after the IB completes. The Initial Balance gives you a session reference, not a force field around the rest of the chart.
Opening Range Breakout and Initial Balance Breakout Are Different Setups
The Opening Range Breakout and Initial Balance Breakout are closely related, but they answer different questions because their ranges finish at different times. Extreme to Mean’s Opening Range uses the first 30 minutes, while the Initial Balance uses the first full hour. That means the ORB can create an earlier directional test, while the IB breakout begins with more information already available.
By 10:30, the trader knows the first-hour high, low, and range width and has observed another 30 minutes of cash-session structure and volatility. The tradeoff is that meaningful directional expansion may already have started before the Initial Balance is complete. Waiting for a completed IB gives you more information, but sometimes at the cost of later location.
Neither reference is automatically superior. They are separate tools for organizing different stages of the session, and confusing the two makes it harder to know what information a breakout actually represents. The trader should know which range is being tested before assigning meaning to the break.
More Confirmation Can Eventually Become Worse Location
Suppose IB High is 6,020 and price runs 6,022 → 6,030 → 6,042 before the trader finally buys at 6,041 because the breakout now feels “confirmed.” The market may indeed be accepting higher prices, but the trade being offered at 6,041 is not the same trade that existed near the range boundary. Invalidation may now be farther away, much of the move may already have occurred, and another opposing reference may be closer.
More confirmation can eventually become worse location. That is why where you enter matters more than what you predict remains relevant even when the directional read is correct. Correct analysis does not make every later price a good entry.
Immediate breakout entries and pullback entries also involve different tradeoffs. Entering quickly can participate in an extension that never returns, while waiting for a pullback can improve location and reveal more about acceptance but may leave the trader watching a move that never retests. Entry method is a strategy decision layered on top of the information provided by the Initial Balance.
Break Frequency Is Not Win Rate
Initial Balance statistics can sound far more powerful than they really are when definitions are blurred. A study saying that one IB boundary was crossed on a very high percentage of sessions may simply define a break as trading one tick beyond either boundary at any time before the close. That does not tell you whether the extension was sustained or whether a usable trade existed.
A boundary-crossing statistic also tells you nothing about entry price, stop placement, extension distance, transaction costs, whether the first break failed, whether both sides eventually broke, or whether useful risk-to-room existed. Those variables belong to the trading strategy rather than the raw market statistic. A high break frequency can therefore coexist with a completely different strategy win rate.
Break frequency is a market statistic. Win rate is a strategy statistic. They are not interchangeable. Historical percentages can be useful research clues when instrument, period, volatility regime, and definitions are matched carefully. They should not be converted into a promise that an IB breakout is automatically a high-probability trade.
A Practical Initial Balance Breakout Process
Use Balance → Break → Extension → Accept or Fail → Context → Risk. The sequence keeps the Initial Balance where it belongs: upstream of the trade decision rather than functioning as an automatic entry signal. A completed box tells you where the first hour traded; everything after that still has to be evaluated.
- Let the IB complete: Allow the full first hour to establish the final range.
- Mark IB High and IB Low: These become fixed references for the remainder of the session.
- Observe the break: Which boundary does price test or exceed?
- Measure extension: How far has price actually traveled beyond the range?
- Evaluate acceptance or failure: Is trade continuing to develop outside, or returning inside?
- Read context: Consider volatility, market structure, overnight references, and new information.
- Check room: Is meaningful opposing structure immediately ahead?
- Define invalidation: Where would the continuation thesis actually be wrong?
- Evaluate entry quality: Is the move still offering usable location, or has it already matured?
- Decide: Only now ask whether the Initial Balance breakout deserves risk.
| Question | Constructive IB Extension | Weak / Failed Extension |
|---|---|---|
| Initial Balance | Complete and clearly defined | Still developing or incorrectly defined |
| Boundary | Price moves beyond it | Brief probe only |
| Outside behavior | Trade continues developing outside | Rapid return inside |
| Follow-through | Developing | Weak or reversing |
| Extension | Building with structure | Stalls quickly |
| Room | Meaningful space remains | Major obstacle nearby |
| Entry | Near usable structure | Chasing a mature move |
| Invalidation | Clear | Arbitrary or excessively wide |
| Context | Supports continuation | Conflicted or materially changed |
| Trader response | Qualify potential trade | Reassess |
These are evaluation questions, not a mechanical scoring model. Instead of asking “Did the Initial Balance break?”, ask “What is the market actually doing after leaving the first-hour range?” Then ask: “Is the extension being accepted, is it failing back into balance, and is there still enough location and room for the trade to make structural sense?”
Final Thought
The Initial Balance gives traders a fixed first-hour reference, but the boundary itself does not predict the rest of the session. A breakout tells you that price has begun exploring beyond that range, while range extension tells you how far that exploration has traveled. What matters next is whether the market continues doing business outside the range or fails back toward balance.
Extension levels can measure distance without becoming targets, and a failed extension can provide information without automatically becoming an opposite-side trade. IB width, volatility, overnight structure, new information, available room, entry location, and invalidation all continue to matter after the line breaks. The trader’s job remains to evaluate what price is proving rather than obey the reference.
After the first hour is complete and price leaves the Initial Balance, ask whether you are trading merely because the range was broken or because the market has actually shown that it can sustain the extension with enough structure, room, and risk clarity to make the breakout worth trading. Readers who want to build the broader context-first process behind that decision can continue with Decode the Market.
Educational content only. Trading involves substantial risk and is not suitable for everyone.