
For index-futures traders, 9:30 to 10:30 a.m. ET is a transition from overnight trade into the core U.S. equity session. Futures such as ES, NQ, and YM have already been trading for hours, but the 9:30 cash open brings the underlying stock market into its core session and introduces its opening-auction price discovery. That makes the first hour useful because it shows how the market is processing a new concentration of information and activity.
The mistake is assuming that “information-rich” means “predictive.” A strong first hour can continue, fail, stall, or reverse, while a narrow first hour can remain quiet rather than expanding later. The value of the first hour is not that it forecasts the afternoon with certainty. Its value is that it gives the trader a structured way to classify what has already happened before making the next decision.
What Initial Balance Means
In plain English, the Initial Balance is the high-to-low price range formed during the first hour of the regular U.S. equity session, commonly measured from 9:30 to 10:30 a.m. ET for U.S. equity-index futures. The highest price traded becomes the Initial Balance high, the lowest becomes the Initial Balance low, and the distance between them is the range width. The midpoint is halfway between the two and helps show whether later trade is holding toward one side or rotating through the center. You do not need a Market Profile chart to use those four references, but the comparison of Volume Profile with Market Profile clarifies what each profile measures.
A normal futures chart can mark the high, low, midpoint, and width once the first hour is complete. The important distinction is that The Market comes before the trade: these levels describe the early session and provide context for later evaluation. They are reference points, not instructions.
Why the First Hour Deserves Attention
The 9:30 opening process matters because the cash equity market is beginning its core trading session while index futures are already active. Opening auctions aggregate orders and contribute to price discovery in the underlying stocks, and the transition can force futures traders to reassess overnight assumptions. By 10:30, the trader has one completed hour showing how buyers and sellers handled that transition.
This fits the broader lesson that the market comes first. Instead of beginning with “What setup do I want today?” the trader can begin with “What kind of session is actually forming?” The first hour cannot answer that perfectly, but it can provide evidence about direction, balance, volatility, and acceptance.
Read Four Things Before Reading a Breakout
Start with the Initial Balance high and low because they define the outer boundaries of the first-hour range. Then note the midpoint and the width of the range relative to recent conditions. A wide range in a quiet environment can carry different information from the same number of points during a highly volatile period. Width therefore needs context rather than a universal threshold.
A relatively narrow Initial Balance says the first hour covered limited distance, but it does not guarantee later expansion. A relatively wide Initial Balance says substantial movement has already occurred, but it does not guarantee rotation afterward. The better question is what the width says about how much movement has already been expressed and how much evidence would be needed before chasing beyond it. That keeps width descriptive instead of predictive.
Six First-Hour Structures Worth Recognizing
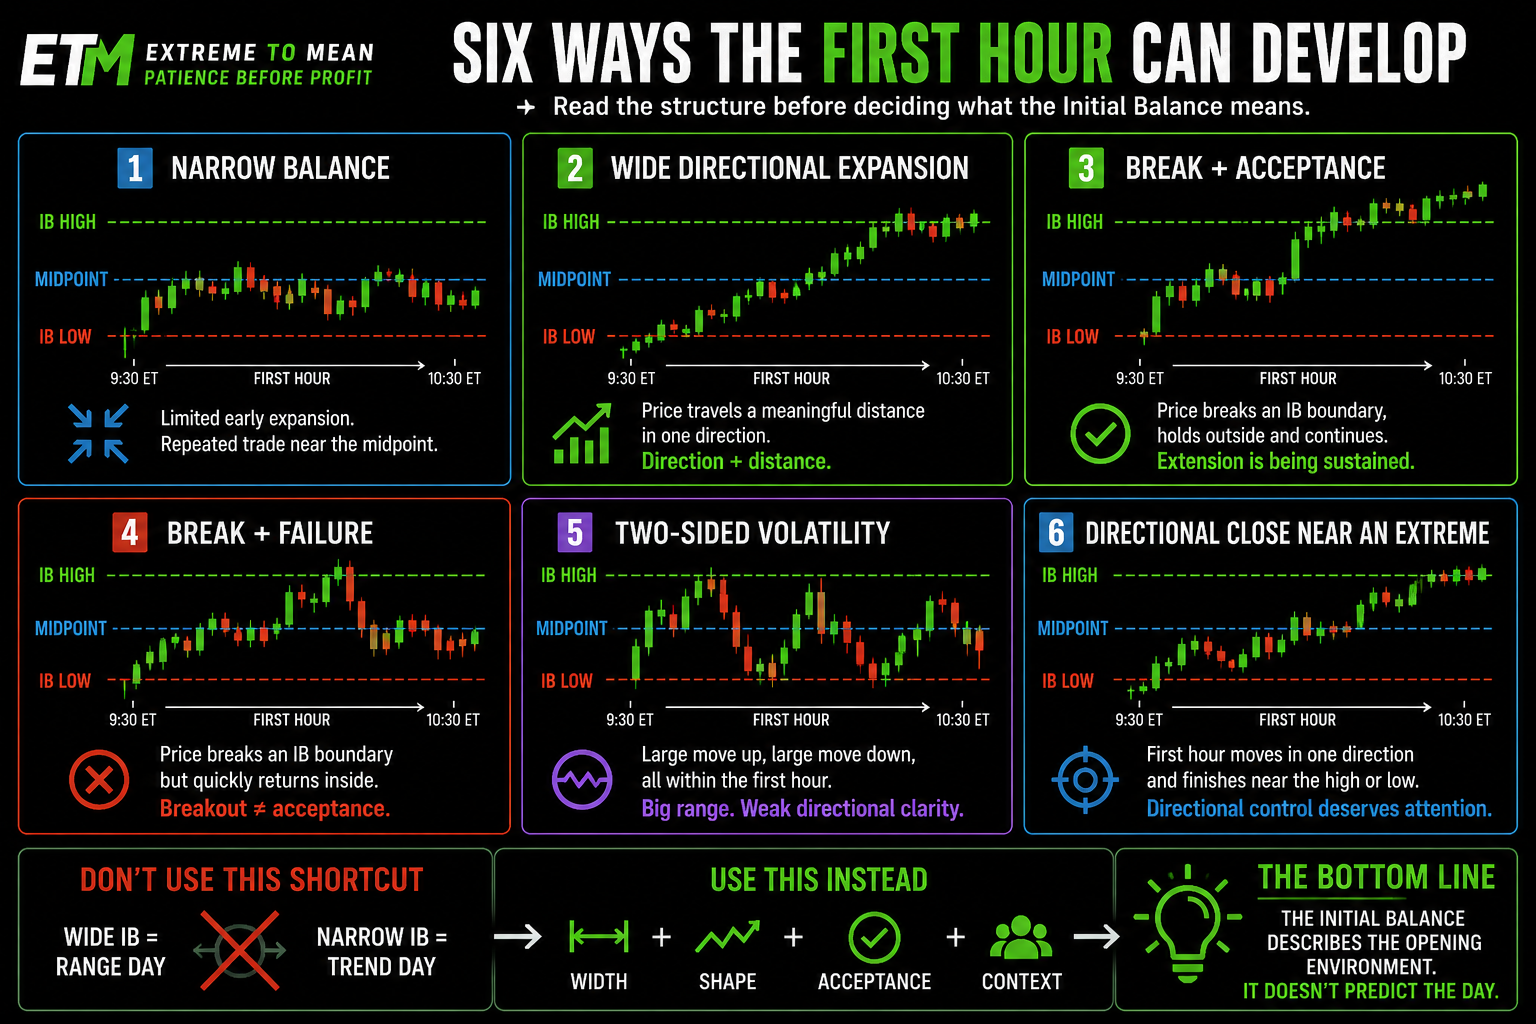
A narrow, balanced first hour shows limited early expansion and repeated trade through a compact area. That can leave room for later movement if price breaks the range and begins accepting outside it, but it can also remain rotational. A wide directional first hour shows meaningful distance covered with sustained movement toward one side. If it finishes near its high during an advance or near its low during a decline, the early auction is showing stronger directional control.
Two-sided volatility communicates something different from clean directional expansion. The first hour may push sharply one way, reverse hard, travel the other way, and still finish with a very wide range. Significant movement occurred, but directional clarity did not necessarily improve. A trader arriving after that sequence may have less reason to chase either extreme because much of the day’s early movement has already been spent.
The remaining structures are best understood through what happens at the boundaries. Price may break the Initial Balance and either accept outside it or fail back inside, or repeatedly test a boundary without resolving. Each creates a different context even though all begin with the same high and low. The completed range helps classify the interaction; it does not create an automatic entry.
Breakout Is Only the Beginning of the Question
Once the Initial Balance is complete, a move outside the high or low becomes another interaction to evaluate. The important information is not merely that the range was crossed, but whether trade outside the range is being sustained. Acceptance can strengthen a directional interpretation when structure and related markets agree. Failure back inside weakens the immediate breakout case but does not automatically define the next destination.
For example, an ES break above its Initial Balance high while NQ and YM are showing compatible strength is different from an isolated ES break that immediately loses participation. Even then, confirmation is evidence rather than certainty. The same principle behind context coming before the candle applies here: one breakout candle should not be asked to explain the whole market.
Turn the First Hour Into a Market Classification
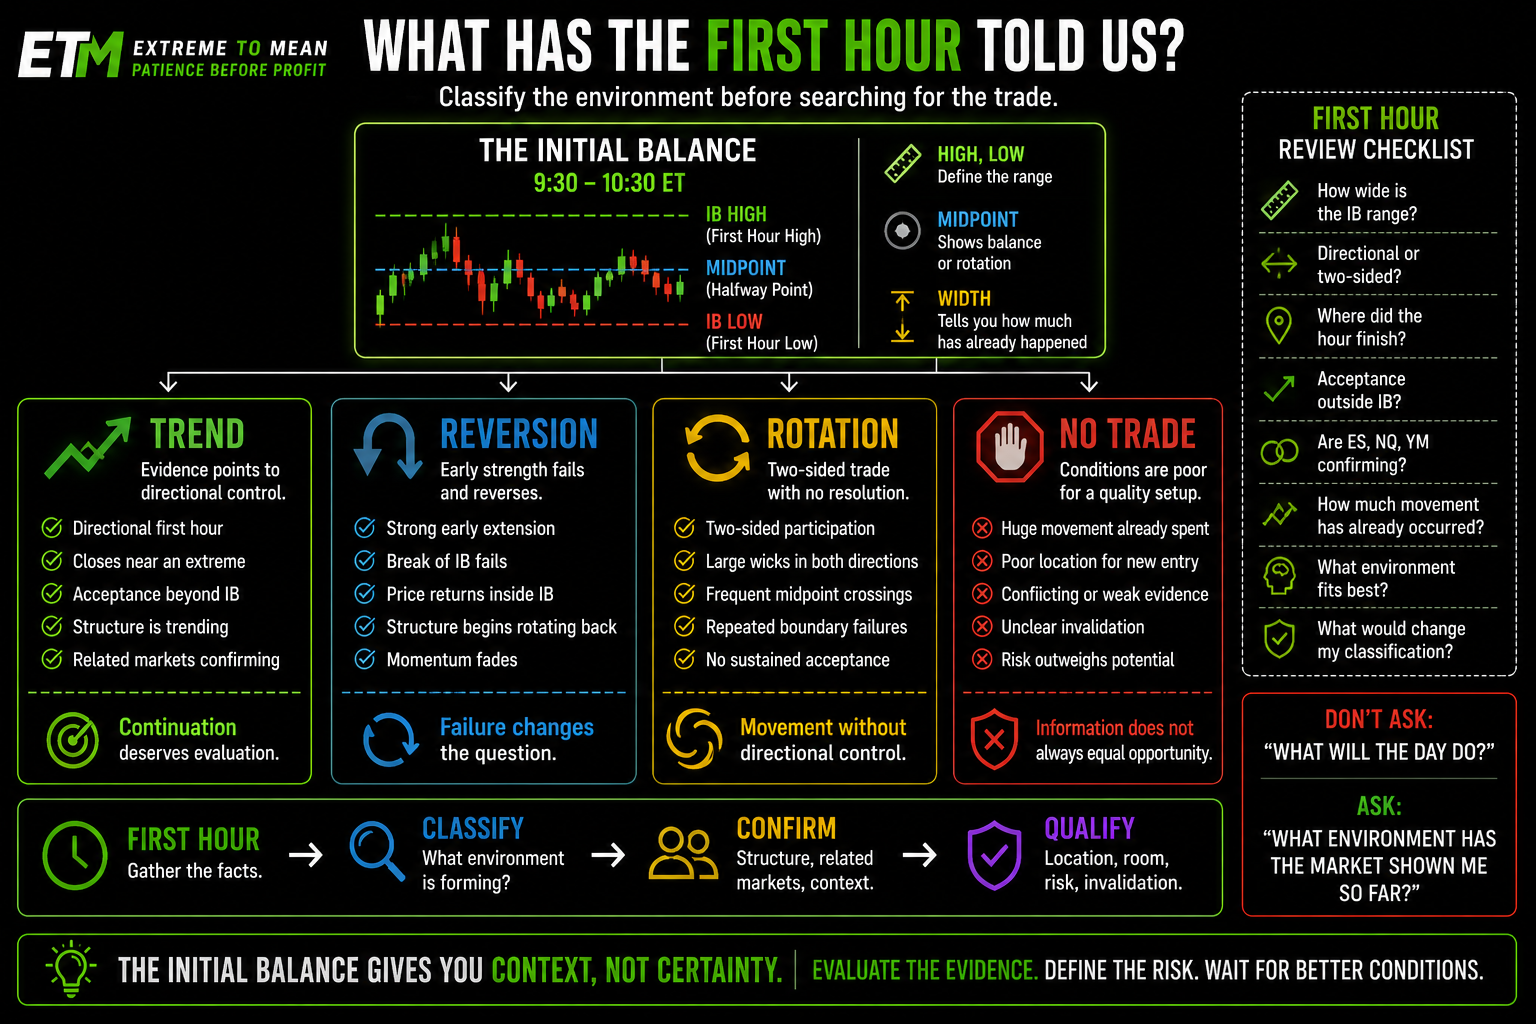
The most useful ETM application is to ask what the first hour has told you about Trend, Reversion, rotation, or No Trade. These are working classifications, not predictions of the day’s final shape. A directional Initial Balance followed by acceptance outside the range may support a Trend framework, while a sharp extension that fails and returns toward the range can raise a Reversion question. Repeated two-sided trade around the midpoint may point more toward rotation.
No Trade deserves equal status in that decision tree. A huge two-sided first hour may leave poor location, unclear invalidation, and little reason to chase after substantial movement has already occurred. A narrow range filled with repeated false starts may also fail to provide enough evidence for continuation or reversion. The framework improves decision quality because it allows the trader to recognize when the market has supplied information without supplying a clean opportunity.
Why the Weaker Decision Feels Reasonable
The first-hour range looks precise, which encourages mechanical rules. Traders see an Initial Balance high, an Initial Balance low, and a breakout, so “buy above, sell below” feels objective and disciplined. The problem is that a precise level does not remove the need to evaluate acceptance, structure, volatility, location, and available room. Mechanical certainty is attractive because it eliminates ambiguity, but ambiguity is part of the market.
The opposite mistake is deciding what the first hour “means” too early and refusing to update. A strong opening rally may tempt the trader to label the entire day a trend day before the Initial Balance is even complete. If the market then fails, returns through the midpoint, and begins rotating, the original label has become less useful. Flexibility means updating the classification as evidence changes, not inventing a new story to defend an existing position.
A Better First-Hour Review
After 10:30 a.m. ET, pause long enough to describe the completed first hour before looking for the next trade. The goal is to convert movement into observations that can be reviewed later. This process also connects the first-hour structure to the three market states without forcing every session into a premature label. If the evidence is mixed, “unclear” is a valid conclusion.
- How wide is the Initial Balance relative to recent conditions?
- Did the first hour develop directionally or trade both ways?
- Where did the hour finish relative to its high, low, and midpoint?
- Has price accepted outside the range or failed back inside?
- Are ES, NQ, and YM broadly confirming or diverging?
- Has substantial movement already occurred before I am considering entry?
- Is the current environment better described as Trend, Reversion, rotation, or No Trade?
- What evidence would make me change that classification?
These questions create a record of the decision process instead of a record made only from hindsight. A trader can later compare what the first hour appeared to communicate with what happened after 10:30 and refine the framework without turning it into a rigid prediction model. That is how a reference becomes useful: it improves preparation, classification, and risk definition. It does not promise that the market will behave the same way the next time a similar Initial Balance appears.
Final Thought
The Initial Balance is valuable because the first hour compresses a complicated opening process into a simple structure that can be reviewed: high, low, midpoint, width, direction, and behavior around the boundaries. It gives the trader a common language for comparing one session with another. More importantly, it creates a moment to stop reacting to every opening candle and ask what the market has actually shown so far. That is a better use of the first hour than trying to predict the entire day from it.
Let the first hour inform the next decision without controlling it. A wide directional range, narrow balance, failed breakout, or two-sided expansion should change the questions you ask, not eliminate the need for confirmation. For a deeper framework on reading structure and context together, Decode the Market is the natural next step. The trader’s job remains the same: evaluate the evidence, define the risk, and wait for conditions that justify commitment.
A shorter opening reference is covered in the guide to why the first 30 minutes matter, which should still be read as context rather than a signal.
Educational content only. Trading involves substantial risk and is not suitable for everyone.