
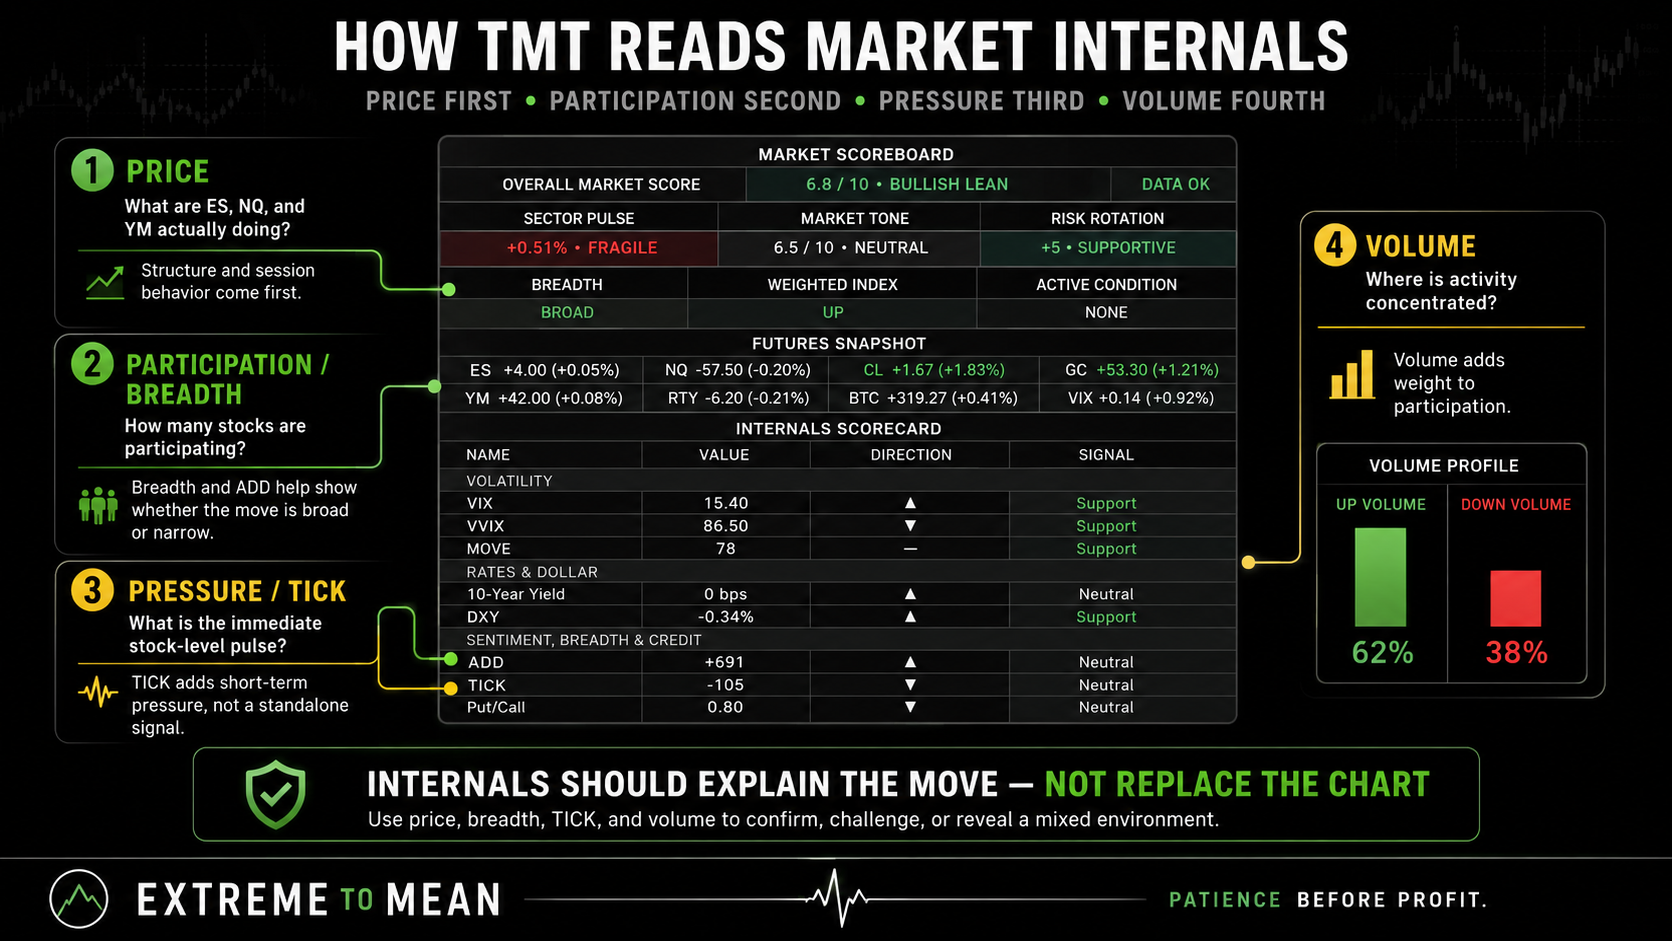
A clean market-internals process starts with price, not with a flashing breadth or TICK reading. Inside The Market, the first question is still what ES, NQ, or YM is actually doing in terms of structure, location, and session behavior. Internals come next because their job is to confirm, challenge, or add context to the move already visible on the chart.
The temptation is to reverse that order. A trader wants a long, scans several internals until one turns positive, and then calls the trade confirmed even though the broader evidence remains mixed. Confirmation is not the indicator you finally find that agrees with you.
What Market Internals Actually Tell You
Market internals are measurements built from the behavior of many securities rather than from the price of one instrument. They can describe participation, short-horizon stock-level pressure, volume concentration, new highs and lows, or other dimensions of market health. For this dashboard, the goal is deliberately narrower: use only the measures that answer three different questions.
The hierarchy is Price → Participation → Pressure → Volume → Agreement or Disagreement. Price tells you what the weighted index accomplished, while internals help explain how broadly the underlying market participated and how that participation behaved. Internals should explain the move—not replace the chart.
Build a Three-Question Dashboard
Every internal on the screen should have one job. Use advance-decline data to ask how many stocks are participating, TICK to ask what the immediate stock-level pressure looks like, and up volume versus down volume to ask where trading activity is concentrated. Together they give participation, immediate pressure, and volume commitment without asking six indicators to repeat the same idea.
The dashboard becomes useful only when those questions are compared with price. If ES is advancing, the trader can ask whether breadth is broadening, whether TICK behavior is generally supporting upside pressure, and whether trading volume is concentrated more heavily in advancing issues. The evidence may strengthen the price read, challenge it, or simply tell the trader that conditions are mixed.
Advance-Decline Breadth: How Many Stocks Are Participating?
The simplest advance-decline calculation is Advancing Issues − Declining Issues = Net Advances. If 2,000 issues are advancing and 1,000 are declining, net advances are +1,000; if 900 advance and 2,100 decline, the result is −1,200. Those are arithmetic examples rather than trading thresholds, and Nasdaq defines A-D around issues trading above versus below their previous closes. (nasdaq.com)
Several related measurements are often labeled “A/D,” so the term needs precision. Current net advances describe the present breadth balance, an advance-decline ratio compares advancers with decliners, and an advance-decline line cumulatively adds net advances through time. Know whether you are looking at today's breadth or a cumulative breadth series.
One reason breadth is useful beside a capitalization-weighted index is that a simple issue count effectively gives each security one directional vote. A tiny advancing stock and a mega-cap advancing stock each contribute one advance, which makes participation visible in a way index weighting does not. StockCharts describes this one-issue-one-vote characteristic as an important feature of the A/D Line. (chartschool.stockcharts.com)
That strength is also a limitation because breadth does not measure magnitude. A stock up 0.01% and another up 8% both count as advances in a simple issue count, while two declining stocks with dramatically different losses each contribute one decline. Breadth answers how widespread the move is—not how large every individual move was.
Breadth of What?
“Breadth” is never one universal number because the security universe matters. NYSE-listed issues, Nasdaq-listed issues, S&P 500 components, and Nasdaq-100 components can produce different readings at the same moment. Before interpreting breadth, ask the basic question: breadth of what?
That distinction matters directly to futures traders. ES tracks the S&P 500, so exchange-wide NYSE breadth is not constituent-for-constituent ES confirmation; NQ tracks the Nasdaq-100, so Nasdaq exchange breadth is not the Nasdaq-100 either. Market breadth can complement an index without being built from exactly the same securities.
The existing lesson on what market breadth tells you that price alone does not provides the broader foundation. The useful comparison is weighted index performance versus participation across a defined universe, not an assumption that both datasets contain identical stocks. An index can be strong without the market underneath it being equally strong.
What the NYSE TICK Actually Measures
TICK asks a faster question than daily breadth. The NYSE TICK measures the net number of NYSE stocks whose latest trade occurred on an uptick versus those whose latest trade occurred on a downtick at that moment. If 1,000 stocks last traded higher and 600 last traded lower, the conceptual result is +400.
That does not mean 1,000 stocks are positive for the day, and it has nothing to do with the minimum futures tick size of ES or NQ. A stock can be below yesterday's close and still contribute positively to TICK because its latest transaction moved upward from the preceding trade. Breadth measures where stocks are; TICK measures what their latest movement is doing.
TICK is therefore faster and noisier than breadth. It can swing positive, negative, and positive again in a short period while advance-decline participation changes more gradually, so one isolated extreme should not become a buy, sell, or fade command. Breadth gives you the backdrop; TICK gives you the pulse.
An unusually strong TICK reading can accompany genuine momentum or appear near a short-term climax. Which one it represents depends on location, price response, breadth, volume, market state, and what happens after the reading rather than the number alone. One TICK spike is an event; the session's TICK behavior is context.
Up Volume vs. Down Volume: Where Is Activity Concentrated?
Advance-decline counts tell you how many issues are moving each way, but they do not tell you how much trading activity sits on each side. Up volume aggregates volume associated with advancing issues, while down volume aggregates volume associated with declining issues. Breadth counts participation; up/down volume weighs participation by trading activity.
That creates useful disagreements. A session can have more advancing than declining stocks while a larger amount of trading volume is concentrated in declining names, which is different from positive breadth paired with strongly dominant up volume. How many stocks moved and how much volume moved with them are two separate questions.
Up/down volume should not be described as buyer volume versus seller volume because every completed trade contains both sides. It is also different from Cumulative Volume Delta, which attempts to classify aggressive transaction activity inside a specific traded instrument and accumulate it through time. CVD asks what happened inside the contract; up/down volume asks where activity is concentrated across the broader stock market.
How Price and Internals Work Together
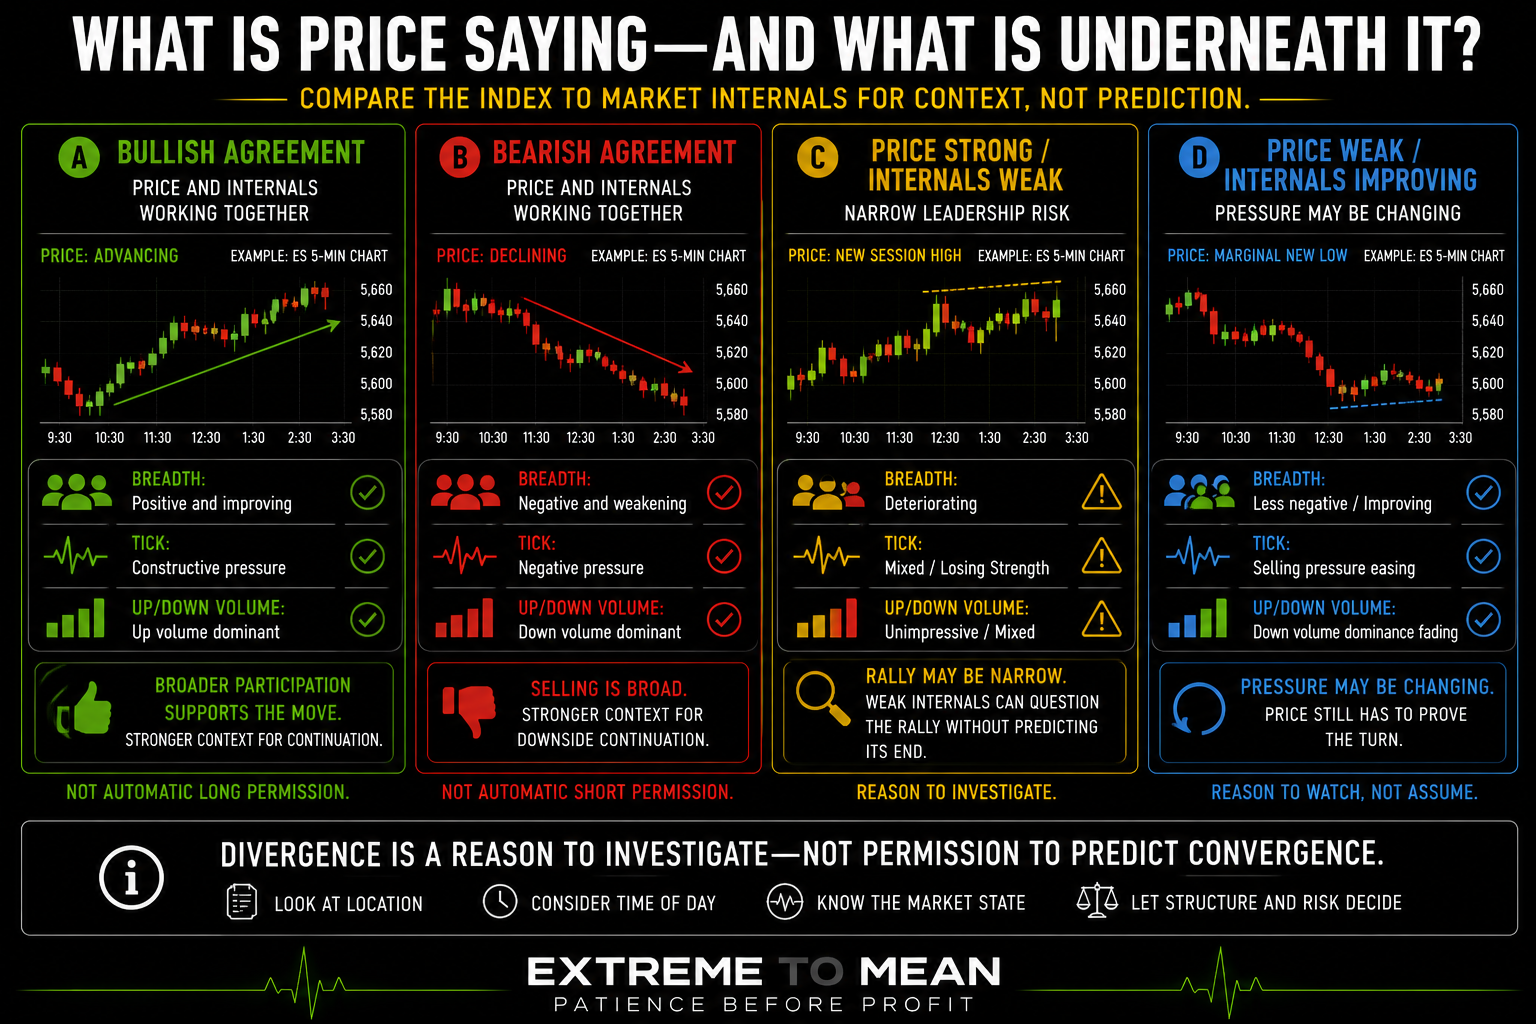
The cleanest use is agreement and disagreement rather than signals. When price is advancing, breadth is positive and improving, TICK pressure is broadly constructive, and up volume is dominant, the rally is receiving wider participation beneath the index. When price falls with weakening breadth, persistent negative TICK behavior, and dominant down volume, the selling is similarly broad.
The more interesting cases are mixed. ES can reach a new session high while breadth deteriorates, TICK loses persistent upside pressure, and up volume becomes less convincing, which tells the trader the rally is narrower than price alone suggests. Weak internals can challenge the quality of a rally without predicting its end.
The mirror image can appear during a selloff. Price can make a marginal new low while breadth becomes less negative, downside TICK pressure eases, and down-volume dominance begins to fade, suggesting that selling underneath the index is no longer worsening at the same rate. Improving internals can tell you the pressure is changing before price proves the trend has changed.
Divergence therefore belongs in the investigation column, not the prediction column. Narrow leadership can persist, weak breadth can remain weak while an index keeps climbing, and improving internals can fail to produce a reversal. Divergence is a reason to investigate—not permission to predict convergence.
Time of Day Changes the Meaning
ES, NQ, and YM trade before the U.S. cash-equity session opens, but ordinary NYSE and Nasdaq stock internals depend on the underlying cash market being active. A strong futures move at 7:00 a.m. ET should not be described as confirmed by normal cash-session breadth that has not yet developed. Futures trade before the stock market's internals wake up.
The 9:30 a.m. open creates the opposite problem because thousands of stocks are entering price discovery at roughly the same time. Breadth can change rapidly as issues open, TICK can swing sharply, and up/down volume relationships can establish themselves quickly, so the first isolated reading deserves caution. Strong opening confirmation can describe broad participation without repairing a poor entry after price has already become extended.
Midday often brings a different information environment. Volume may decline, TICK can oscillate repeatedly around neutral, breadth can stabilize, and the index can rotate without decisive participation, so the dashboard may simply be describing balance. This connects naturally with the three market states: when the market is balanced, internals often describe the balance instead of solving it.
Late-session flows and major economic events can change the picture again. Closing activity, hedging, benchmark flows, or an FOMC reaction can produce rapid shifts in participation and TICK, but the internals are describing how broad the reaction is rather than telling the trader that the reaction has finished. Market internals are not detached from the session clock.
Internals Should Confirm or Challenge a Setup
Suppose ES reaches meaningful support and begins to stabilize. Improving breadth, firmer TICK behavior, and fading down-volume dominance may strengthen the context for a possible long because broader selling is no longer deteriorating in the same way. They still do not create the entry, define invalidation, or guarantee the turn.
The same hierarchy applies to trend and breakout trades. Broad participation can strengthen the environment around a breakout, but a trader arriving after price is badly extended can still have a poor trade despite excellent internals. Strong confirmation does not repair a bad entry.
This is why context comes before the candle, and context should also come before the dashboard. Market internals belong downstream of location, structure, volatility, market state, and a setup that has already earned attention. Use internals to grade the environment—not to manufacture the trade.
The behavioral danger is confirmation shopping. If breadth disagrees, TICK disagrees, and volume is mixed, searching until one extra indicator flashes green does not make the evidence coherent. Conflicting internals are themselves information, and sometimes the dashboard's best conclusion is that there is no useful confirmation.
Keep the Dashboard Comparable and Portable
Platform symbols are not universal, and different providers can produce slightly different breadth readings. StockCharts notes that breadth data can differ because component universes and underlying price data may differ, which means two dashboards can disagree without one necessarily being broken. The concept is portable; the ticker symbol often is not. (chartschool.stockcharts.com)
Before deciding that two internals disagree, verify that they were built to answer comparable questions. Mixing NYSE breadth, Nasdaq TICK, an S&P-specific volume series, and another provider's differently constructed data can create apparent complexity that is really a mismatch of universes. Before asking whether the internals agree, make sure they were built to answer comparable questions.
There are many additional tools worth studying, including TRIN, new highs and lows, McClellan measures, cumulative TICK, and sector-specific breadth. They can have legitimate roles, but adding them simply because they exist can turn a useful dashboard into another source of noise. A dashboard is supposed to reduce uncertainty—not bury the trader underneath more gauges.
A Practical ETM Market-Internals Framework
Use Price → Breadth → TICK → Volume → Agreement → Context → Decision. The sequence keeps the index chart at the front of the process and gives every internal one distinct job rather than allowing any reading to become an automatic trade command. The final decision still belongs to the setup and its risk.
- Price: What are ES, NQ, or YM actually doing?
- Breadth: How many stocks are participating?
- TICK: What does immediate stock-level pressure look like?
- Volume: Where is trading activity concentrated?
- Agreement: Do price and internals broadly support one another or disagree?
- Context: What are the location, structure, volatility, market state, and time of day?
- Decision: Does the internal picture strengthen or weaken a setup that has already earned attention?
The better question is not “Which internal is giving me a signal?” Ask, “Does the movement I can see on the index have enough participation, pressure, and volume underneath it to deserve more confidence at this location?” That keeps the trader focused on evidence instead of reaction.
Observation also needs to stay separate from prediction. “Breadth is strongly positive” is a direct description, “participation is supporting the rally” is a reasonable interpretation when the universe is understood, and “therefore ES must continue higher” is a much larger claim. Internals become dangerous when description quietly turns into prediction.
Final Thought
Market internals are useful because they let futures traders look beneath a weighted index and ask how much of the broader equity market is actually participating. Breadth counts participation, TICK shows the immediate pulse of stock-level movement, and up/down volume adds the weight of trading activity. Each one answers a different question.
The objective is not to make a crowded dashboard flash green or red. Compare price with the participation underneath it, notice whether the evidence agrees or conflicts, and place that information back inside location, structure, market state, and time of day. Price still comes first, and the setup still has to earn risk.
A smaller dashboard used consistently is usually more useful than a larger dashboard used selectively. The goal is not to find enough indicators to justify the trade you already wanted; it is to improve the quality of the market read before acting. That evidence-first discipline is part of the broader process developed throughout Decode the Market.
Educational content only. Trading involves substantial risk and is not suitable for everyone.