
Watching an index is useful because it compresses the movement of many individual stocks into one number. The problem is that one number can hide very different internal conditions. An index may rise while hundreds of stocks participate, or it may rise because a relatively small group of heavily weighted companies is doing most of the work. Both sessions can produce a green index candle, but they do not describe the same market underneath.
That distinction makes breadth an important part of understanding The Market. Breadth does not replace price, and it should not be treated as a separate system that predicts what the index must do next. It gives the trader another dimension of evidence: participation. The cleaner question becomes not only “Is the index moving?” but also “How much of the market is moving with it?”
What Market Breadth Actually Measures
Market breadth is a broad term for measurements that describe participation across a group of securities. A simple example is the number of stocks advancing compared with the number declining, but breadth can also examine new highs and lows, the percentage of stocks above a moving average, sector participation, or the behavior of an equal-weight index relative to its capitalization-weighted counterpart. The market-internals dashboard guide shows how breadth can be evaluated alongside TICK and up volume versus down volume. Each measure asks a slightly different question. The common purpose is to look beyond the headline index level.
Sector rotation is another way to see whether leadership supports that broader participation.
That matters because an index is not necessarily a democratic vote among its components. The S&P 500, for example, is float-adjusted market-cap weighted, which means larger companies have a greater effect on the index's movement than smaller companies. Its equal-weight counterpart contains essentially the same companies but assigns each company the same target weight at rebalancing. Comparing those perspectives can help reveal whether strength is broadly distributed or concentrated in the largest names. (spglobal.com)
Price Can Be Strong While Participation Is Narrow
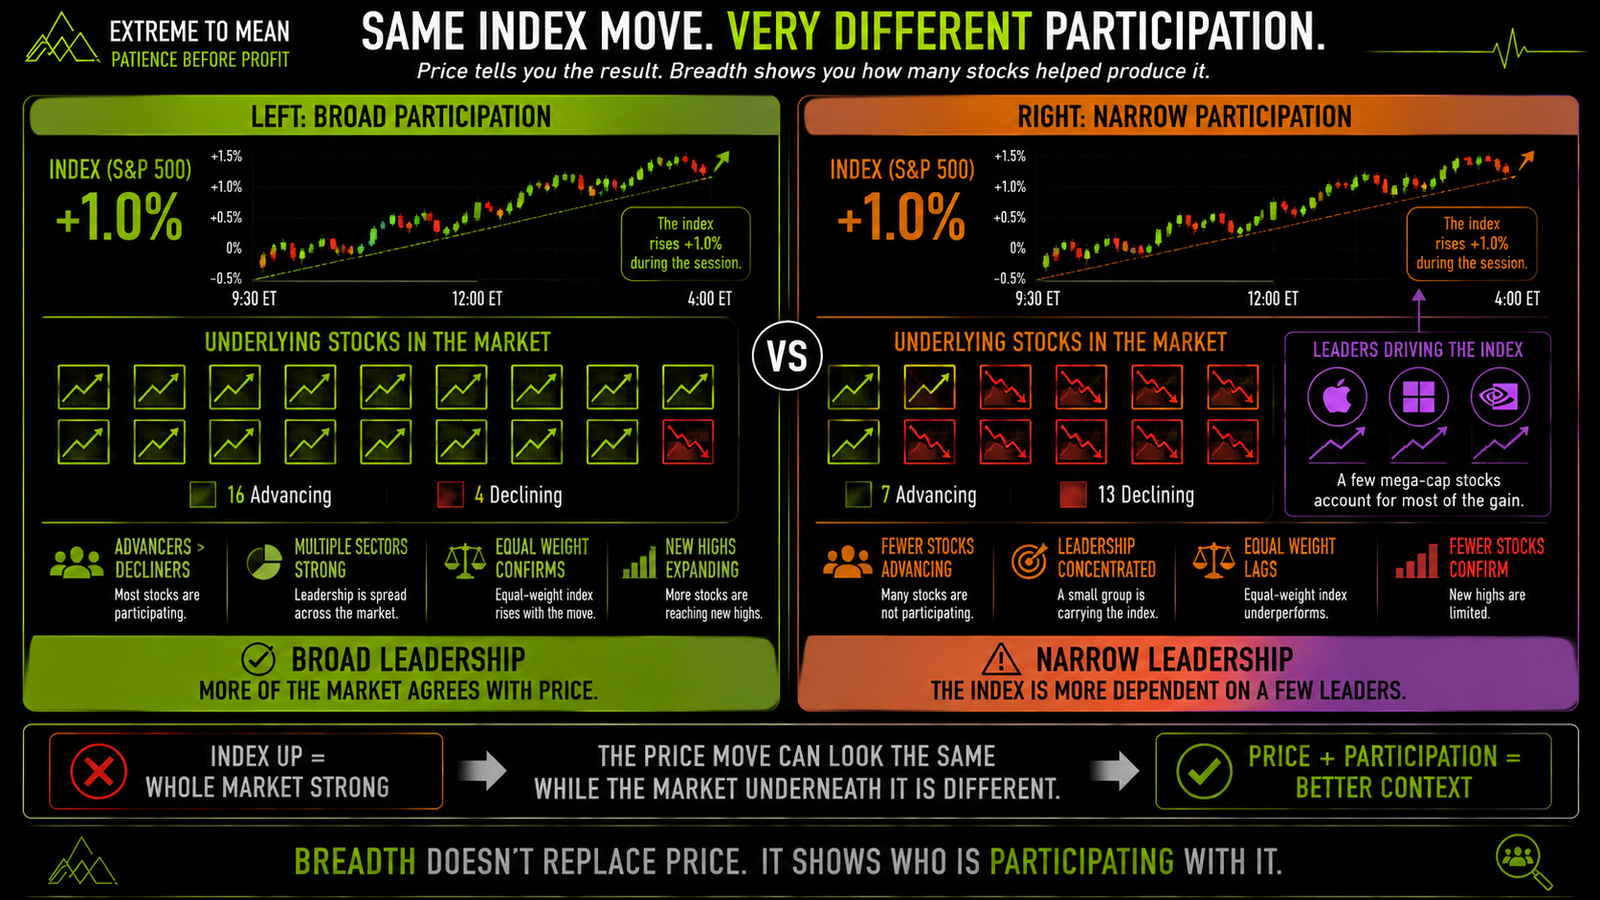
Imagine the S&P 500 rising steadily throughout the session. Looking only at the index, the move may appear unquestionably strong because price is making higher highs and holding above earlier structure. Yet several of the largest companies could be responsible for much of that gain while a large portion of the remaining index is flat or declining. The index price is still correct; it is simply not telling you how evenly the strength is distributed.
This is one consequence of capitalization weighting. The largest constituents can have substantially more influence over the benchmark than individual smaller constituents, while equal weighting removes much of that size bias. S&P Dow Jones Indices and CME both discuss equal weighting in the context of concentration and broader participation, making the comparison useful when market leadership becomes narrow. (spglobal.com)
Common Breadth Measures Ask Different Questions
The advance-decline relationship is one of the easiest breadth concepts to understand. If substantially more stocks are advancing than declining while an index rises, participation is broad in that particular sense; if the index rises while decliners dominate, the index and the broader stock population are telling different stories. Traders can observe the relationship for one session or accumulate it over time in an advance-decline line. The important point is that the measure counts participation rather than weighting the largest stock more heavily.
Other breadth tools examine different dimensions. New highs versus new lows can show how many stocks are reaching important extremes, while the percentage of stocks above a chosen moving average can describe how much of the market is participating in an established trend. Sector breadth asks whether leadership is spread across several areas of the economy or concentrated in one or two groups. Equal-weight versus cap-weight performance offers another view by reducing the disproportionate influence of the largest companies.
Broad Participation Can Confirm What Price Is Saying
Suppose an index breaks through important resistance and begins establishing higher structure. If the move is accompanied by a large number of advancing stocks, strengthening sectors, and solid participation beyond the largest index names, the internal market is broadly agreeing with the headline price move. That does not make continuation certain. It does mean the directional thesis is supported by more than a small leadership group.
Broad participation can be especially useful when deciding whether an index breakout reflects a wider change in risk appetite or only isolated strength. CME has used relative strength in equal-weight and broader-market indexes as evidence of broadening market leadership, illustrating why traders compare headline benchmarks with less concentrated measures. (cmegroup.com) The breadth evidence adds context to price; it does not convert the breakout into an automatic entry.
Narrow Participation Makes the Move More Dependent on Leadership
Narrow breadth describes an environment where a smaller portion of the market is responsible for a larger share of the index's progress. This can happen when mega-cap stocks dominate leadership, when only a few sectors are advancing, or when an index reaches new highs while fewer individual stocks are doing the same. The move can continue for a long time despite that concentration. Narrow does not mean the market must reverse.
What changes is the dependency structure. If a small number of influential companies are carrying the benchmark, the index becomes more dependent on those leaders maintaining their relative strength. S&P Dow Jones Indices specifically analyzes concentration as a characteristic of capitalization-weighted benchmarks and notes that equal weighting materially reduces the dominance of the largest constituents. (spglobal.com) A concentrated advance can therefore remain valid while offering weaker evidence of broad participation.
Breadth Divergence Is Context, Not a Timing Signal
Traders often become interested when price and breadth diverge. An index may continue reaching higher highs while fewer stocks participate, or the index may remain weak while underlying breadth begins improving. That disagreement deserves attention because one layer of the market is changing before the headline index clearly reflects it. It does not tell the trader exactly when price will reverse.
This is where breadth can become misused. A trader sees deteriorating participation and immediately shorts an index that remains in a strong structural trend, treating divergence as proof that price must follow breadth on the next candle. The cleaner approach is similar to the principle behind context comes before the candle: breadth changes the quality of the evidence, while price structure and confirmation still determine whether a trade is ready. A divergence can persist while market leaders continue carrying the index.
Breadth Can Change Across Size and Sector
There is no single market-breadth reading that captures every part of the equity market. Large-cap stocks can behave differently from small caps, technology can lead while financials lag, and defensive sectors can strengthen while more cyclical areas weaken. Looking across size and sector can reveal whether the market's apparent direction is widespread or concentrated in a particular segment. This makes breadth especially useful when major indexes appear to disagree with one another.
The choice of benchmark matters for the same reason. CME now offers broad U.S. equity-index exposure spanning large-, mid-, and small-cap stocks, while S&P maintains indexes designed to measure both capitalization-weighted and equal-weighted market segments. (cmegroup.com) A trader does not need to monitor every possible index, but understanding that participation can vary beneath the headline benchmark prevents one market measure from being mistaken for the entire equity landscape.
Breadth Must Match the Time Horizon
Intraday breadth and multiweek breadth answer different questions. A morning surge in advancing stocks may describe the current session's participation, while the percentage of stocks maintaining longer-term uptrends can say something different about the larger market environment. Neither horizon automatically overrides the other. The trader should match the breadth evidence to the decision being evaluated.
This is another application of the three market states. A broadly advancing intraday market can still exist inside a larger rotational environment, while a narrow session can occur inside a healthy longer-term trend. The relevant question is whether breadth supports or challenges the market state on the timeframe that matters to the trade. Mixing horizons can create apparent contradictions that disappear once the measurements are properly separated.
A Cleaner Way to Use Breadth
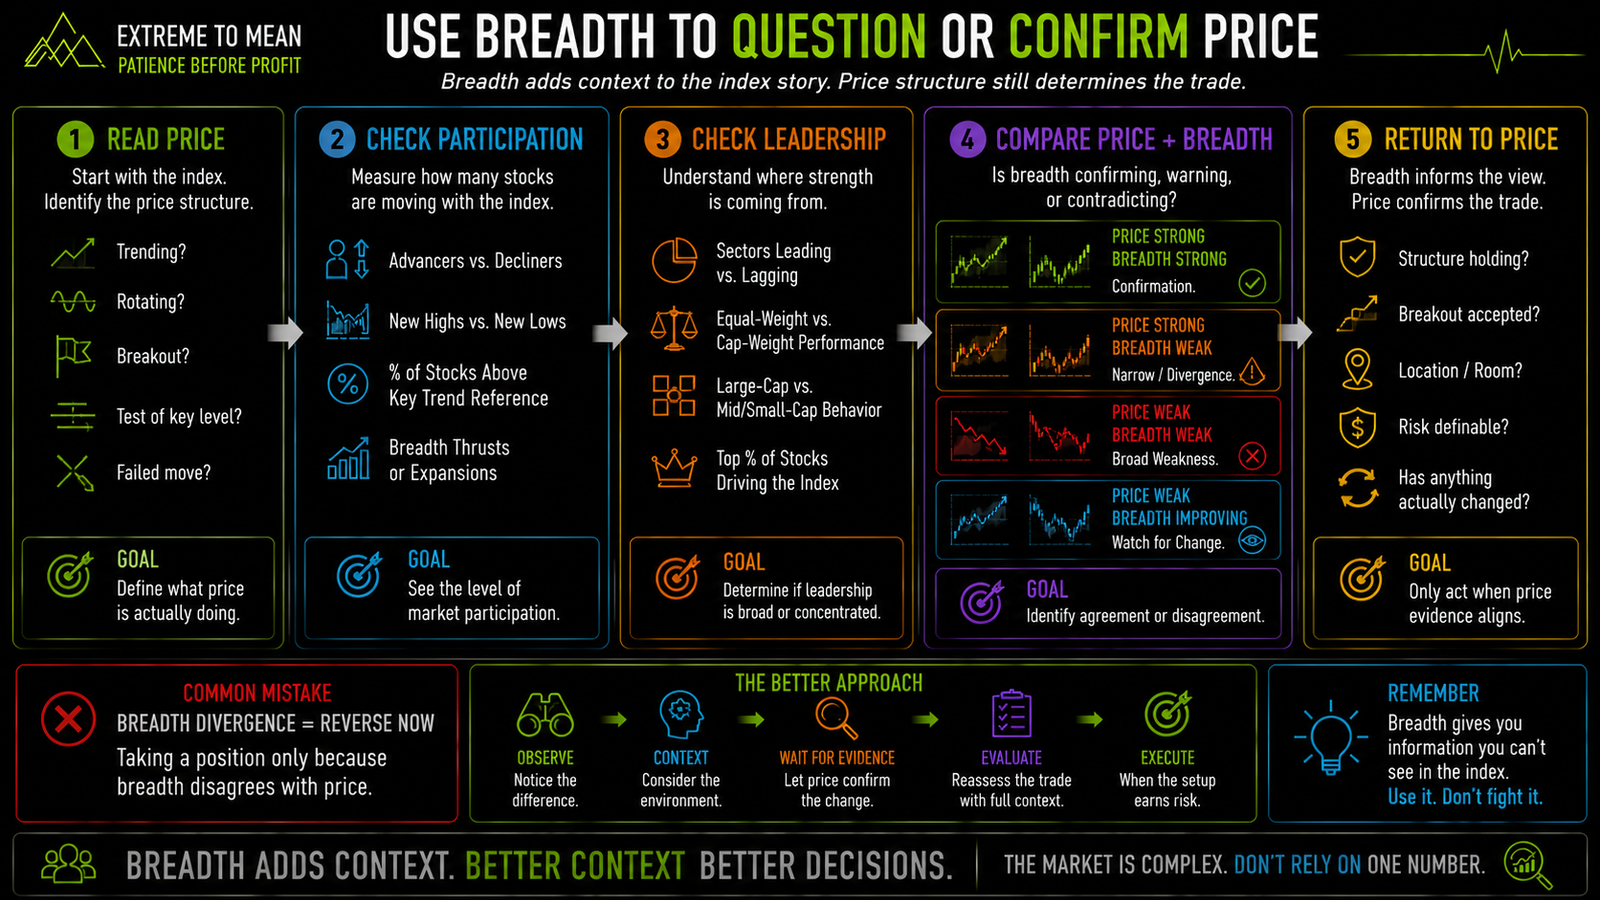
Start with price because price defines the actual index structure being traded. Determine whether the market is trending, rotating, breaking structure, testing an important level, or transitioning between conditions. Then use breadth to ask whether participation supports that interpretation. Price and breadth should be combined as evidence rather than forced into competition.
Next, identify where any disagreement comes from. Is the index rising because only a few mega-cap names are strong, or are sectors and individual stocks broadly advancing? Is breadth weakening while price structure remains intact, or has deteriorating participation been joined by failed breakouts and lost acceptance? This is why market conditions change the quality of a setup: breadth can strengthen or weaken the context without becoming the setup itself.
Better Questions When Price and Breadth Disagree
A useful breadth review should prevent the trader from reducing the market to a single green or red index number. The objective is to understand who is participating, where leadership is concentrated, and whether the internal evidence is strengthening or questioning the current price structure. Breadth works best as a confirmation and diagnostic layer. It becomes less useful when one reading is treated as a standalone forecast.
- Is the index move supported by many stocks or concentrated in a few leaders?
- Are advancers or decliners broadly consistent with the index direction?
- Are multiple sectors participating?
- Is equal-weight performance confirming the cap-weighted benchmark?
- Are small- and mid-cap stocks participating, or is strength limited to large caps?
- Are more stocks making new highs as the index advances?
- Is breadth improving, stable, or deteriorating?
- Does any breadth divergence exist on the same timeframe as my trade?
- Has price structure actually changed, or is breadth merely warning me to pay closer attention?
- Am I using breadth to evaluate price, or trying to make breadth predict price?
These questions also improve market review. Instead of recording only that the S&P 500 rose or the Dow fell, the trader can note whether the move was broad, concentrated, strengthening, or losing participation. Over time, that provides a richer record of the environment surrounding good and poor decisions. For traders building a broader market-context routine, the Macro Playbook is a natural next step for organizing breadth alongside other market and economic evidence.
Final Thought
Market breadth tells you something price alone cannot: how widely the movement is being shared across the market underneath the index. A rising benchmark supported by broad participation describes a different internal environment from a rising benchmark carried primarily by a small number of heavily weighted leaders. Both moves are real, and either can continue. Breadth improves the description of the move without guaranteeing its outcome.
Use price to define the structure and breadth to evaluate participation inside that structure. Broad participation can add confirmation, narrow participation can justify greater caution, and divergence can signal that the internal market deserves closer attention. None of those observations removes the need for location, confirmation, and defined risk. The trader's job is to evaluate what the index is doing and who is actually participating with it.
Educational content only. Trading involves substantial risk and is not suitable for everyone.