
Cumulative Volume Delta, usually shortened to CVD, takes individual volume-delta measurements and accumulates them over time. That can help a futures trader compare what price accomplished with how aggressive transaction activity was classified while the move developed. Inside The Market, CVD belongs in the evidence layer rather than the signal layer.
There is also an important complication hidden behind the clean line on the chart: not every platform calculates the underlying delta the same way. Some implementations use bid-versus-ask transaction classification, others can use up-tick and down-tick logic, and some estimate positive and negative volume from lower-timeframe price behavior. Before interpreting CVD, know what your platform means by delta.
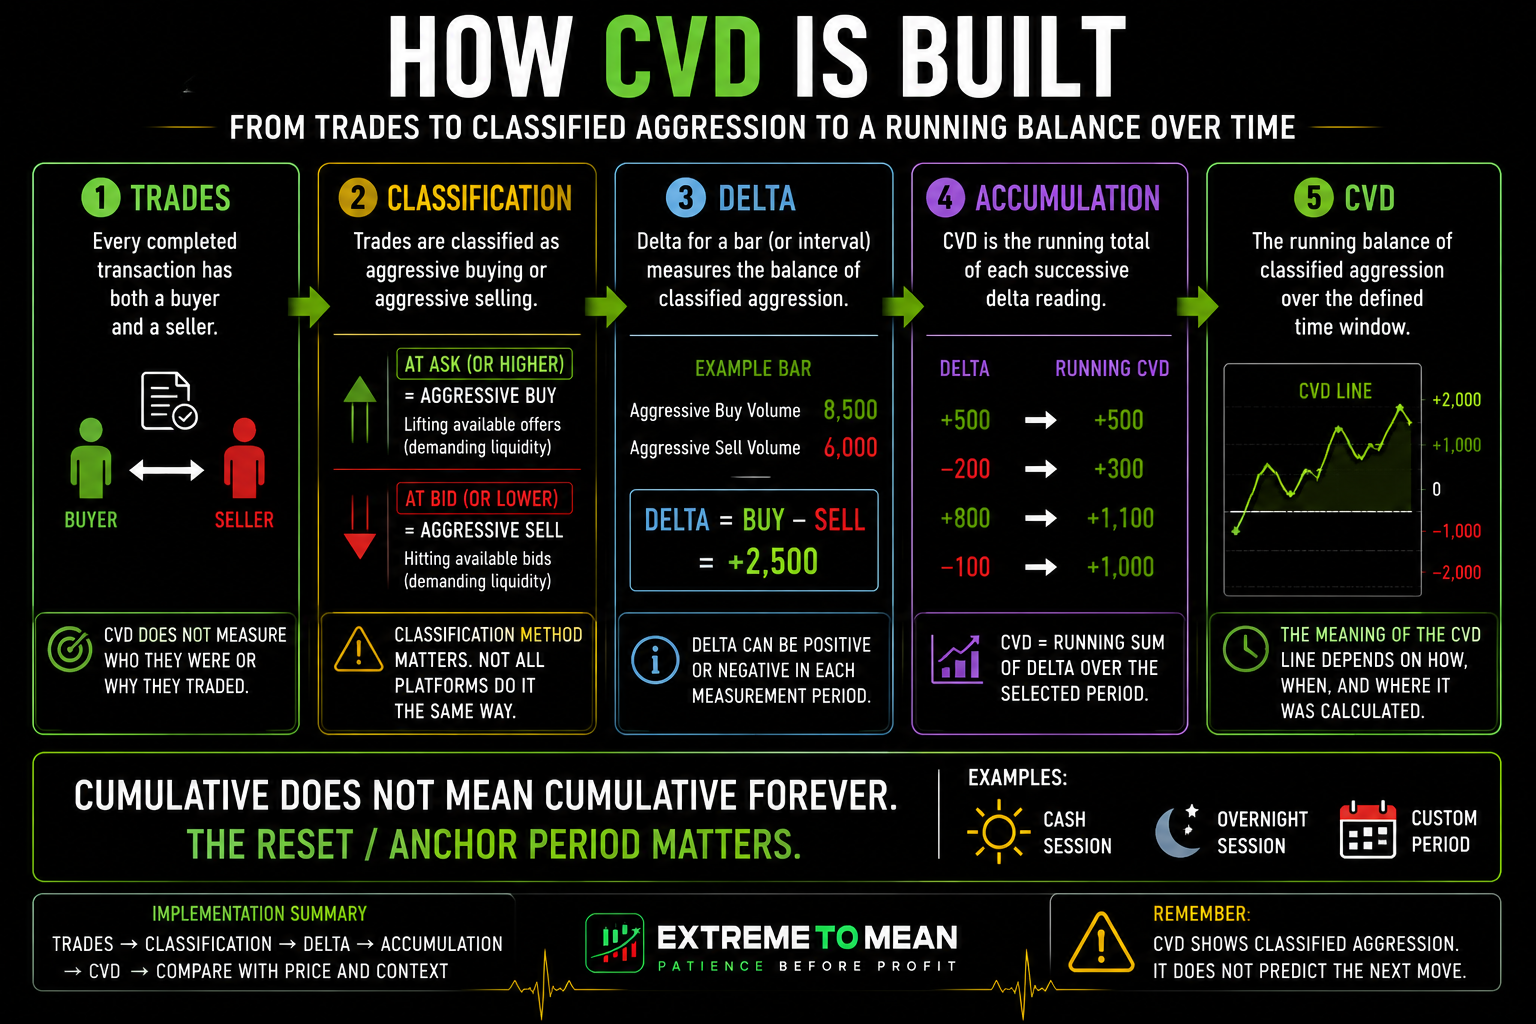
Every Trade Has a Buyer and a Seller
A common beginner explanation says positive delta means there were “more buyers than sellers.” That cannot describe completed transactions because every executed futures trade required both a buyer and a seller. The useful distinction is which side demanded liquidity more aggressively.
In a central limit order book, passive participants can place resting bids and offers while aggressive participants transact against that available liquidity. An aggressive buyer lifts available offers, while an aggressive seller hits available bids. Every trade has a buyer and seller; delta asks which side demanded liquidity. (cmegroup.com)
Suppose one bar contains 8,500 contracts classified as aggressive buying and 6,000 classified as aggressive selling. Conceptually, the bar's delta would be +2,500, indicating that more executed volume was classified toward aggressive buying during that measurement period. It does not prove that price must rise, that institutions were buying, or that the next candle should be bullish.
How Delta Becomes Cumulative Delta
Ordinary delta describes one measurement interval, while CVD asks how that classified aggression has accumulated across a larger period. Conceptually, if four successive delta readings are +500, -200, +800, and -100, the running cumulative values become +500, +300, +1,100, and +1,000. The arithmetic is simple; the value comes from seeing how the balance of aggression develops through time.
Delta = Classified Aggressive Buying Volume − Classified Aggressive Selling Volume
CVD = Running Sum of Delta
Cumulative does not mean cumulative forever. NinjaTrader can accumulate its Order Flow Cumulative Delta through a session or restart it for each bar, while TradingView's CVD resets when a new selected anchor period begins. A CVD reading therefore has meaning only relative to the window over which it was accumulated. (ninjatrader.com)
This is why an overnight CVD, a cash-session CVD, and a weekly CVD can answer different questions even when they use the same market. A trader resetting at the futures-session open may carry hours of overnight activity that another trader intentionally discards with a 9:30 a.m. reset. Before comparing CVD, compare the reset.
The Calculation Method Matters
NinjaTrader's Order Flow Cumulative Delta can use either BidAsk or UpDownTick classification. In BidAsk mode, trades filled at the ask or higher are classified as buying pressure and trades at the bid or lower as selling pressure; its UpDownTick mode instead classifies activity according to whether transactions occur on upward or downward ticks. Those are different ways of turning transaction data into delta. (ninjatrader.com)
TradingView's standard CVD works differently. It analyzes lower-timeframe intrabars, classifies their volume as positive or negative using price movement, and then accumulates those estimated values through the selected anchor period. TradingView also notes that using lower intrabar timeframes improves precision at the cost of having less historical coverage available. (tradingview.com)
That means two traders can both say they are looking at “CVD” without necessarily looking at identical measurements. Data provider, classification logic, session template, reset period, lower-timeframe availability, and indicator settings can all influence the result. If the inputs differ, the CVD can differ.
Price and CVD Agreement
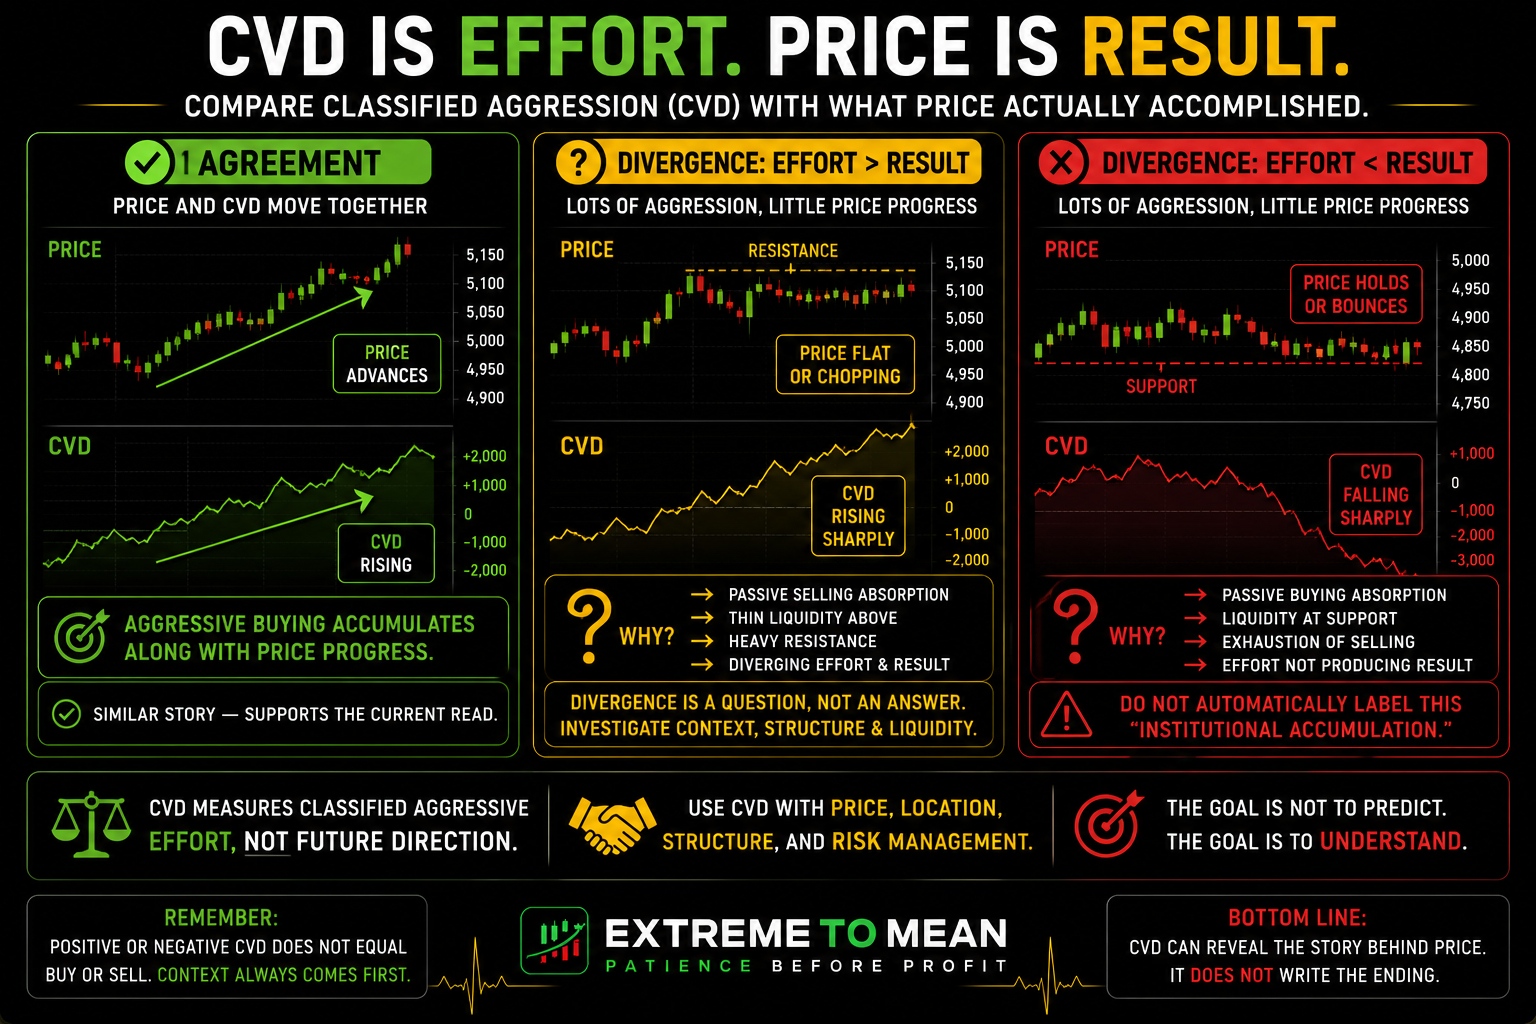
The easiest relationship to understand is agreement. If ES is advancing and CVD is also rising, price progress is occurring alongside continued accumulation of activity classified toward aggressive buying. That can support the observation that aggressive buyers are participating with the move without turning the indicator into automatic long permission.
The bearish version works the same way. If price is declining while CVD also declines, aggressive selling is accumulating while price continues traveling lower. Agreement tells you that price and classified aggression are telling a similar story—not that the story cannot change.
Location still decides how useful that information is. Strong positive CVD directly beneath major resistance after a large extension can accurately describe aggressive buying while still accompanying a terrible place to chase a long. Context comes before the candle, and it also comes before the indicator.
Divergence Is a Question, Not an Answer
Price and CVD become especially interesting when they stop agreeing. Suppose NQ makes a new session high while CVD fails to make a corresponding high or begins declining; that relationship can reasonably be called bearish price/CVD divergence. The useful question is why price is advancing without the same expansion in the measured aggression—not whether the trader should immediately short.
Delta Divergence Explained examines that disagreement without turning it into a reversal signal.
Several mechanisms could contribute to that disagreement. Passive liquidity may be absorbing aggressive activity, available liquidity may be unusually thin, the classification method may be affecting the reading, or broader structure may simply be overpowering the short-term flow. Divergence is a question, not an answer.
The inverse matters too. Aggressive sellers can continue hitting bids while price refuses to make proportional downside progress, or aggressive buyers can keep lifting offers while price barely advances. CVD can reveal that mismatch, but it does not by itself prove absorption, exhaustion, accumulation, distribution, or an imminent reversal.
Absorption vs. Exhaustion explains two different ways price can stall despite active execution.
A useful way to think about the relationship is effort versus result. CVD is one possible measure of classified aggressive effort, while price shows the result the market actually produced from all the interacting liquidity and transactions. Sometimes the important information is not that delta is large; it is that price did surprisingly little with it.
Why Price Can Rise While CVD Falls
Price does not move according to a simple equation where positive delta forces price higher and negative delta forces it lower. Aggressive orders interact with whatever passive liquidity is available, and the amount and replenishment of that liquidity can change continuously. Aggression only makes sense in relation to the liquidity available to absorb it. (cmegroup.com)
Imagine aggressive sellers repeatedly hitting bids while price barely falls. If enough passive buying continues meeting that selling pressure and liquidity above later becomes thinner, price can eventually rise even though recent delta has been negative. The defensible observation is that aggressive selling failed to create proportional downside progress—not that “institutions were accumulating.”
The same principle works in reverse when CVD rises while price weakens. Aggressive buyers may be lifting offers without achieving meaningful upward progress because enough selling liquidity is meeting that demand. Price tells you what the market accomplished; CVD helps you examine the aggression behind that accomplishment.
What CVD Cannot Tell You
Positive CVD does not identify institutional buying, and negative CVD does not identify institutional selling. The measurement generally does not tell you whether the aggressive participant was a hedge fund, market maker, retail trader, hedger, arbitrageur, or another type of participant. CVD can classify aggression; it cannot identify the aggressor's business card.
It also cannot tell you whether a market buy opened a new long or closed an existing short. Likewise, a market sell might open a short or close a long, so positive cumulative delta should not automatically be translated into “traders are building long positions.” That is one reason CVD and open interest answer fundamentally different questions.
CVD also does not know whether price is sitting at major support, directly beneath resistance, in the middle of random chop, or at the end of an extended move. The same indicator behavior can occur in all of those locations while carrying very different trading implications. Order flow may describe pressure; it does not decide whether the place you are trading matters.
CVD Is Not Volume, Open Interest, DOM, or a Footprint
Ordinary volume measures how much traded, while delta attempts to classify that executed volume between aggressive sides and CVD accumulates those classifications through time. A high-volume bar can have relatively small net delta if buying and selling aggression were close to balanced, while a lower-volume bar can produce a much larger net delta. These measurements overlap without answering the same question.
Open interest measures outstanding futures contracts that remain open, which is different from classified transaction aggression. The DOM or market depth primarily shows resting liquidity waiting in the order book, while CVD is built from executed activity or an estimate of that activity according to the platform's methodology. DOM looks at what is waiting; CVD looks at what has traded or been classified from trading activity.
A footprint chart provides more granular transaction information at individual prices inside bars. CVD compresses some form of buy-versus-sell classification into a running measurement through time, making it easier to compare accumulated aggression with price progression. The broader Order Flow Trading framework is useful because each tool should answer a specific question rather than becoming another panel that says “buy” or “sell.”
| Tool | Primary Question |
|---|---|
| Volume | How much traded? |
| Delta | How was executed activity classified between aggressive sides? |
| CVD | How has that delta accumulated across the selected period? |
| Open Interest | How many futures contracts remain open? |
| DOM / Market Depth | What resting liquidity is currently displayed? |
| Footprint | Where inside the bar did transaction activity occur? |
CVD at Breakouts and Extremes
Suppose ES breaks above established resistance while CVD expands with it. Aggressive buying is participating in the breakout, but the trader still needs to determine whether price sustains acceptance beyond the level, whether there is room for the trade, and where invalidation belongs. The liquidity-sweep versus failed-breakout framework remains useful because CVD participation alone cannot determine whether the breakout will hold.
At a stretched downside location, falling price with CVD no longer making new lows may deserve attention for a different reason. Selling aggression may be changing or failing to produce the same progress, but the market can continue lower long after the divergence becomes visible. A mean-reversion trader still needs stabilization, structure, location, and an actual setup rather than treating the disagreement as permission to catch the bottom.
This is where CVD can quietly become a confirmation-bias machine. A trader who wants to short may change timeframe, reset period, comparison swings, or even CVD tool until one version finally produces bearish divergence. An indicator is not confirmation if you keep changing the question until it gives you the answer you wanted.
A Practical CVD Framework
Use Price → Location → Delta → CVD → Agreement/Disagreement → Structure → Decision. The sequence keeps actual market outcome and meaningful location upstream of the order-flow indicator. CVD adds evidence; it does not create the trade.
- Price: What is the market actually accomplishing?
- Location: Where is that behavior occurring?
- Delta: What does current classified aggression look like?
- CVD: How has that aggression accumulated across the chosen period?
- Agreement / Disagreement: Are price and CVD telling a similar or different story?
- Structure: Has price actually confirmed anything meaningful?
- Decision: Does this evidence improve a qualified trade—or simply add another observation?
The better question is not “Is CVD bullish or bearish?” Ask, “What is price accomplishing relative to the aggression CVD is measuring, and does that relationship matter at this location?” Then ask whether you understand the calculation method and reset period well enough to trust what the indicator is actually showing.
CVD should make the trader ask better questions rather than provide stronger excuses for a position they already wanted. Numerical precision does not create market certainty, and an impressive-looking divergence is still only evidence until price and structure do something meaningful with it. Market conditions change the quality of a setup, regardless of how clean the indicator looks.
Final Thought
Cumulative Volume Delta is useful because it organizes a sequence of classified buying-versus-selling aggression into a running measurement that can be compared with price. When price and CVD agree, the relationship can support the current read; when they disagree, the mismatch can reveal something worth investigating. Neither condition determines the next move.
The calculation underneath the indicator matters just as much as the pattern drawn by the line. Bid/ask classification, up/down-tick classification, lower-timeframe estimation, reset periods, data availability, and platform settings can all change what the CVD actually represents. There is no useful interpretation of CVD without first understanding how the underlying volume was classified. (ninjatrader.com)
Keep the hierarchy simple: price first, location and structure next, CVD as supporting evidence, and risk before action. CVD can help explain the relationship between aggression and what price accomplished, but it does not replace the trader's responsibility to qualify the trade. That evidence-first approach is part of the broader market-reading process developed throughout Decode the Market.
Educational content only. Trading involves substantial risk and is not suitable for everyone.