
Inside The Market, order flow belongs downstream of context and location rather than at the beginning of the decision. A trader should first know why a price area matters and what they are trying to understand before deciding whether CVD, a footprint, the DOM, tape, or an imbalance display can help. Choose the tool after the question—not the question after opening the tool.
This matters because order-flow screens can create an unusual sense of certainty. Numbers are moving, colors are changing, and several panels may appear to agree, yet five displays can still be repackaging the same underlying transaction data. More order-flow data does not automatically produce more information.
“Order Flow Indicator” Is a Loose Term
Not everything traders call an order-flow indicator is actually a traditional calculated indicator. Some tools derive a new series from transaction data, while others organize executed trades, display resting liquidity, or show the immediate stream of completed transactions. Order-flow tools do not all measure the same thing just because traders place them in the same category.
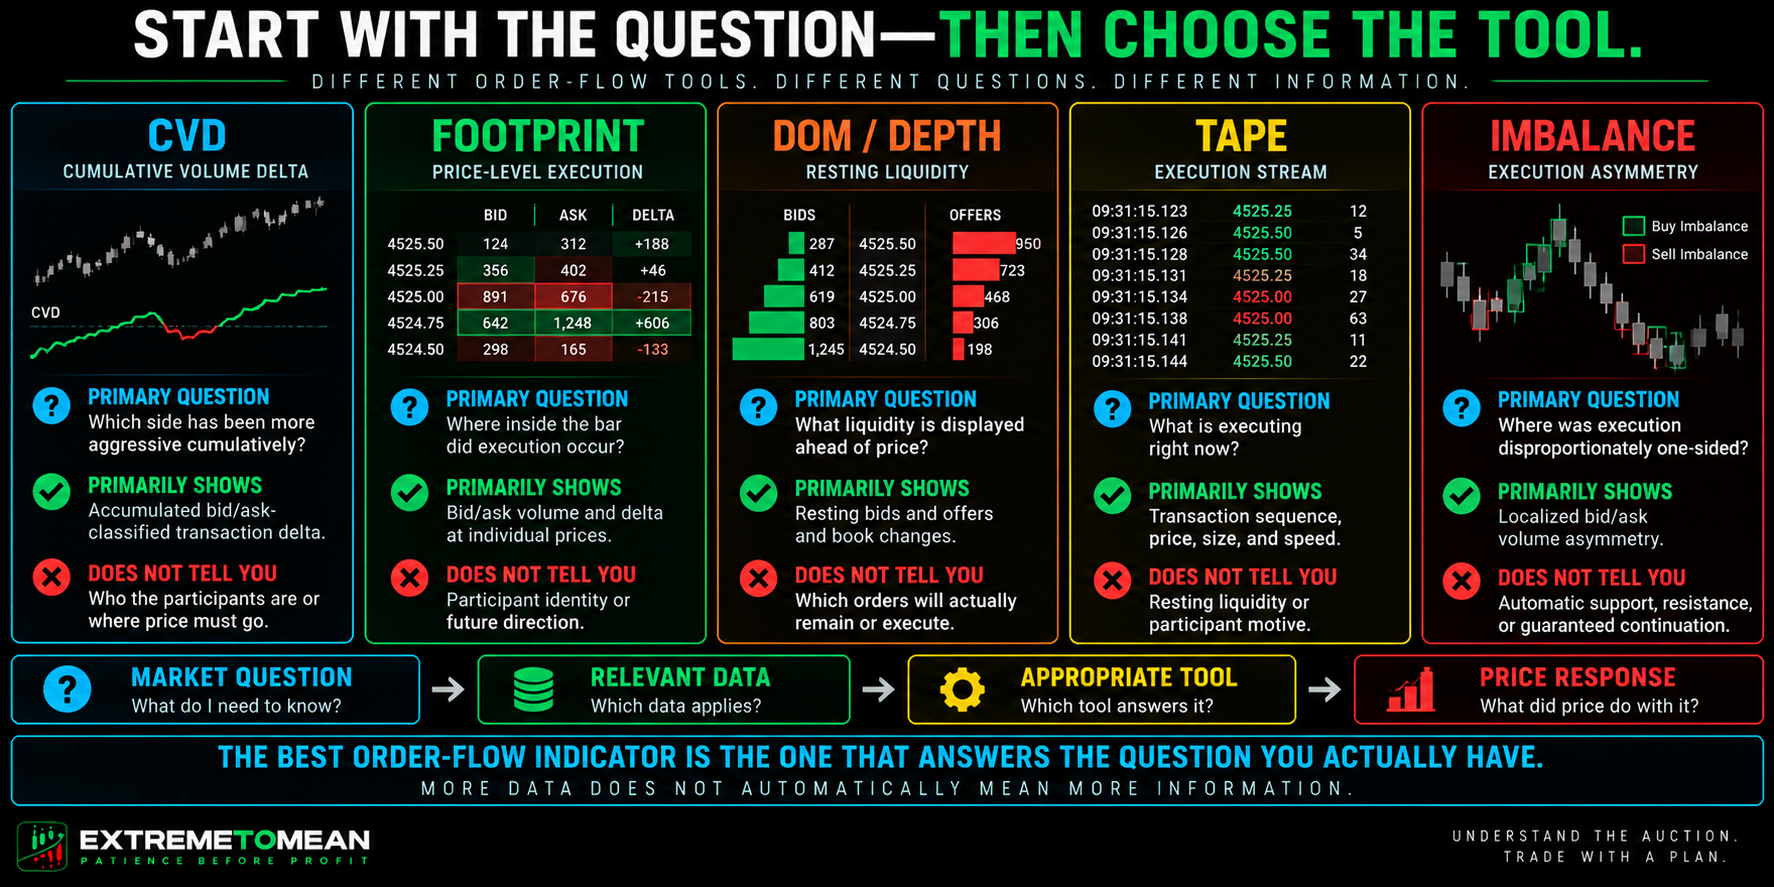
CVD is a derived series because classified buying and selling aggression is accumulated through time. A footprint is primarily a transaction visualization because it organizes executed volume at individual prices inside a bar, while the DOM is an order-book display showing currently resting bids and offers. Tape, or Time & Sales, is closer to an execution stream because it shows transactions after they actually occur.
Bid-ask imbalance tools add another layer by applying a comparison rule to executed volume. Their highlighted cells depend not only on what traded but also on settings such as the comparison method, threshold, and minimum volume. The highlight comes from market data plus the trader's configuration.
Start With What Order Flow Actually Measures
Every completed futures transaction still has a buyer and a seller. The useful distinction is not whether buyers or sellers existed, but how the transaction occurred: one participant may demand immediate execution while another supplies resting liquidity. The broader order-flow trading foundation explains why aggressive and passive behavior should be described without pretending the screen reveals everyone's identity or intention.
An aggressive buyer crosses available liquidity to execute against an offer, while an aggressive seller trades against a bid. That describes execution behavior, not intelligence, institutional status, or whether the participant will ultimately be correct. Aggressive describes how someone traded—not how smart the trade was.
That distinction is important because order-flow language easily becomes storytelling. “Aggressive buyers are active” is an observation based on classified execution, while “smart money is accumulating before the breakout” assigns identity, motive, and future direction that the data did not provide. Better order-flow reading begins by saying only what the information actually supports.
The Five Core Order-Flow Tools Answer Different Questions
The simplest way to compare order-flow indicators is by the question each tool is built to answer.
| Tool | Primary Question | Primarily Shows | Does Not Tell You |
|---|---|---|---|
| CVD | Which side has been more aggressive cumulatively? | Accumulated classified transaction delta | Who participated or where price must go |
| Footprint | Where inside the bar did execution occur? | Bid/ask volume and delta at individual prices | Future direction or participant identity |
| DOM / Depth | What liquidity is currently displayed? | Resting bids, offers, and book changes | Which displayed orders will remain or execute |
| Tape / Time & Sales | What is executing right now? | Sequence, price, and size of completed trades | Resting liquidity or participant motive |
| Imbalance | Where was execution disproportionately one-sided? | Localized bid/ask asymmetry | Automatic support, resistance, or continuation |
One tool answers cumulative aggression, another preserves location, another shows resting liquidity, another exposes transaction sequence, and another highlights localized asymmetry. Those are different dimensions of the auction, which means selecting the right display starts with identifying what information is actually missing. A trader does not need every piece of market data; a trader needs the information that can change the decision.
CVD and Footprints: Same Family, Different Compression
Cumulative Volume Delta is useful when the question concerns how classified aggressive activity has accumulated over a chosen period. If ES rises while CVD also rises, price strength is occurring alongside cumulative aggressive buying; if ES rises while CVD falls, the two measurements disagree and the discrepancy may deserve investigation. CVD is good at showing disagreement; it is not good at telling you how that disagreement must resolve.
Its strength is also its limitation because accumulation compresses detail. A positive CVD reading does not tell you exactly where the aggressive buying occurred, whether it appeared at an important extreme, whether passive sellers absorbed it, or whether most of the activity happened much earlier in the session. Cumulative information gains simplicity by losing location.
A footprint chart keeps much more of that location information. Instead of knowing only that a bar finished with positive or negative delta, a trader can inspect where bid-side and ask-side execution occurred at individual prices and where the bar's volume was concentrated. CVD summarizes the activity; a footprint opens the bar and shows where the activity happened.
That additional detail still does not reveal who placed the trades. Four hundred contracts executing at the ask tells us that classified activity occurred there, but it does not tell us whether the buyer was a hedge fund, market maker, retail trader, short covering a position, or somebody opening a new long. The footprint shows the transaction; the story about who made it remains an inference.
DOM and Tape: What Is Waiting vs. What Actually Traded
The DOM and market-depth view answers a different question because it primarily displays liquidity currently waiting in the order book. Large bids and offers may matter, especially near meaningful locations, but they can execute, move, change size, replenish, or disappear before price reaches them. DOM shows what participants are currently willing to advertise—not what they are guaranteed to do.
That makes displayed liquidity different from executed liquidity. A 1,500-contract offer does not mean 1,500 contracts have already sold there; it means that quantity is currently offered for execution. Displayed intention is not completed transaction.
Orders disappearing from the book also require restraint. Cancellation is observable, while deciding that a canceled order proves spoofing requires knowledge about intent that a trader cannot establish merely from watching the ladder. A disappearing order proves that the book changed—not why it changed.
Tape provides the complementary view because it shows transactions that actually occurred. Traders can observe execution price, size, sequence, repetition, and changing speed, but those observations still need a baseline because frantic tape at 9:31 may be normal while the same activity at 12:30 could be unusual. The DOM shows intention; the tape shows execution.
Imbalance Highlights Depend on the Rule
Bid-ask imbalance tools can be useful when a trader wants to identify localized areas where executed volume was disproportionately concentrated on one side. The implementation might compare horizontal bid and ask values, diagonal relationships, percentage ratios, minimum volume requirements, or stacked sequences. An imbalance is a comparison rule applied to executed activity—not a universal law of market behavior.
That means two traders can process the same transaction data and receive different highlighted cells. One platform may flag a 3-to-1 relationship, another may require 4-to-1, and a third configuration may reject both because the underlying volume is too small. The market did not change; the filter did.
This is why stacked buy imbalances should not automatically become future support, and stacked sell imbalances should not automatically become resistance. The display records a concentration of activity that occurred at those prices, while the market's response on a future test remains unknown. An imbalance records what happened there; it does not guarantee what happens when price returns.
Different Tools Can Disagree Without Contradicting Each Other
Imagine session CVD is strongly positive while the current footprint is negative, tape is showing fast selling, and a large bid is displayed below price. That can look like four contradictory messages, but the tools are describing different horizons and different types of information. Session CVD summarizes what happened cumulatively, footprint and tape describe more immediate execution, and the DOM describes liquidity currently waiting to trade.
The first question should therefore be whether the tools are actually measuring the same thing over the same horizon. A session-long accumulation can remain positive while sellers dominate the last minute, and resting bids can appear below both conditions without contradicting either one. Before calling order-flow tools contradictory, make sure they are answering the same question over the same timeframe.
This is also why platform configuration matters. CVD reset conventions, data-feed quality, bid/ask classification, depth subscriptions, aggregation, and imbalance thresholds can all cause two screens labeled with the same tool to look different. An order-flow display cannot be better than the market data and calculation feeding it.
The Redundancy Problem Creates False Confirmation
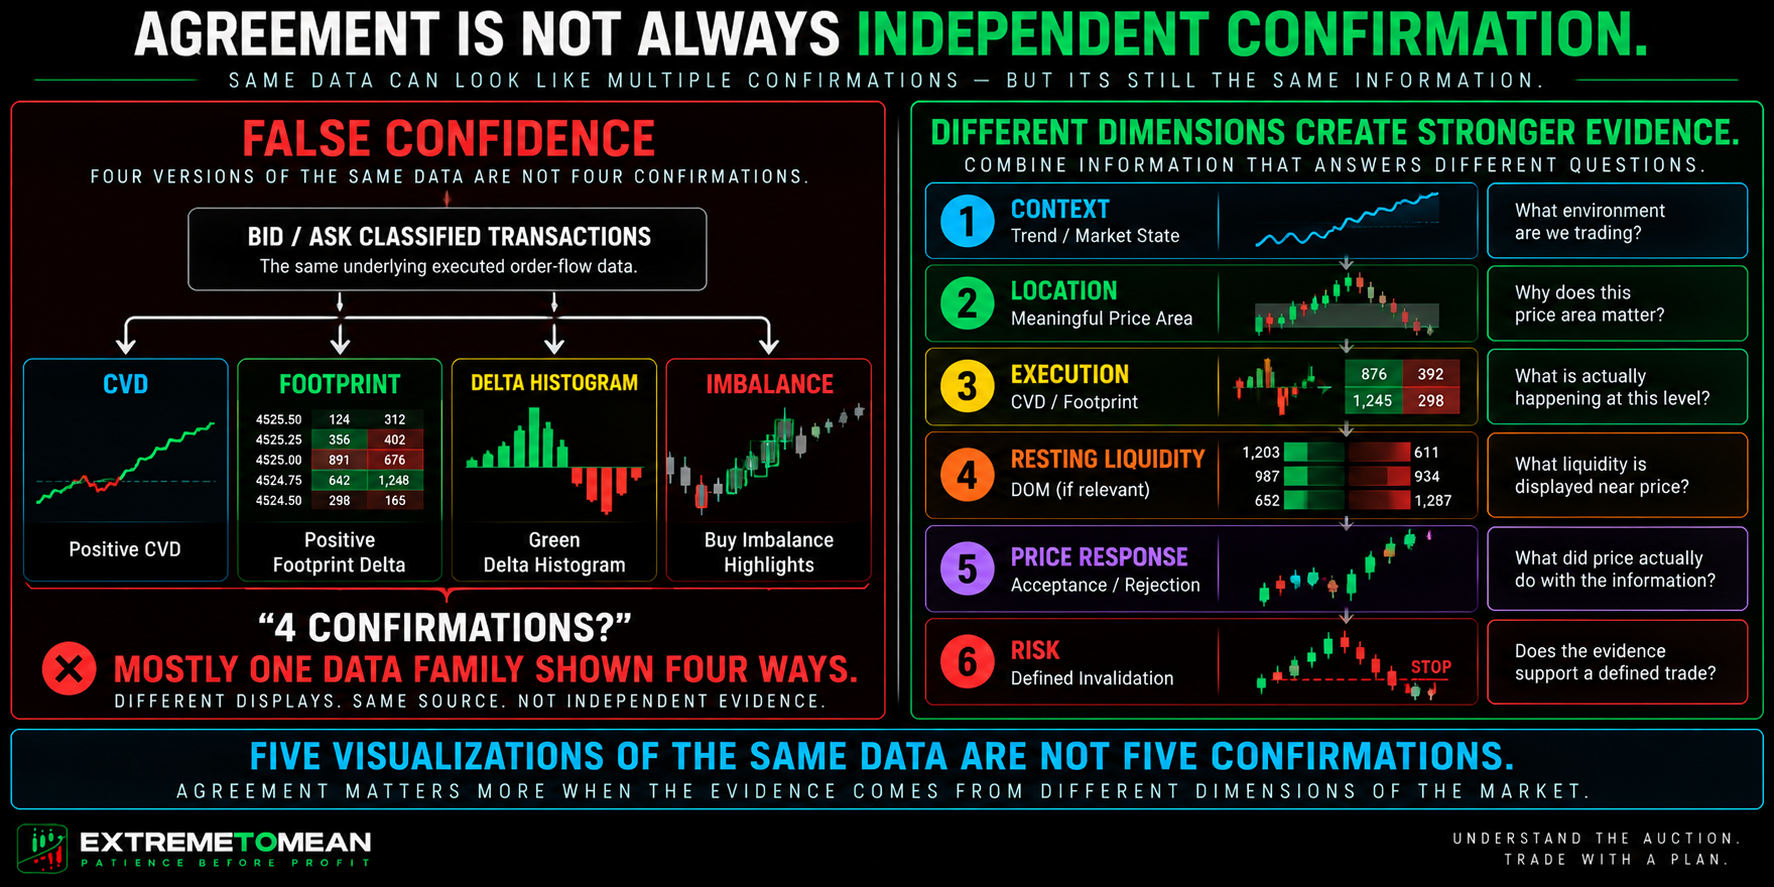
The most dangerous order-flow stack may be the one where everything agrees. A trader loads CVD, bar delta, footprint delta, a delta histogram, and stacked imbalances, watches all five turn green, and concludes that five independent pieces of evidence confirmed the long. Five visualizations of the same data are not five confirmations.
Several of those displays may derive primarily from the same bid/ask-classified transaction activity. Their agreement is therefore partly expected rather than evidence that five unrelated parts of the market independently reached the same conclusion. One source of evidence displayed four ways is still largely one source of evidence.
Agreement becomes more useful when the dimensions are genuinely different. Context may establish a trending environment, location may define an important breakout level, a footprint may show aggressive execution through it, the DOM may show how resting liquidity behaves, and price may demonstrate acceptance beyond the area. Independent evidence is more useful than correlated evidence wearing different colors.
This is where traders often start shopping for confirmation. They already want the long, so they check CVD, then footprint, then DOM, and eventually a tape burst supplies the agreement they were waiting to see. Confirmation is not the first order-flow tool you can find that agrees with the trade you already want.
Price Response Is What Gives Order Flow Meaning
Order flow becomes most useful when it is compared with what price actually accomplished. Heavy aggressive buying that drives price efficiently higher is different from heavy aggressive buying that repeatedly fails to make progress, even though the transaction classification may look bullish in both situations. The amount of aggression matters; what the aggression accomplished matters more.
Suppose aggressive sellers repeatedly hit the bid at meaningful ES support but price refuses to extend materially lower. The observable facts are that selling aggression occurred and downside progress was limited; passive buying may be meeting that pressure, but participant identity remains unknown and the observation does not create an automatic long. You can observe the struggle without knowing the name of either participant.
The same principle protects traders from simplistic delta readings. A bar can finish with positive delta and still close lower, or negative delta can occur during an advancing bar, because aggression and price outcome are related but separate measurements. Do not stop at “Who was aggressive?” Ask, “What did their aggression accomplish?”
Location remains upstream of all of this. Aggressive buying in the middle of random balance may provide technically correct order-flow information while contributing almost nothing to a useful trade, whereas similar activity at a preidentified level after failed downside continuation may deserve greater attention. Order flow can tell you what is happening at a location; it cannot make an unimportant location important.
What Is the Best Order Flow Indicator?
There is no single best order-flow indicator because the tools answer different questions. If the missing question is cumulative aggression, CVD may be enough; if the trader needs price-level execution detail, a footprint is more appropriate; resting liquidity points toward DOM, immediate execution sequence toward tape, and localized asymmetry toward imbalance analysis. The best tool is the one that answers the missing question—not the one that adds the most color to the chart.
The most detailed tool is not automatically the best first tool, either. CVD compresses information and can be easier to interpret, footprints preserve more detail, while DOM and tape demand rapid filtering of information that changes constantly. More granular data can be useful, but it also creates a higher cognitive cost.
Strategy matters without producing one universal recommendation. Faster scalping approaches may justify greater attention to immediate execution, while mean-reversion traders may care about whether aggressive continuation is still producing progress and breakout traders may study participation through a level. In every case, order flow qualifies something that already matters; it should not invent the setup.
A Practical ETM Order-Flow Framework
Use Context → Location → Question → Tool → Observation → Price Response → Decision. The sequence keeps market structure and location ahead of microstructure, gives each tool a defined purpose, and prevents a flashing number from becoming the first reason the trade exists.
- Context: What environment are we trading?
- Location: Why does this price area matter?
- Question: What specifically do I still need to understand?
- Tool: Which order-flow view actually answers that question?
- Observation: What did the tool objectively show?
- Price Response: What did price accomplish with that activity?
- Decision: Did the evidence strengthen, weaken, or leave the setup unchanged?
The better question is not “Which order-flow indicator should I add?” Ask instead, “What do I still need to know about this setup, and is there a tool that answers that question without duplicating information I already have?” That reframes order flow from screen decoration into decision support.
Order-flow information becomes noise when it stops answering a decision-relevant question. Watching every DOM change, every print, every imbalance, and every delta fluctuation may feel sophisticated, but information that does not alter the trade decision is still cognitive load. If adding a tool creates three new questions for every one it answers, it may be adding complexity rather than clarity.
Final Thought
Order-flow tools are valuable because they let futures traders inspect different parts of the auction. CVD summarizes cumulative aggression, footprints preserve execution location, the DOM displays resting liquidity, tape shows the execution stream, and imbalance tools highlight localized asymmetry. Those are different views with different jobs.
Their value disappears when every display receives another vote simply because it is visible. Several correlated delta tools can create the feeling of confirmation without providing several independent forms of evidence, while extremely granular information can overwhelm the larger context that made the trade worth examining in the first place. Price is the result; order flow helps explain the process producing the result.
The goal is not to see everything happening in the market. Start with context, identify meaningful location, define the question, choose the minimum tool needed to answer it, and then judge what price actually did with that information. That selective approach to evidence is part of the broader market-reading discipline developed throughout Decode the Market.
For the broader judgment behind indicator use, see why trading signals should support, not replace, decisions.
Educational content only. Trading involves substantial risk and is not suitable for everyone.