
A conventional candlestick summarizes where price opened, traveled, and closed, while a footprint opens that candle and shows more of the transaction activity that occurred at the individual prices inside it. That extra detail can help a trader study aggression, volume concentration, delta, and imbalance. Inside The Market, however, footprint information should remain evidence layered onto location and structure rather than becoming a signal that manufactures a trade.
What a Footprint Chart Actually Shows
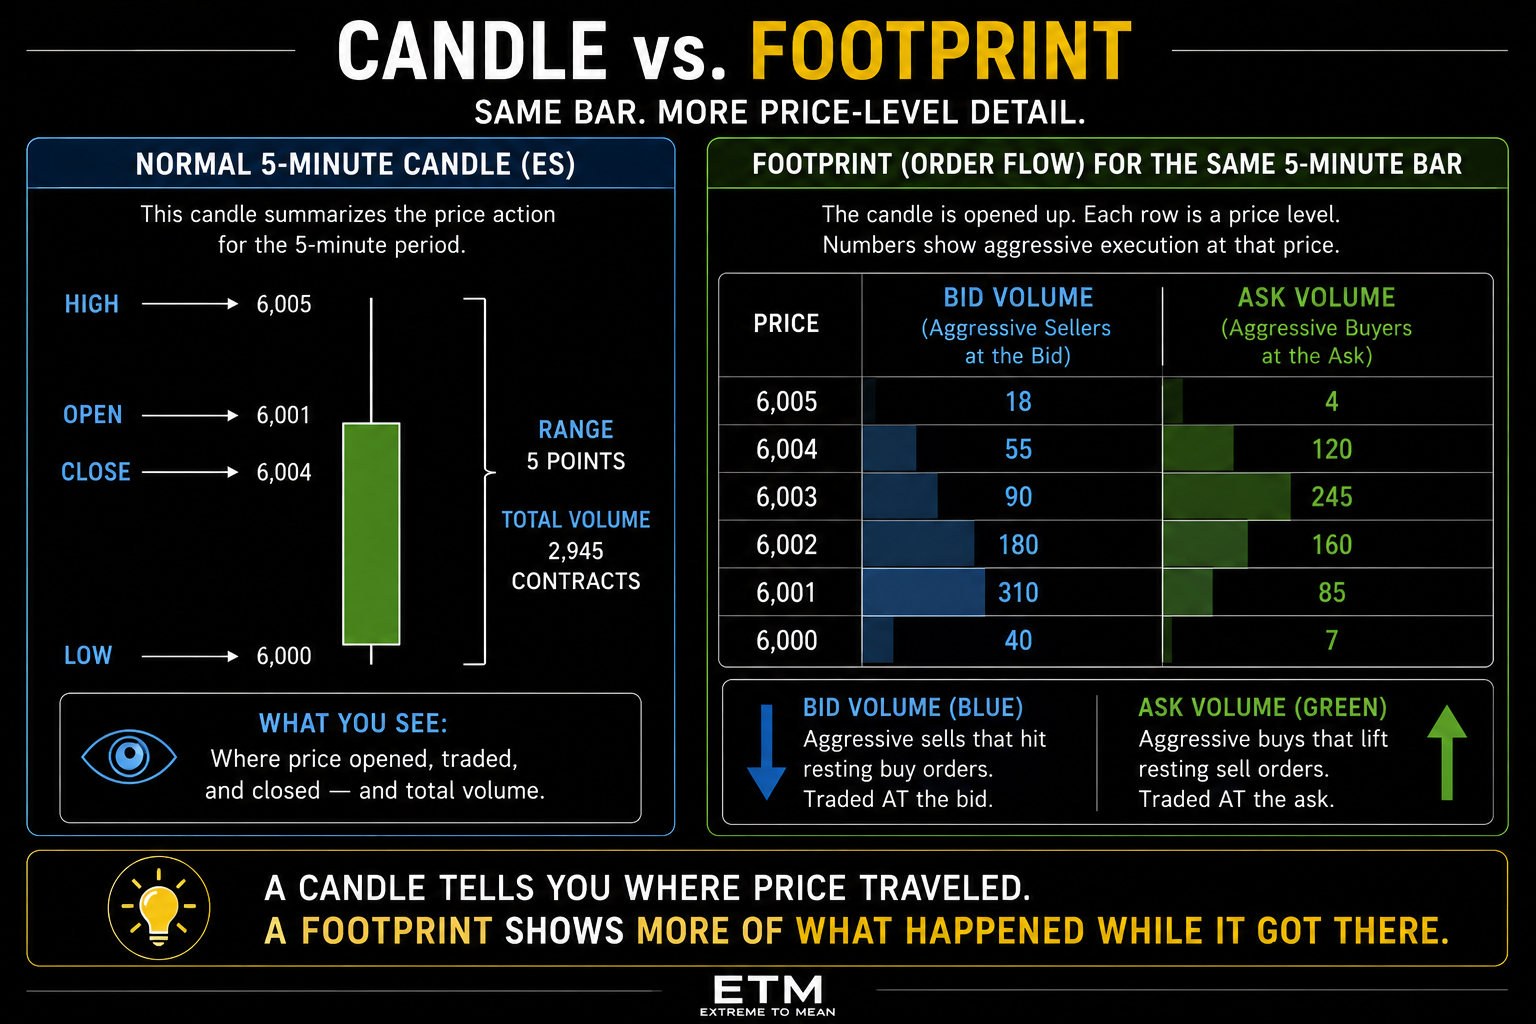
A normal candle gives you the open, high, low, and close, while traditional volume can tell you how much activity occurred during the bar. What those tools do not show is how that activity was distributed across each individual price inside the candle. A footprint chart breaks the bar into price rows so the trader can inspect more of what occurred while price traveled from one end of the candle to the other.
For example, a five-minute ES candle trading from 6,000 to 6,005 might contain very different activity at each price. One row might show relatively little transaction volume while another contains several times as much. The candle shows the final shape; the footprint exposes more of the transaction detail that helped create that shape.
This is a natural extension of the broader Volume Profile lesson. Volume Profile asks where volume accumulated across a selected larger sample, while footprint charts ask how activity was distributed inside individual bars at individual prices. Think of Volume Profile as showing the neighborhood and footprint as letting you inspect what happened inside individual houses.
Bid and Ask Volume Describe Aggressive Execution
Under a true bid/ask footprint convention, bid volume represents transactions executed at the bid. These trades are generally associated with sellers who wanted immediate execution and crossed the spread to transact against resting buy-limit orders. The number does not tell you how many sellers existed in total; it tells you how much executed volume the platform classified on the bid side.
Ask volume works in the opposite direction. Transactions occurring at the ask are generally associated with aggressive buyers who accepted the available offer because they wanted execution now. Again, the number describes the aggressor side of completed transactions rather than every buyer or seller present in the market.
Every completed futures trade still has both a buyer and a seller. If 500 contracts execute at the ask, that does not mean 500 buyers appeared without sellers on the other side; it means buyers were sufficiently aggressive to transact against available offers. Aggressive describes execution behavior, not intelligence, institutional status, or future profitability.
Delta Measures Aggression—Not Direction
Delta is simply the difference between the volume classified on the aggressive-buy side and the aggressive-sell side. In a common bid/ask implementation, that means Ask Volume − Bid Volume. Positive delta indicates more volume was classified on the aggressive-buy side, while negative delta indicates more aggressive-sell volume. The Cumulative Volume Delta guide explains how this same calculation can be accumulated across time.
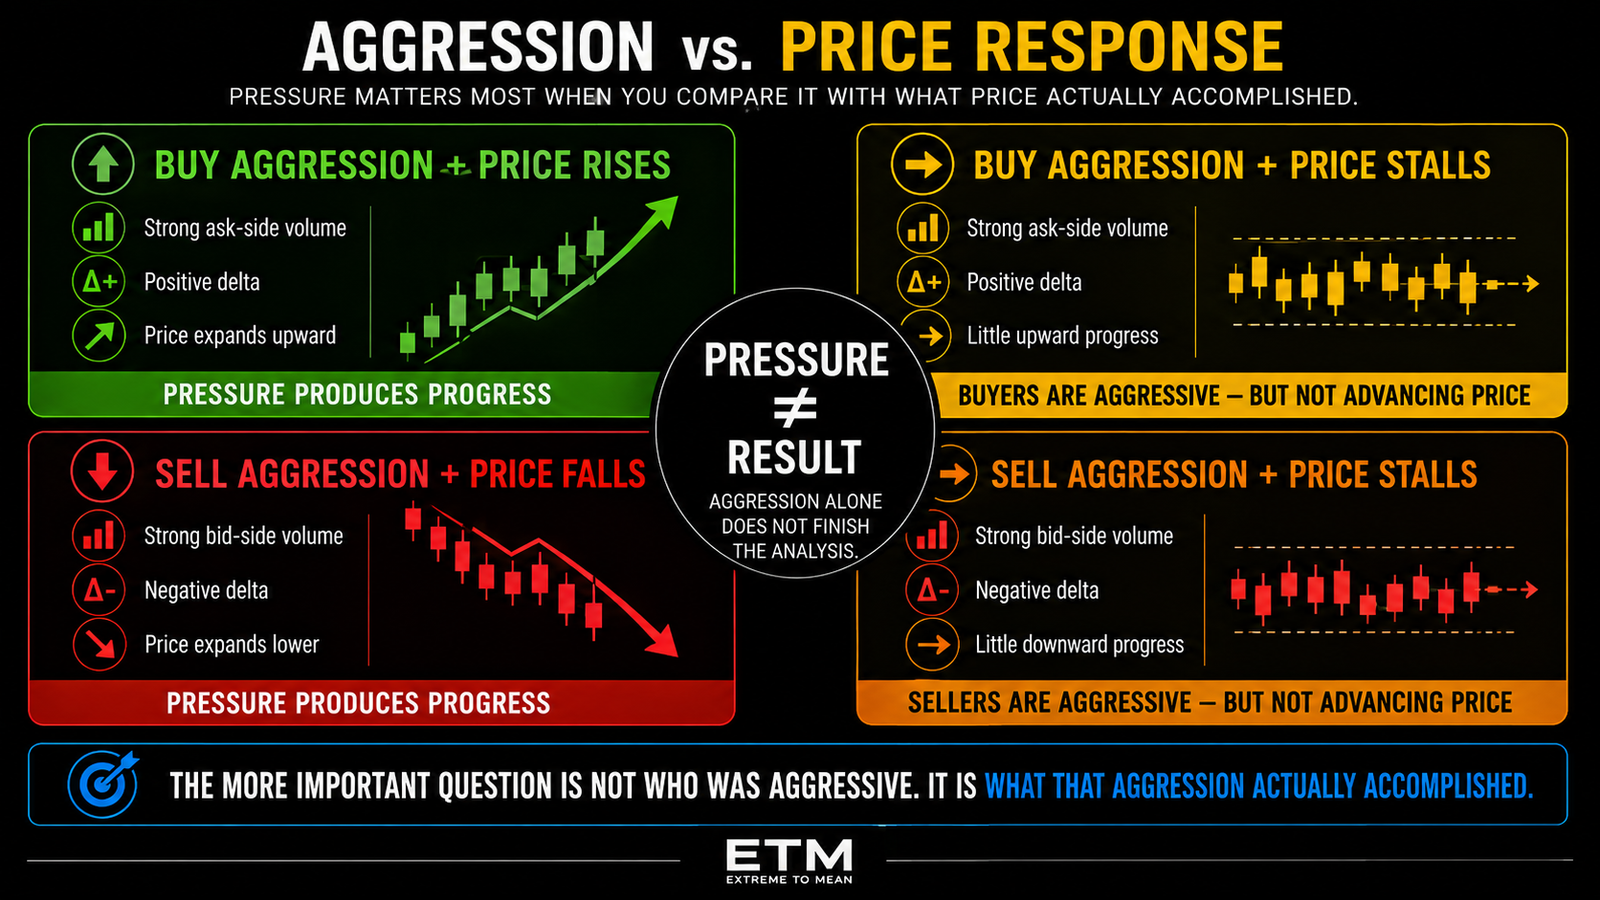
The mistake is assuming that positive delta automatically means price should rise or negative delta means price should fall. Aggressive buying can run directly into substantial resting sell liquidity, while aggressive selling can encounter buyers willing to absorb that pressure. The number describes what side was more aggressive; price response tells you what that aggression actually accomplished.
That distinction should become one of the trader’s most important footprint questions. Strong positive delta accompanied by strong upward expansion is different from strong positive delta while price barely advances. Likewise, heavy negative delta producing clean downside progress is different from aggressive selling that cannot push the market any lower.
Aggression and Price Response Belong Together
There are four simple relationships worth understanding. Aggressive buying can produce upward progress or fail to produce meaningful progress, and aggressive selling can produce downward progress or fail to move price materially lower. Those four combinations tell the trader more than coloring positive delta green and negative delta red.
When aggression produces clean movement, the pressure and price response are aligned. When aggression is heavy but price does not respond proportionally, something different is occurring because the aggressive side is not achieving the expected progress. That mismatch does not automatically create a reversal trade, but it can make the interaction worth investigating.
Delta Divergence Explained applies this same comparison when price and CVD disagree.
A footprint can show you where aggressive buying or selling occurred. The more important question is whether that aggression actually moved the market. This keeps the trader focused on the result of the order flow rather than treating the presence of aggressive transactions as sufficient evidence by itself.
What Footprint Imbalance Means
A footprint imbalance highlights a sufficiently large disparity between the compared buying and selling activity. Many footprint methodologies compare the two sides diagonally, such as ask activity at one price against bid activity one tick lower. That can look strange at first, but the intent is to compare opposing aggressive activity at adjacent prices rather than simply comparing the two numbers displayed on the same row.
For a focused explanation of this calculation, see Bid-Ask Imbalance Explained.
There is no universal imbalance percentage that becomes correct merely because many traders use it. Platforms can allow thresholds such as 150%, 200%, 300%, or other user-defined values, so the threshold belongs to the methodology being used. A 300% imbalance means the configured comparison exceeded that threshold; it does not mean price must continue in the imbalance direction.
Several consecutive imbalances on one side are commonly called a stacked imbalance. That can identify a region where unusually one-sided aggressive execution occurred across multiple adjacent prices. It may deserve attention later, but it should not automatically be projected forward and labeled support or resistance.
Absorption and Exhaustion Describe Different Behavior
Absorption describes a situation where substantial aggressive activity occurs but price has difficulty progressing in the same direction. Imagine aggressive buyers repeatedly lifting offers while price stops advancing despite the heavy ask-side activity. Conceptually, that may indicate enough resting sell liquidity is meeting the aggressive buying to limit further progress.
That observation is useful, but “absorption” should not become shorthand for “reverse now.” The market can reverse, pause, continue absorbing, pull back modestly, or eventually break through the area. Absorption tells you aggression is not producing proportional progress; it does not tell you exactly what happens next.
Exhaustion describes something different because the aggressive activity itself begins to diminish near an extreme. A simple way to remember the distinction is: absorption means they keep hitting it but it is not moving; exhaustion means they are not hitting it much anymore. Neither observation guarantees reversal, and both remain dependent on location and surrounding structure.
Know How Your Platform Builds the Footprint
One of the most important footprint lessons has nothing to do with reading the colors. Different platforms can classify transaction activity differently, which means two footprint charts that look visually similar may not be constructed from identical underlying methodology. Before interpreting bid, ask, buy, sell, delta, or imbalance, the trader needs to understand what the platform is actually calculating.
Some implementations use actual bid/ask transaction classification, while other platforms can classify historical buy and sell volume using lower-timeframe price movement or other methodology. Data feed quality, available historical tick detail, aggregation, row size, and platform settings can also influence what the footprint displays. The chart is therefore a visualization of underlying data and methodology, not an objective picture independent of those choices.
Historical footprints also may not always reproduce exactly what appeared in real time on every platform. Some systems can use more granular information live than they later retain for historical reconstruction. If footprint evidence matters to your strategy, verify how your specific platform handles live and historical data before trusting a backtest built from visual inspection.
Footprint POC Is Not the Same as Session POC
A footprint bar can contain its own Point of Control: the price or row inside that specific bar where the greatest volume occurred. That is the same general idea of volume concentration explored in Point of Control Trading, but the sample is dramatically smaller. One POC belongs to an individual footprint bar while another may belong to an entire session, week, or composite profile.
This matters because identical terminology can make the references appear interchangeable. A five-minute footprint POC does not suddenly become session fair value, just as a session POC does not explain every transaction inside one five-minute candle. Always ask what sample created the reference before deciding how much weight it deserves.
The same principle applies to footprint precision more broadly. One-tick rows can provide extraordinary granularity, but grouping prices into larger rows changes the displayed volume and can change which comparisons appear significant. More granular is not automatically more useful if the added detail creates noise rather than improving the decision. The same restraint matters when choosing which order-flow indicators belong on the screen.
Location Should Come Before Order Flow
A beautiful stacked imbalance in the middle of a meaningless range does not automatically become an important trade. The same footprint behavior occurring at a failed breakout, prior POC, Initial Balance boundary, meaningful swing, or higher-timeframe level may deserve more attention because the location was already important before the footprint appeared. Structure tells you where to care; footprint can help you study what happens there.
This is why a setup is not a signal remains relevant even when the footprint looks impressive. A trader still needs location, room, market structure, and clearly defined risk. Extra transaction detail cannot repair a trade that was structurally poor before the footprint lit up.
Do not use footprint to manufacture locations. Use footprint to study what happens at locations that already matter. That hierarchy helps prevent the trader from scanning every candle for green or red imbalance and then inventing a reason to trade after the fact. Location first, footprint second.
A Simple ES Example
Suppose ES has been declining toward a meaningful prior reference around 6,020. As price tests the area, the footprint shows heavy bid-side selling, strongly negative delta, and repeated aggressive sellers, yet price repeatedly fails to move materially below 6,020. The weak conclusion is, “negative delta means short.”
The stronger observation is that sellers are acting aggressively but are not achieving proportional downside progress at a location that already mattered. That may indicate pressure is being absorbed or that continuation quality is deteriorating, but it still does not create an immediate long. The trader can wait for price to stabilize, reclaim structure, and produce a logical invalidation before deciding whether a trade is actually forming.
The opposite example can occur during a breakout. Aggressive ask-side activity, several buy imbalances, shallow pullbacks, and continued upward progress can strengthen the evidence that buyers are accomplishing something. Even then, the trader still has to ask whether the entry is too late, whether room remains, and where the trade would be wrong.
A Practical Footprint Reading Process
Use Location → Transaction Detail → Pressure → Response → Context → Trade Qualification. Footprint evidence should arrive after the trader already knows why the area deserves attention. The process prevents colored cells from becoming a substitute for market structure.
- Define the location: Why are you paying attention here?
- Read price: What is the surrounding candle and structure doing?
- Inspect bid/ask activity: Where is aggressive execution occurring?
- Check delta: Which side is showing greater aggression?
- Look for imbalance: Is the disparity meaningful under your configured methodology?
- Compare aggression with progress: Is the aggressive side actually moving price?
- Look for failure: Is the pressure being absorbed, exhausted, or ignored?
- Return to context: Does the interpretation fit the larger market?
- Define risk: Where would the proposed trade be wrong?
- Decide: Does the footprint materially improve the trade decision?
| Footprint Observation | What It Actually Tells You | What It Does Not Prove |
|---|---|---|
| High ask-side volume | Strong aggressive-buy execution under the platform methodology | Buyers will win |
| High bid-side volume | Strong aggressive-sell execution | Sellers will win |
| Positive delta | Buy-side classified volume exceeded sell side | Price must rise |
| Negative delta | Sell-side classified volume exceeded buy side | Price must fall |
| Buy imbalance | Buy-side comparison exceeded configured threshold | Automatic long |
| Sell imbalance | Sell-side comparison exceeded configured threshold | Automatic short |
| Stacked imbalance | Multiple adjacent levels qualified on one side | Future support/resistance |
| Heavy aggression, little progress | Pressure is not producing proportional movement | Guaranteed reversal |
| Footprint POC | Highest-volume price or row in that footprint bar | Session fair value |
Before acting on anything inside a footprint, ask: “What did this order-flow event actually accomplish in price?” Then ask: “Would I care about this imbalance if it occurred twenty points away in the middle of nowhere?” Finally, make sure you can answer: “Does my platform actually calculate this footprint the way I think it does?”
Final Thought
Footprint charts can reveal transaction detail that a conventional candlestick cannot show. Bid and ask activity, delta, imbalance, absorption, and price-level volume can all help explain what happened inside a bar. None of that detail eliminates the need to understand where the bar formed and what the larger market is doing.
The goal is not to react whenever aggressive buyers or sellers appear. It is to compare pressure with response, interpret that relationship at meaningful location, and decide whether the additional information improves a trade that already has structure, room, and defined risk. Footprint is a confirmation layer, not a reason to manufacture a setup.
When a footprint shows aggressive buying, selling, or imbalance, ask whether you are reacting to the colored numbers or asking the more important question: what did all of that aggression actually accomplish at this specific location in the market? Readers who want to build the broader context-first process behind that question can continue with Decode the Market.
Educational content only. Trading involves substantial risk and is not suitable for everyone.