
A Depth of Market display gives traders a live view of bids and offers sitting at different futures prices. Those numbers can help explain the auction in more detail, but they are conditional rather than permanent. Inside The Market, the cleaner goal is to understand what the book actually shows before attaching a directional story to it.
That distinction matters because the DOM looks unusually authoritative. A candlestick may show only price movement, while the ladder can display hundreds or thousands of contracts changing second by second. More granular data does not automatically create a better decision.
Start With the Futures Order Book
Futures trade through a centralized limit order book where participants can submit orders to buy and sell at specified prices. Resting buy orders form bids below or at the market, while resting sell orders form offers or asks above or at the market. The book updates continuously as orders are entered, modified, canceled, and executed.
The highest currently available buying price is the best bid, while the lowest currently available selling price is the best ask or best offer. The distance between those two prices is the bid-ask spread, and together they describe the top of the book. Market depth extends that view beyond only the best prices and shows additional displayed liquidity farther away.
That order-book structure is part of the same auction process explained in how the stock market actually moves. Buyers and sellers continuously compete across price, but a resting order is not yet a completed trade. The order book is a live inventory of resting interest—not a list of future transactions.
DOM, Level 2, Market Depth, and the Order Book
These terms are related enough that traders often use them interchangeably, but they do not describe exactly the same thing.
| Term | What It Describes |
|---|---|
| Order Book | The underlying collection of active orders arranged by price and priority |
| Market Depth | Bid and offer information across multiple price levels |
| DOM — Depth of Market | A visual price-ladder interface displaying depth and often allowing direct order entry |
| Level 2 / Level II | A common platform term for depth beyond the best bid and ask |
The order book is the market structure underneath the display. Market depth is the information coming from that book, while DOM and Level 2 are common ways traders view the information. They are related views and concepts, not four separate markets.
Passive vs. Aggressive Orders adds the execution-side distinction that gives displayed liquidity its context.
A hypothetical ES ladder might show 140 contracts offered at 6500.25, 225 at 6500.50, and progressively more offers above, while 175 contracts are bid at 6500.00 and additional bids sit below. The trader can objectively say those quantities are currently displayed at those prices. They cannot objectively say 6500.25 must reject or 6499.25 must hold.
Resting Liquidity Is Different From Executed Trading
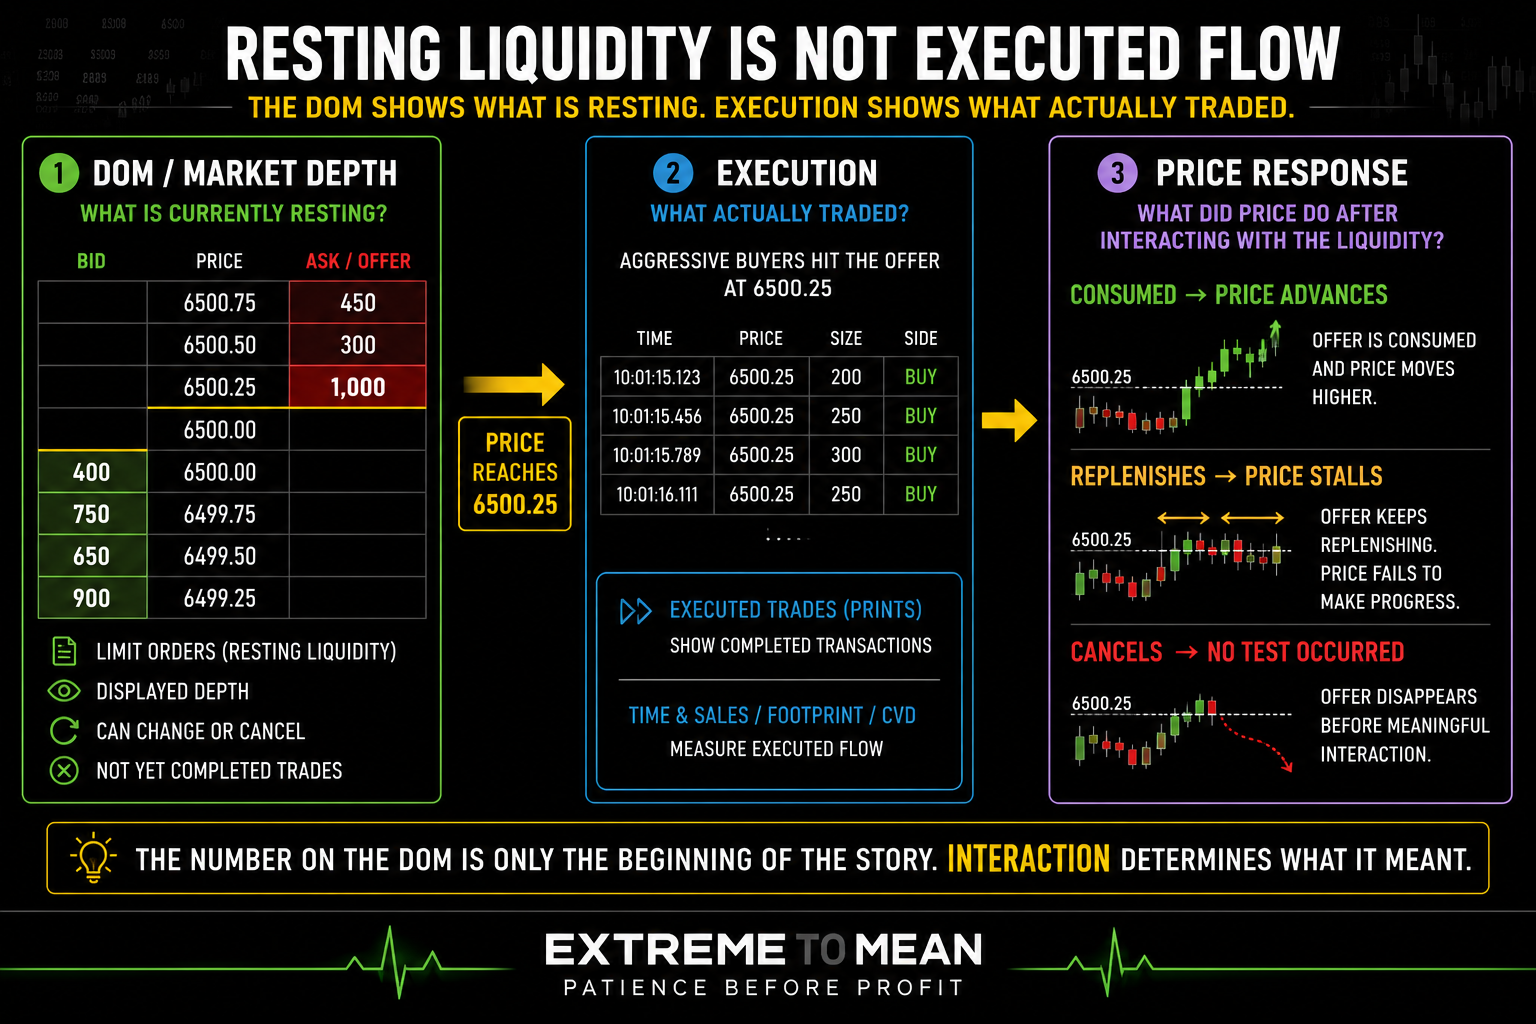
This is the distinction that makes the rest of the DOM easier to understand. The DOM primarily shows resting orders waiting to trade, while Time & Sales shows completed transactions. Footprint charts and CVD also work primarily with executed activity rather than merely displayed depth.
That makes the DOM different from Cumulative Volume Delta. CVD accumulates activity classified from completed transactions, while market depth displays liquidity currently offered to the market before execution. DOM is primarily about what is resting; CVD is primarily derived from what has traded.
Suppose 1,000 contracts are offered at one price. Aggressive buyers may consume the entire offer and push price higher, the offer may repeatedly replenish while price fails to advance, or the displayed size may disappear before meaningful trading reaches it. The exact same opening observation—“there are 1,000 contracts on the offer”—can lead to very different outcomes.
The number on the DOM is only the beginning of the story. Interaction determines what it meant.
What Bid Size and Ask Size Actually Tell You
A large bid means substantial displayed resting buy quantity currently exists at that price or group of prices. It does not mean there are “more buyers than sellers” in the entire market, nor does it guarantee the bid will remain when price reaches it. Every completed transaction still requires both a buyer and a seller.
The same caution applies to a large offer. A 2,000-contract offer may remain and absorb aggressive buying, be completely consumed, move to another price, partially execute, replenish, or disappear through cancellation. A wall is visible liquidity—not a concrete barrier across the chart.
This is where a common DOM mistake begins. A trader sees 1,500 offered versus only 300 bid and immediately shorts because the sell side looks larger, even though the market is in the middle of a range with no meaningful location or structural reason for the trade. If the offer later cancels and price rallies, the DOM did not break a promise; the trader promoted temporary displayed liquidity into a directional prediction.
That behavioral problem is why context comes before the candle, and it should also come before the book. A large order at an important prior high may deserve more attention than the same number appearing in random midrange chop. Location gives the book meaning; the book should not be asked to invent location from scratch.
Market by Price, Market by Order, and Queue Position
Not every market-depth feed shows the book at the same level of detail. Market by Price, or MBP, aggregates displayed information at each price level, while Market by Order, or MBO, can provide individual anonymous order-level information and more detailed queue data. A trader should therefore know what their platform and subscription actually provide before assuming their DOM represents every detail available from the exchange.
| Feature | Market by Price | Market by Order |
|---|---|---|
| Organized around | Price levels | Individual anonymous orders |
| Quantity | Aggregated at price | Individual order sizes |
| Queue detail | Limited | More granular |
| Book depth | Summary depth | Deeper/full order detail depending on feed |
| Customer identity | No | No |
| Predicts direction | No | No |
More detailed data does not reveal who the participant actually is. Even order-level exchange data can preserve customer anonymity, so a trader cannot legitimately look at a large bid and declare, “That is JPMorgan” or “Institutions are defending this level.” A large number does not come with a name tag or a motive.
Queue position also explains why touching your limit price does not guarantee a fill. If 1,000 contracts are already ahead of your bid and only 600 trade at that price before the market moves away, your order may remain unfilled despite price reaching the level. Being at the correct price does not necessarily mean being first in line.
Orders Can Change, Cancel, Replenish, and Hide
A live order book is supposed to change. Orders may be modified, repriced, canceled, replaced, partially filled, or joined by new liquidity as market conditions evolve. An order disappearing does not prove it was fake.
That distinction becomes especially important around accusations of spoofing. Cancellation itself is observable, but spoofing is a conclusion about prohibited intent to place orders with the intention of canceling them before execution. Cancellation is observable. Spoofing is a conclusion about intent.
Visible depth is also not necessarily total available liquidity. Futures exchanges can support orders that display only part of their full quantity, commonly discussed as hidden quantity or iceberg-style behavior, so additional size may appear as the visible portion executes. The DOM is a window into liquidity—not an X-ray of all liquidity.
Repeated replenishment can therefore be worth observing without immediately declaring “institutional absorption.” If aggressive buying repeatedly trades into an offer and more size keeps appearing while price makes little progress, the interaction becomes more interesting. The defensible observation is about replenishing liquidity and poor price progress; participant identity and motive remain unknown.
The Same Large Order Can Produce Three Different Outcomes
Imagine ES approaching 6500.00 with 1,200 contracts displayed on the bid. The initial observation is identical in every case: substantial resting buy liquidity is visible at the level. What happens next determines whether that number becomes useful information.
Outcome A: the bid remains and repeatedly trades. Aggressive sellers hit the level, substantial volume executes, but price repeatedly fails to make meaningful downside progress and displayed size replenishes. That may suggest strong passive buying interaction, but it still does not create an automatic long trade.
Outcome B: the bid is consumed. Aggressive selling trades through the resting quantity and price continues lower, showing that the visible liquidity was not sufficient to stop the movement. A large bid existed, but the market proved capable of overwhelming it.
Outcome C: the bid disappears before meaningful interaction. The displayed quantity is canceled or repriced as price approaches, so the trader never observes substantial execution against it. The fact that the size vanished does not establish why it vanished.
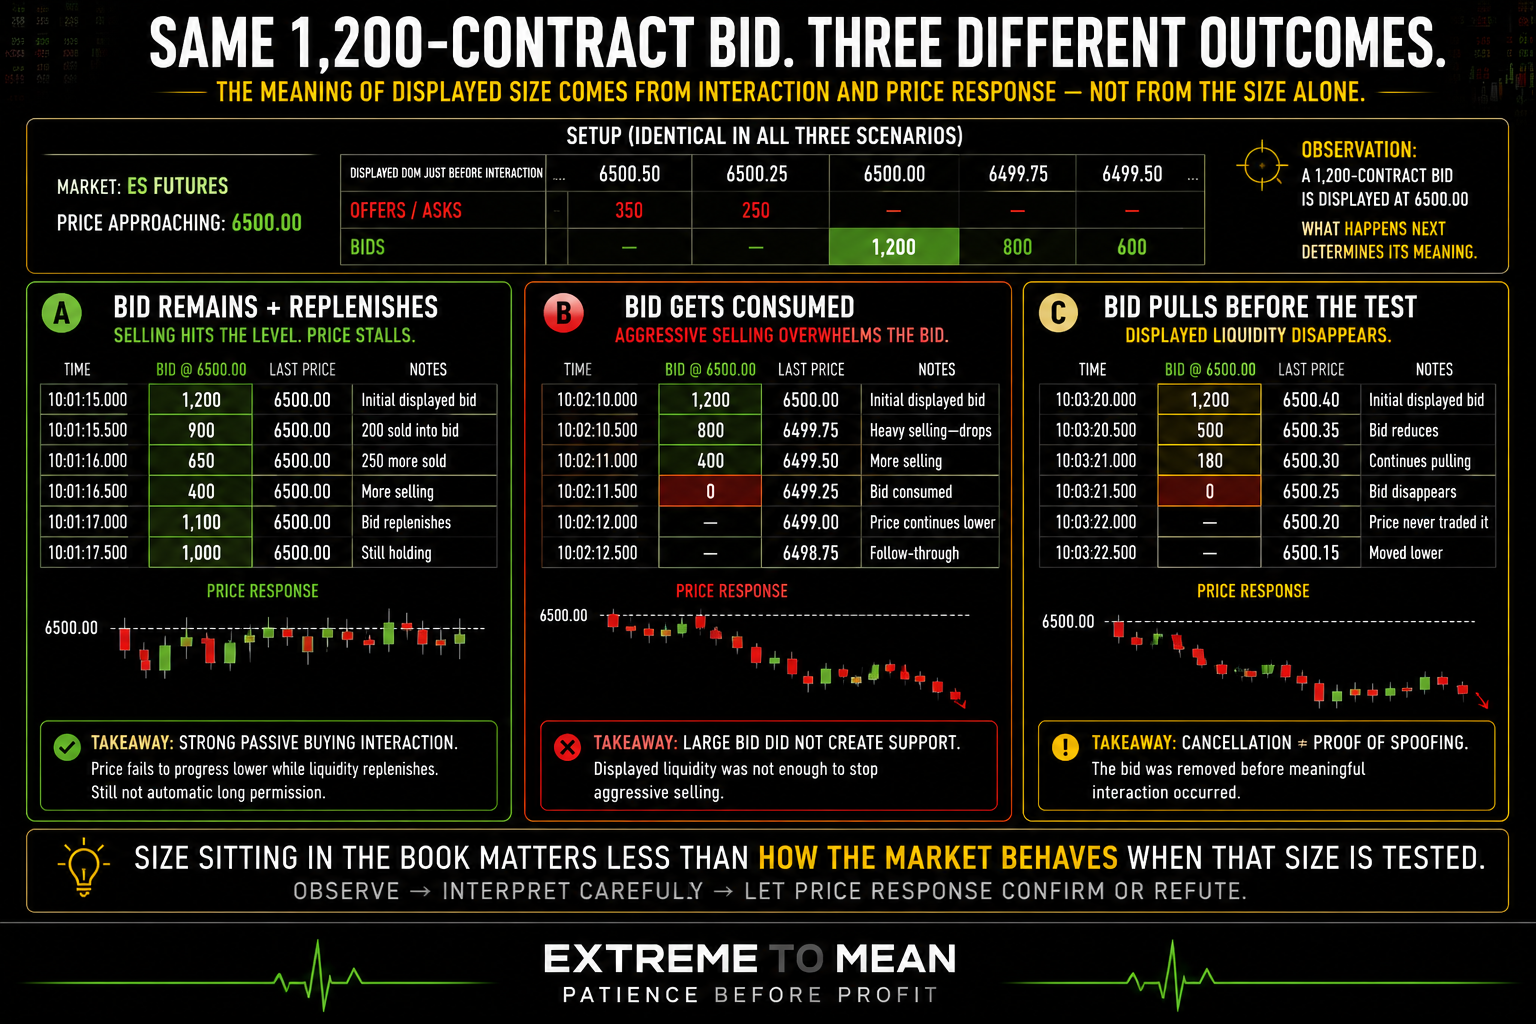
The lesson is more useful than memorizing a “bid wall” strategy. Size sitting in the book matters less than how the market behaves when that size is tested. The trader should watch the change in the book, what actually executes, and what price accomplishes afterward.
Market Depth Is Only One Dimension of Liquidity
A deeper-looking book is not automatically a better market, and a thinner-looking book is not automatically untradeable. Liquidity also involves spread, transaction volume, price impact, execution quality, and how quickly new orders replace liquidity that has been consumed. Depth is one dimension of liquidity—not liquidity itself.
This matters when volatility increases. Visible depth can decrease while trading volume and matching activity remain very high, and a book can replenish quickly after individual transactions. A static snapshot therefore cannot fully describe how resilient the market may be once interaction begins.
Order size matters as well. A trader executing one MES contract faces a very different liquidity problem from a trader trying to execute hundreds of ES contracts because the larger order may need to consume multiple price levels. Liquidity is relative to the size you are trying to execute.
This connects naturally to the broader Order Flow Trading framework. DOM, executed transactions, price response, and other order-flow tools can complement one another, but none should be promoted into a standalone prediction machine. The trader still needs to evaluate whether the information contributes to an actual setup.
The DOM Can Turn Noise Into False Opportunity
The DOM is psychologically difficult because it never stops moving. Bids stack, offers pull, quantities flicker, and the apparent imbalance can reverse quickly even while the larger market structure has barely changed. The faster the numbers move, the easier it is to confuse activity with information.
That problem becomes especially severe in the middle of random chop. The trader can watch every change and always find something that appears bullish or bearish, then change bias repeatedly as the book shifts. A constantly changing screen can convince a trader that they constantly need to make a decision.
During fast markets, the useful life of an individual depth snapshot becomes even shorter. Around major economic releases, the open, or unexpected headlines, displayed liquidity can reprice, thin, replenish, and disappear rapidly. Market depth is therefore better understood as a stream than as a permanent chart level.
A Practical ETM DOM Framework
Use Location → Book → Change → Execution → Response → Decision. The framework keeps the microstructure downstream of a reason to care about the price area instead of allowing the largest number on the ladder to manufacture a setup.
- Location: Why does this price area matter before looking at the DOM?
- Book: What resting liquidity is currently displayed?
- Change: Is that liquidity stacking, pulling, moving, or replenishing?
- Execution: What actually trades when price interacts with the level?
- Response: Does price advance, stall, reject, break, or accept?
- Decision: Does the evidence strengthen or weaken an already qualified idea, or is it simply more noise?
The better question is not “Where is the biggest bid or offer?” Ask, “What is actually displayed here, how is it changing, what trades when price reaches it, and what does price accomplish afterward?” That turns the DOM from a prediction screen into an evidence screen.
The progression also separates observation from interpretation. “1,500 contracts are displayed at the ask” is directly observable; “there is unusually large resting sell liquidity here” adds context; “therefore price cannot break and I should short” is a much larger prediction. The farther you move from displayed quantity toward predicted direction, the more evidence you need.
Final Thought
DOM, Level 2, and market-depth data can reveal details that a normal candlestick chart cannot show. Traders can see resting bids and offers, changing displayed quantity, queue information, replenishment, and how available liquidity evolves as the market approaches different prices. None of that gives the trader access to everyone else's future decisions.
The value comes from watching the auction develop rather than assuming the first number on the ladder already contains the answer. Orders can remain, execute, replenish, move, or cancel, while other liquidity may not be fully visible at all. The book shows what is available now—not what is guaranteed to be available when price gets there.
Use the deeper information to improve the quality of a market read, not to manufacture certainty from a fast-moving column of numbers. Start with location, read the book, watch what changes, observe what actually trades, and then judge the price response. That evidence-first approach is part of the broader market-reading process developed throughout Decode the Market.
Educational content only. Trading involves substantial risk and is not suitable for everyone.