
Short-term reversal: real edge or microstructure noise? shows why an apparent reversal still needs to survive realistic execution and measurement.
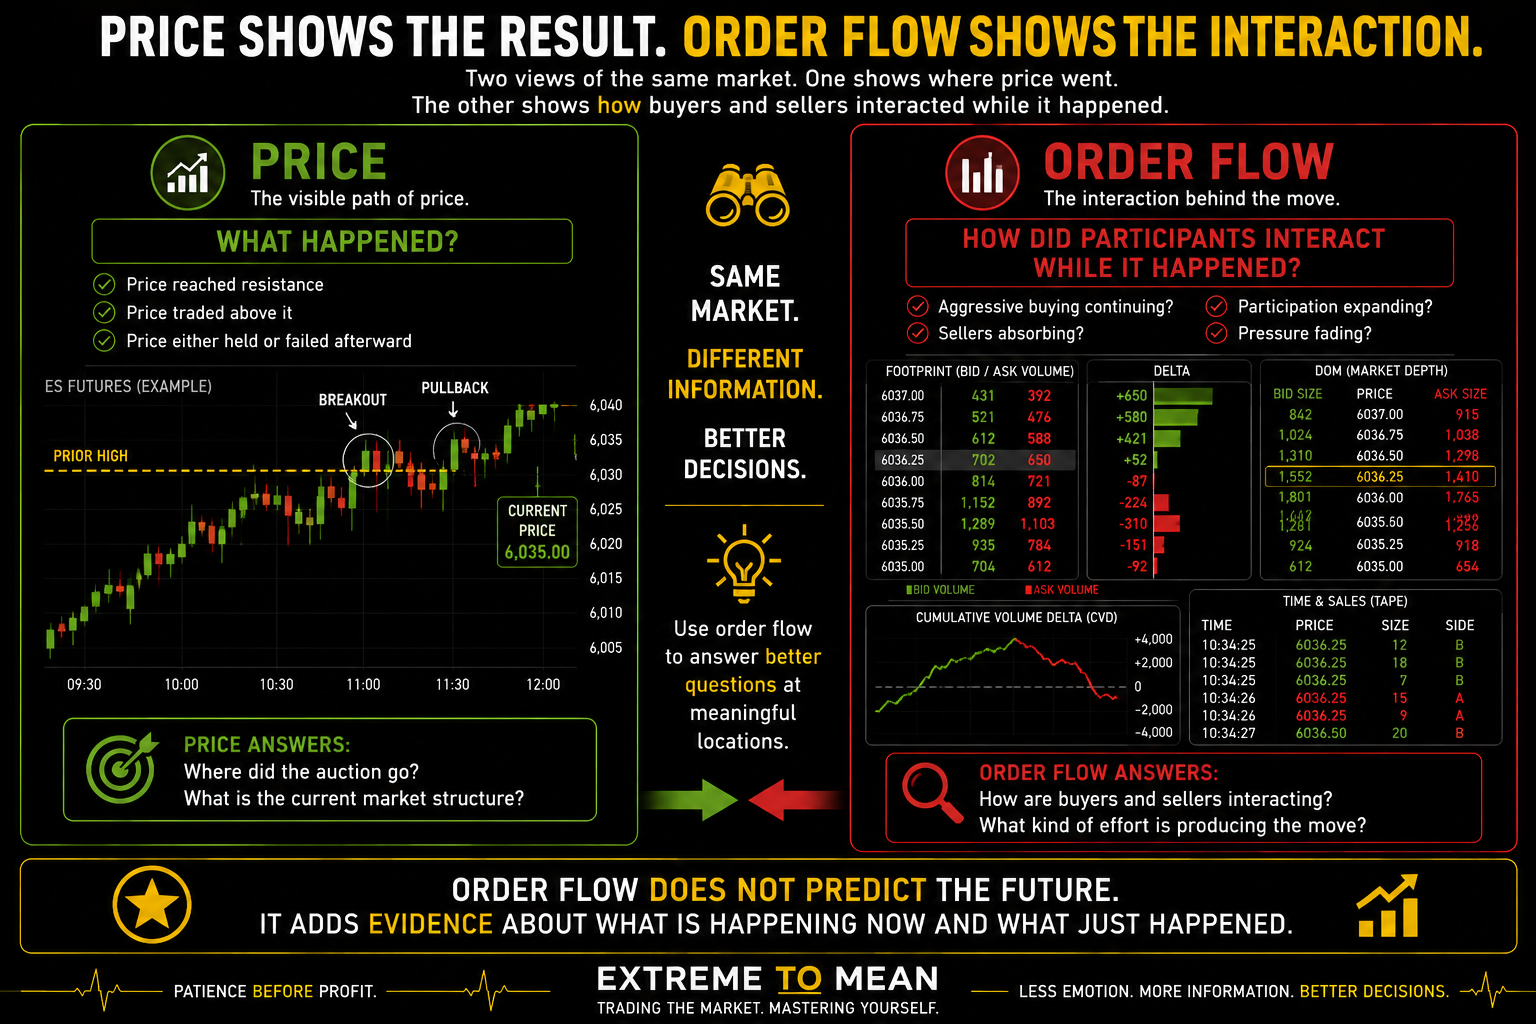
Price shows what happened, while order-flow tools can help show how buyers and sellers interacted while it happened. That can improve a market read, but it does not replace structure, location, context, or risk management. Inside The Market, the goal is to use transaction and liquidity information as evidence rather than as a machine that produces buy and sell signals.
What Order Flow Trading Actually Means
Order flow trading studies how transactions occur and how available liquidity changes as buyers and sellers interact. A normal price chart shows where price traveled, while order-flow tools can add information about executed volume, aggressor activity, resting orders, and market depth. The extra detail helps explain more of the interaction behind the move.
Suppose ES tests a prior high and trades above it. Price tells you the level broke, while order flow can help ask whether aggressive buying is continuing, whether sellers are absorbing it, or whether participation is fading. Price tells you where the auction went; order flow helps you study how participants interacted along the way.
That does not mean order flow reveals what comes next. It cannot show every participant’s motive, future order, or hidden plan. It gives the trader another layer of evidence about what is happening now and what just happened.
Every Trade Has a Buyer and a Seller
One common beginner mistake is saying that “more buyers than sellers” caused price to rise. Every completed futures trade required both a buyer and a seller, so the useful distinction is which side demanded liquidity. Under common bid-and-ask classification, lifting the offer is aggressive buying while hitting the bid is aggressive selling.
Passive participants place liquidity into the order book and wait for someone else to transact with it. A resting bid offers liquidity to a seller, while a resting offer supplies liquidity to a buyer. Passive traders offer liquidity; aggressive traders demand it.
Aggressive does not mean smarter, institutional, or destined to win. It describes execution behavior rather than identity or intelligence. Say that more volume executed aggressively on one side rather than pretending the chart reveals who every participant was.
Executed Orders and Resting Liquidity Are Different
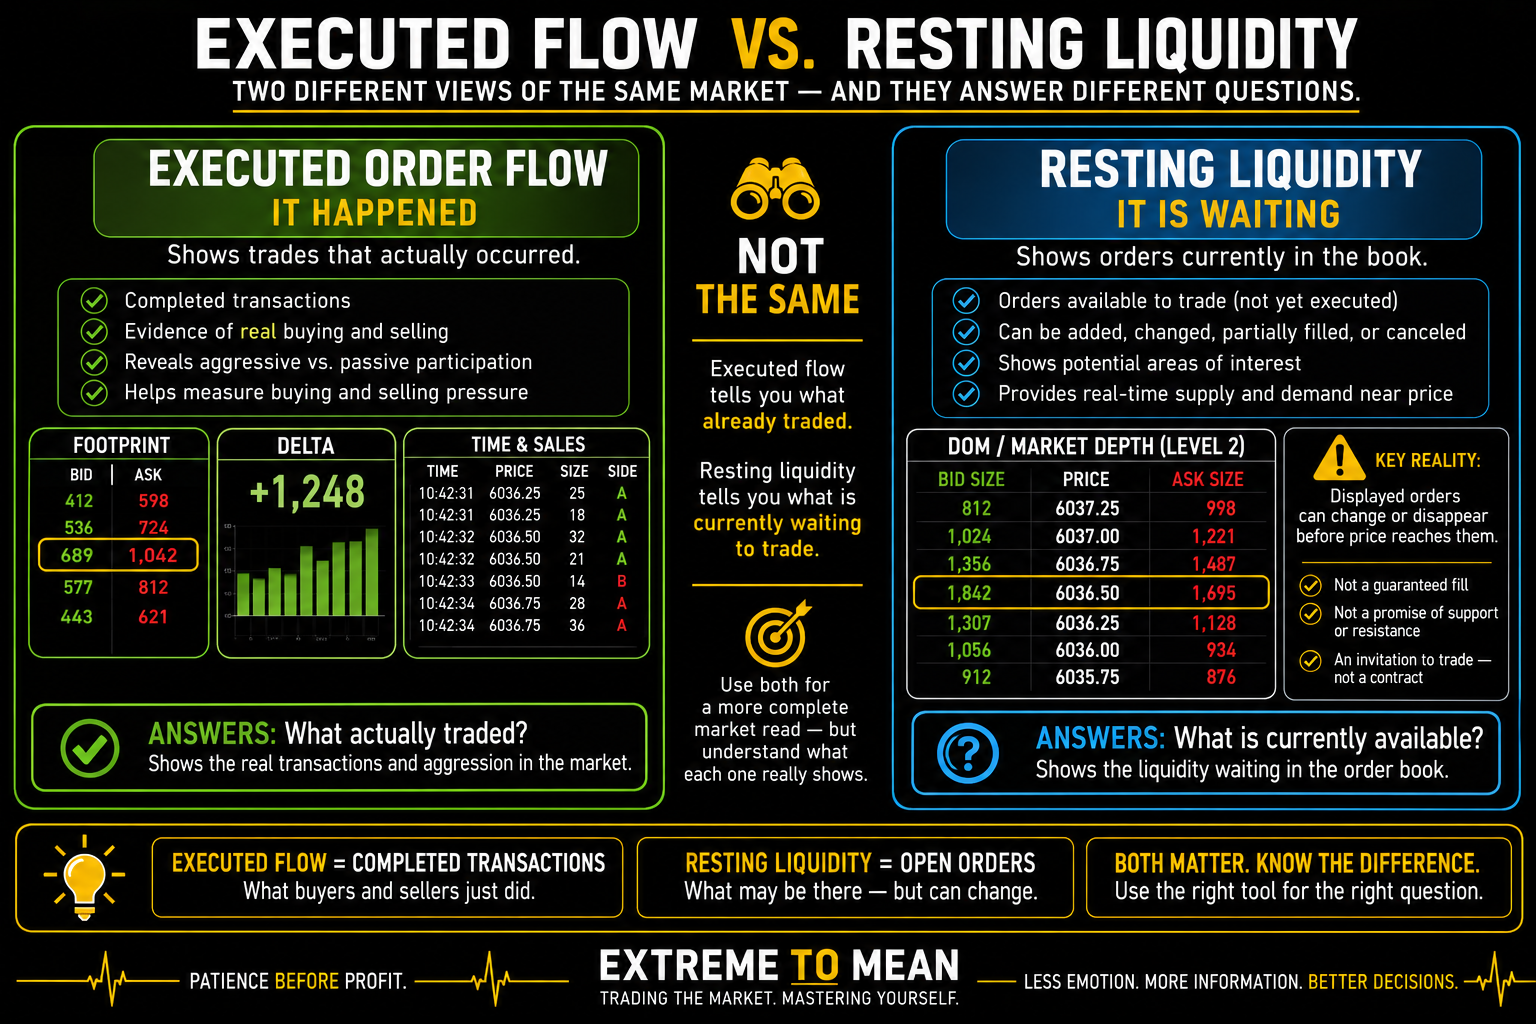
Executed order-flow data describes transactions that actually occurred. Bid volume, ask volume, delta, Time & Sales, and footprint information belong in this family. These tools help answer questions about what participants actually did.
The DOM, Level 2, market depth, and the order book show liquidity currently waiting to trade. A large bid or offer may deserve attention, but those orders can be added, changed, executed, or canceled before price reaches them. Displayed liquidity is an invitation to trade, not a promise that the order will still be there when price arrives.
A large resting bid should therefore not automatically be labeled support. It may remain, partially trade, or disappear as conditions change. Displayed liquidity can matter, but it should not be confused with a transaction that already occurred.
The Order-Flow Tool Family
Order flow is not one indicator. A Footprint Chart shows transaction activity at individual prices inside a bar, while delta summarizes classified aggressive buying versus selling over a period. Cumulative Volume Delta extends that idea over time, the DOM shows resting liquidity, and time and sales shows transactions printing in real time.
The dedicated Cumulative Volume Delta lesson explains how that running total is built and why reset periods and platform methodology matter.
Imbalance, absorption, and exhaustion describe different relationships between activity and price response. Each tool answers a different question, and stacking several without knowing what each measures can create more noise than insight. This article is the map of the family; dedicated lessons can go deeper into each tool.
Absorption vs. Exhaustion explains how each can stall price for different reasons.
Bid-Ask Imbalance Explained covers the different question raised by unequal aggressive execution.
Delta Measures Aggression, Not Destiny
At its simplest, delta compares classified aggressive buying volume with classified aggressive selling volume. Positive delta means the methodology found more aggressive buying, while negative delta means it found more aggressive selling. It does not mean price is required to move in the same direction.
Passive vs. Aggressive Orders explains the two sides of that execution relationship.
Strong positive delta with clean upward expansion is different from strong positive delta while price barely advances. In the second case, buyers may be aggressive without achieving much progress because enough selling interest is meeting that demand. The useful information comes from comparing aggression with what price actually accomplished.
Platform methodology matters because similar-looking tools can classify or estimate activity differently. Before treating delta or CVD as objective truth, understand how the platform calculates it. More precision on the screen does not repair a misunderstood methodology.
Absorption, Exhaustion, and Divergence Need Restraint
Absorption describes aggressive activity continuing without proportional price progress. Heavy buying that repeatedly hits offers while price barely advances can suggest sellers are supplying enough liquidity to absorb that demand. The same idea can occur in reverse when aggressive selling fails to move price materially lower.
Exhaustion is different because aggressive participation itself begins fading near an extreme. Absorption says pressure continues but is not accomplishing much; exhaustion says the pressure is diminishing. Neither observation is an automatic reversal signal.
Price and delta can also disagree. If price makes a new high while cumulative delta does not, the divergence may deserve attention, but it does not prove that price must reverse. Order flow can strengthen or weaken a read; it should not replace the read.
Order Flow Works Best at Meaningful Location
Imagine ES breaking above established resistance. If aggressive buying continues, price holds above the level, and transactions keep developing higher, order flow may support the breakout interpretation. If buyers remain aggressive but price cannot gain ground and falls back under the level, the same tools are giving different evidence.
A reversion example works the same way. Suppose NQ becomes extended into a meaningful area and aggressive selling appears; the question is whether sellers continue producing downside progress or whether that pressure is being absorbed. Order flow does not create the location—it helps study what happens there.
Auction Market Theory provides useful context because order flow still belongs to the larger auction.
Volume Profile can show where business accumulated across a broader sample, while order flow adds more granular information when price reaches a location worth studying. Location and context remain upstream of the transaction detail.
What Order Flow Cannot Tell You
Order flow cannot reliably identify the motive behind every order. A participant may be hedging, speculating, arbitraging, entering, exiting, or executing part of a larger plan. Calling every unusual print “institutional buying” or “smart money” adds a story the data does not prove.
It also cannot guarantee that displayed liquidity remains in place or that a breakout, reversal, or divergence resolves in a particular direction. Positive delta does not promise higher prices, negative delta does not promise lower prices, and a large DOM order does not promise support. Those observations still require price response and context.
That limitation keeps the tool in its proper role: evidence about interaction rather than a prediction system. The trader becomes more precise by saying only what the data supports. More information is useful only when it improves the decision.
More Data Can Create False Precision
Order-flow screens can feel more certain because they contain numbers, colors, ladders, and rapidly changing information. A footprint can show hundreds of values while the DOM moves constantly and tape scrolls without stopping. The amount of activity can make uncertainty feel as though it has disappeared.
It has not. More data is not automatically more information, and more information is not automatically a better decision. If several tools are answering the same question poorly, adding another does not make the trade more qualified. A disciplined approach to choosing order-flow indicators starts with the question each tool is supposed to answer.
This is why The Market Comes First remains relevant even for advanced-looking order-flow tools. Market condition, structure, location, room, and risk still determine whether the situation deserves attention. Order flow should refine a question that already matters rather than manufacture importance in the middle of nowhere.
A Practical Order-Flow Decision Framework
Use Context → Location → Question → Order-Flow Evidence → Agreement/Disagreement → Decision. The sequence prevents the trader from starting with a flashing imbalance and searching backward for a reason to trade it. It also gives every tool a defined job.
- Context: What kind of market are we trading?
- Location: Is price somewhere meaningful?
- Question: What specifically am I trying to learn?
- Evidence: What are executed volume, delta, depth, footprint, or tape actually showing?
- Agreement or disagreement: Does that evidence support what price appears to be doing, or challenge the read?
- Decision: Wait, participate according to the setup, reduce confidence, or disqualify the trade.
Ask: “What question am I asking order flow to answer—and does this information actually answer it?” Then ask whether you would still care about the setup if the footprint, DOM, or delta panel disappeared. If the trade only exists because a tool produced an interesting color or number, the tool may be manufacturing the setup instead of evaluating it.
Final Thought
Order flow can show details that a conventional price chart does not display directly. It can organize aggressive execution, resting liquidity, delta, depth, tape, imbalance, absorption, exhaustion, and footprint information. Those details become useful when they answer a specific question at a meaningful location.
The goal is not to see everything happening in the market. It is to identify the information that matters to the decision in front of you and judge what that information actually accomplished in price. Order flow should answer a question—not give you an excuse to enter.
Before adding another order-flow indicator, ask whether it provides genuinely new evidence or simply another view of the same uncertainty. The strongest process remains context first, location second, evidence third, and risk before action; readers who want to keep building that context-first framework can continue with Decode the Market.
Educational content only. Trading involves substantial risk and is not suitable for everyone.