
Both tools can help a trader organize context, but neither should become an automatic support, resistance, target, or entry system. Volume Profile asks how much traded at each price, while Market Profile/TPO asks how repeatedly price appeared across defined time opportunities. Inside The Market, that distinction matters because the tool should answer a specific question before it is allowed to influence a trade.
Why Traders Confuse Volume Profile and Market Profile
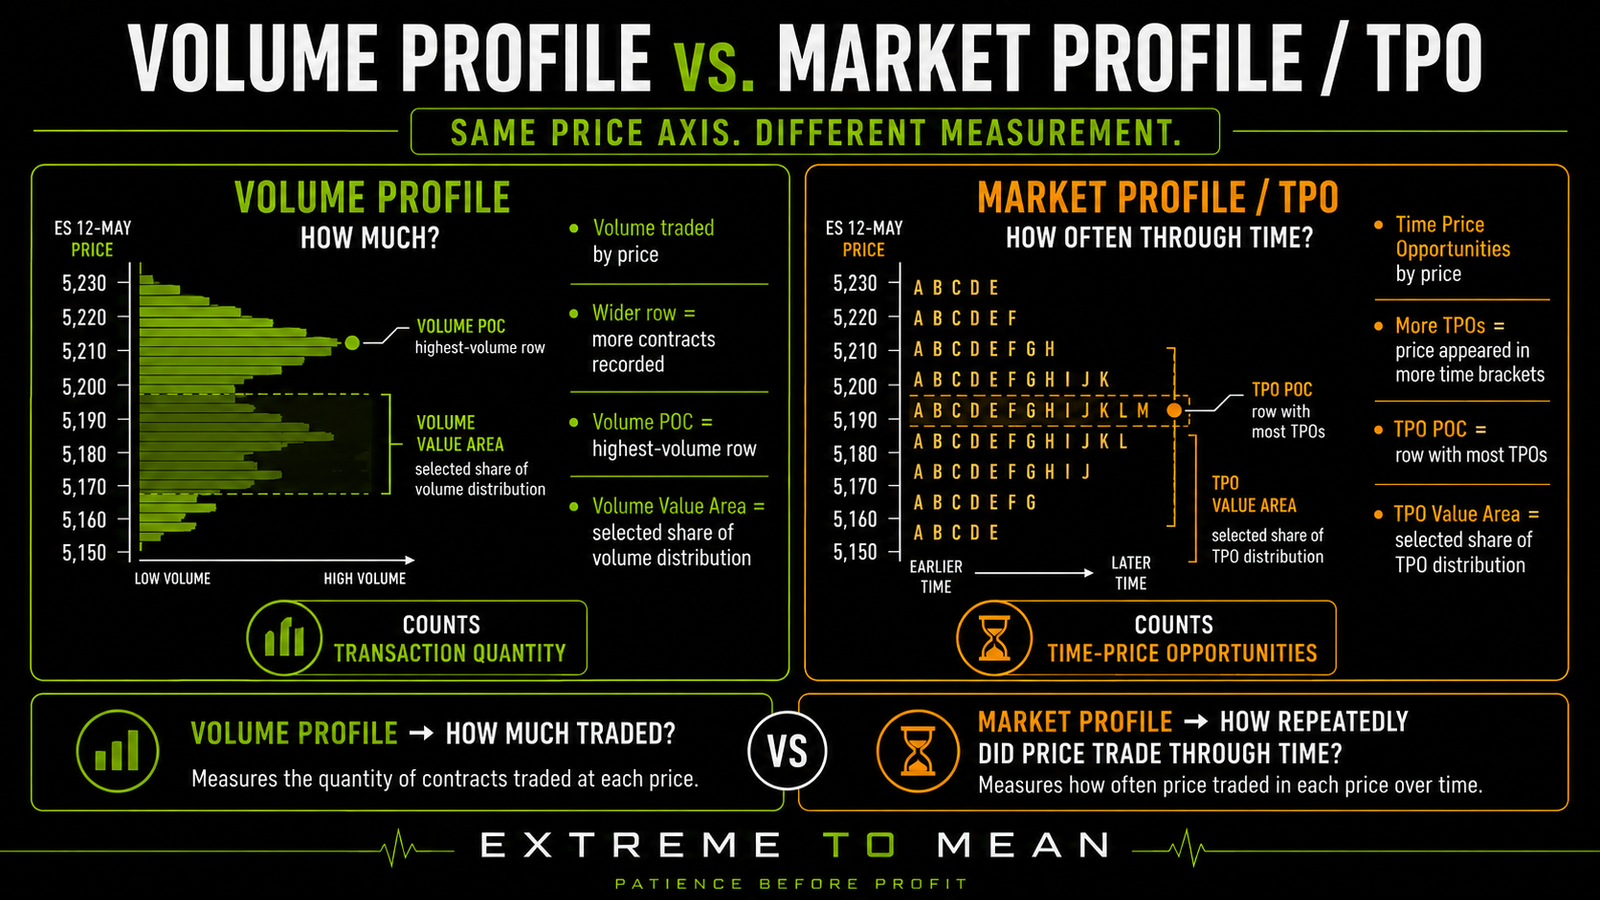
The confusion is understandable because the finished profiles often look similar. Both can appear as horizontal distributions beside price, show wider and thinner areas, calculate a Point of Control, and display a Value Area for a selected session or period. A trader can therefore glance at the two and assume they are different versions of the same indicator.
The similarity comes from the layout, not the measurement. Both organize information by price, but the underlying inputs are different, so the shapes can diverge even when they describe the same session. They can look similar without measuring the same thing.
That difference is easier to understand if you already have a basic grasp of how auction, liquidity, and emotion interact in market movement. The auction creates transactions and price movement, while profiling tools summarize selected parts of that activity after it occurs. They are ways of organizing evidence, not substitutes for the market itself.
Volume Profile Counts Volume at Price
Volume Profile organizes transaction volume by price. If ES trades 1,000 contracts around one price, 5,000 around another, and 12,000 around a third, the resulting distribution reflects those differences in contract quantity. Wider areas show where comparatively more volume was recorded inside the selected sample.
That makes the core question straightforward: how much traded at each price? It is the same basic volume information discussed in what volume and liquidity mean, reorganized across the price axis rather than displayed only by time. TradingView’s documentation describes Volume Profile in essentially this way: trading activity is distributed across specified price levels within a selected period.
A Volume POC is therefore the price or row with the greatest recorded volume under the selected profile settings. A Volume Value Area summarizes a selected share of the volume distribution, and its boundaries are derived from that calculation. Those references can be useful, but they remain outputs of the selected sample and methodology rather than universal market levels.
Market Profile / TPO Counts Time-Price Opportunities
Market Profile, commonly represented through TPOs, uses a different input. TPO stands for Time Price Opportunity, and a letter or block records that trading occurred at a given price during a defined time bracket. If price trades at the same level during many separate brackets, that price accumulates more TPOs.
It is tempting to simplify that into “Market Profile measures how long price stayed there,” but that wording is not quite precise enough. TPO measures time-based opportunity or repeated presence across defined brackets rather than an exact stopwatch measurement of seconds spent at one price. Sierra Chart’s documentation describes each TPO as trading occurring at a particular price during a specified time subperiod, which is why “time-based opportunity at price” is the cleaner description.
A TPO by itself does not tell you how much volume traded during that visit. Ten contracts, 1,000 contracts, or 10,000 contracts can all produce evidence that a price traded during the bracket, while the transaction quantity is a separate measurement. TPO records opportunity through time; Volume Profile records transaction quantity.
One Price Can Tell Two Different Stories
Consider a hypothetical ES session with two important prices. Price A at 6,000 trades during six different 30-minute periods and records 8,000 contracts, while Price B at 6,010 trades during only two 30-minute periods but records 14,000 contracts. The market showed more time-based persistence at Price A and more transaction volume at Price B.
A TPO profile may therefore emphasize 6,000 more heavily because price appeared there across more time brackets. A Volume Profile may emphasize 6,010 because the larger quantity of contracts traded there. Neither profile is wrong; each is answering a different question about the same session.
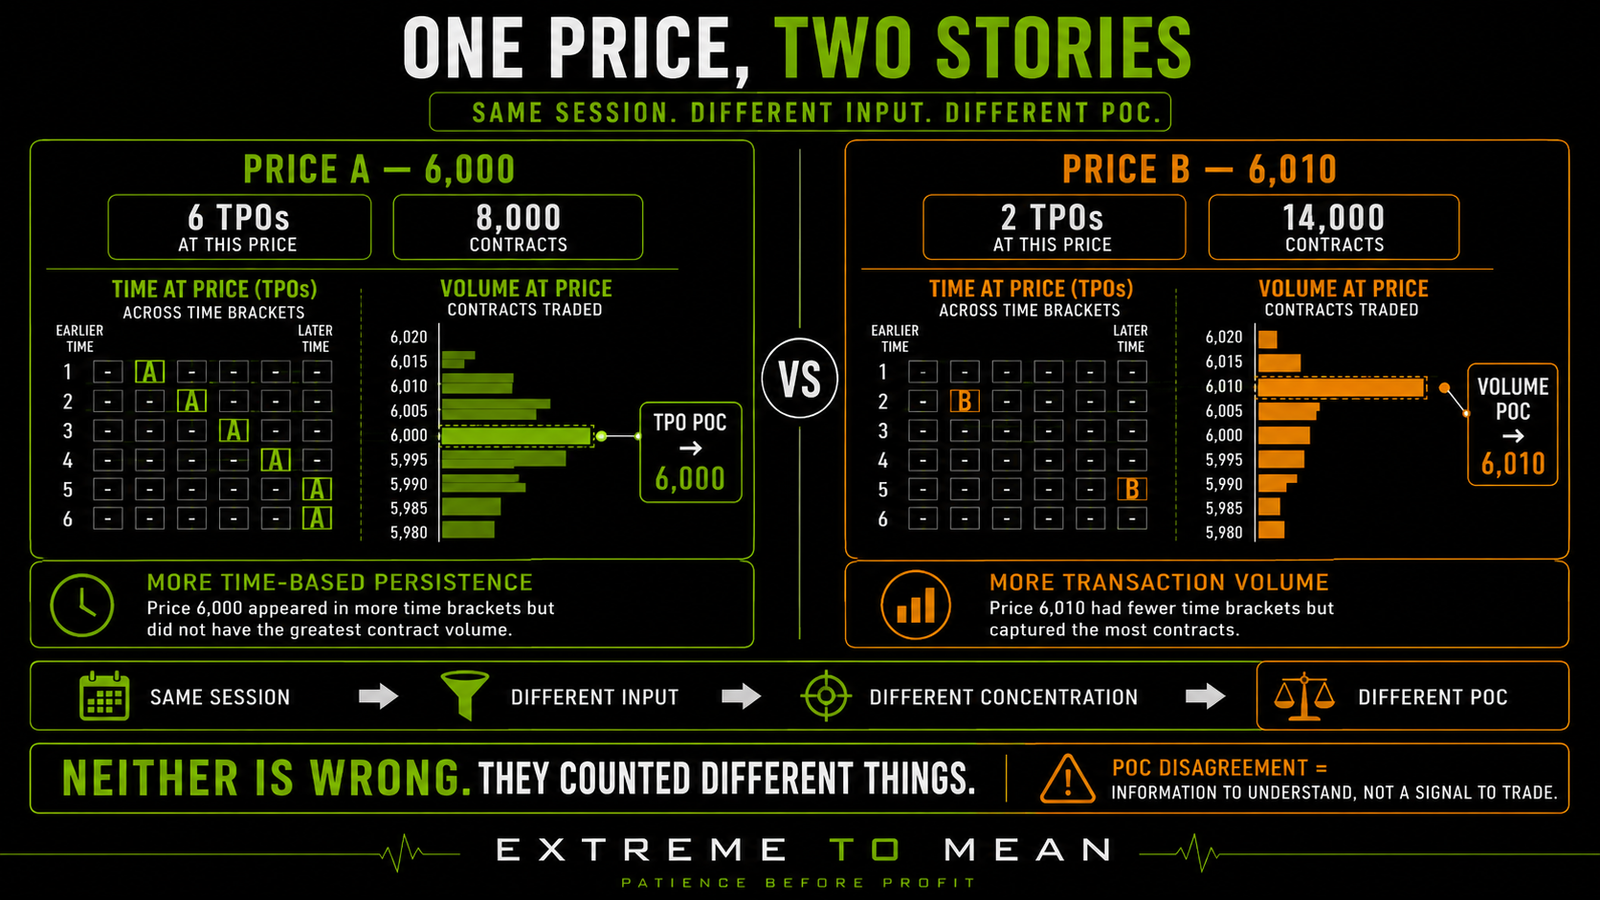
That distinction becomes especially useful when the two POCs differ. A TPO POC answers “which price appeared in the greatest number of time opportunities?”, while a Volume POC answers “where did the most volume trade?” Sierra Chart’s documentation explicitly treats TPO POC and Volume POC as separate calculations, which is exactly why the two references can legitimately land at different prices.
Different Inputs Can Produce Different POCs and Value Areas
Suppose the TPO POC is 6,000 while the Volume POC is 6,008. It would be easy to build a story that “fair value” sits at one level while “real money” sits at the other, but neither conclusion is contained in the measurements themselves. The simpler observation is that prior activity concentrated differently when measured through time opportunities versus transaction volume.
The same distinction applies to Value Area. A Volume Value Area summarizes a selected share of the volume distribution, while a TPO Value Area summarizes a selected share of the TPO distribution. Because the underlying distributions differ, the resulting VAH, VAL, and POC references can differ as well.
Settings can widen that difference further. Time-bracket length, price increment, session template, profile period, data resolution, row aggregation, and Value Area settings can all affect what the final distributions look like. Two precise-looking profiles may disagree partly because the traders asked their software slightly different questions.
Both Profiles Sit Inside a Broader Auction Framework
Auction Market Theory provides the broader framework for interpreting balance, imbalance, acceptance, rejection, and price discovery. Volume Profile and TPO are not the theory itself; they are two different ways of organizing evidence generated by the auction. One emphasizes transaction quantity across price, while the other emphasizes repeated time-based opportunity across price.
That hierarchy matters because a tool can describe activity without dictating the trade. A concentration of volume or TPOs may make an area worth studying, but current price still has to show whether the market is accepting, rejecting, rotating, or repricing there. The profile adds context; structure, location, and risk still determine whether anything is tradable.
Agreement Is Not Automatic Confluence, and Disagreement Is Not a Signal
When Volume POC, TPO POC, VWAP, and a prior close all cluster near one price, the area may deserve more attention because several references occupy similar territory. That does not mean the level has to hold or that the market has become predictable. Confluence upgrades attention; it does not eliminate uncertainty.
The opposite mistake happens when the POCs separate. Traders can quickly label that difference “divergence,” “smart money positioning,” or an imbalance that needs to resolve, even though the profiles are simply measuring different distributions. The first job is to understand why the measurements differ before assigning any trading meaning to the separation.
This is where context before the candle remains useful. A profile reference can make an area worth watching, but current price behavior still determines whether the market accepts, rejects, rotates through, or ignores that area. The profile tells you what the selected sample looked like; the market still has to tell you what it is doing now.
Which Profile Should a Futures Trader Use?
There is no universal winner. If the question is “Where did the most contracts trade?”, Volume Profile directly answers it; if the question is “At which prices did the market repeatedly trade across time brackets?”, TPO is the more direct measurement. If both dimensions matter to the trader’s process, both can be useful.
Using both is optional rather than mandatory. Adding a second profile without understanding the distinct job it performs can simply add clutter and create more opportunities to invent explanations after the fact. More information only improves the process when the trader knows what question each piece of information is supposed to answer.
Session structure also matters because both profiles require a defined sample. A trader studying an intraday session may care about how the profile relates to references such as the Initial Balance, while a multi-day composite answers a broader question. Before deciding which profile to use, decide what market period you are actually trying to understand.
A Practical Volume Profile vs. Market Profile Comparison
The cleanest way to remember the distinction is Same Price Axis → Different Input → Different Distribution → Different Reference → Same Need for Context. Both tools organize information horizontally by price, but one counts transaction volume and the other counts time-price opportunities. Because the input differs, the POC, Value Area, and profile shape can differ without creating a contradiction.
| Question | Volume Profile | Market Profile / TPO |
|---|---|---|
| Primary measurement | Volume traded | Time-price opportunities |
| Core question | How much traded at each price? | During how many time brackets did price trade there? |
| Distribution | Volume by price | TPOs by price |
| POC | Highest-volume row or price | Row with most TPOs |
| Value Area | Based on selected share of volume | Based on selected share of TPOs |
| Shows actual contract quantity? | Yes, when transaction-volume data is available | No |
| Shows repeated time-bracket presence? | Not directly | Yes |
| Can the two POCs differ? | Yes | Yes |
| Predicts next direction? | No | No |
| Automatic support/resistance? | No | No |
| Relationship to AMT | Evidence / tool | Evidence / tool |
Different measurement does not mean one is more truthful. It means each describes a different dimension of the same auction, and the trader still has to decide whether that information is relevant to the current market. The better question is not “Which profile is better?” but “Am I trying to understand transaction volume at price, or time-based persistence at price?”
Then ask one more question: “What additional information will that measurement add to the decision I am already making?” If the answer is unclear, adding another profile may not improve the chart. A tool earns its place by answering a defined question, not by creating another line or distribution to watch.
Final Thought
Volume Profile and Market Profile can look almost identical because both arrange information across price. The difference is underneath the shape: Volume Profile counts how much traded, while TPO counts how repeatedly price appeared through defined time opportunities. Their POCs, Value Areas, and distributions can therefore disagree without either tool being defective.
That disagreement is not automatically a trade, and agreement is not automatically confluence strong enough to remove uncertainty. Structure, location, volatility, current participation, and risk still matter after the profile has done its job. The trader’s task is to understand what the tool measured before deciding what the measurement means.
Before asking which profile is better, ask whether you can explain exactly what each one is counting and which measurement answers the question you are trying to solve. Readers who want to continue building that context-first approach can explore Decode the Market, where market tools are treated as inputs to judgment rather than replacements for it.
Educational content only. Trading involves substantial risk and is not suitable for everyone.