
A normal price chart tells you where price traveled, while traditional volume tells you how much activity occurred during each bar or time period. Volume Profile adds a different question: at which prices did that activity occur? Inside The Market, that makes it a context tool first and a trading tool only after price, structure, and risk have been evaluated.
What Volume Profile Actually Shows
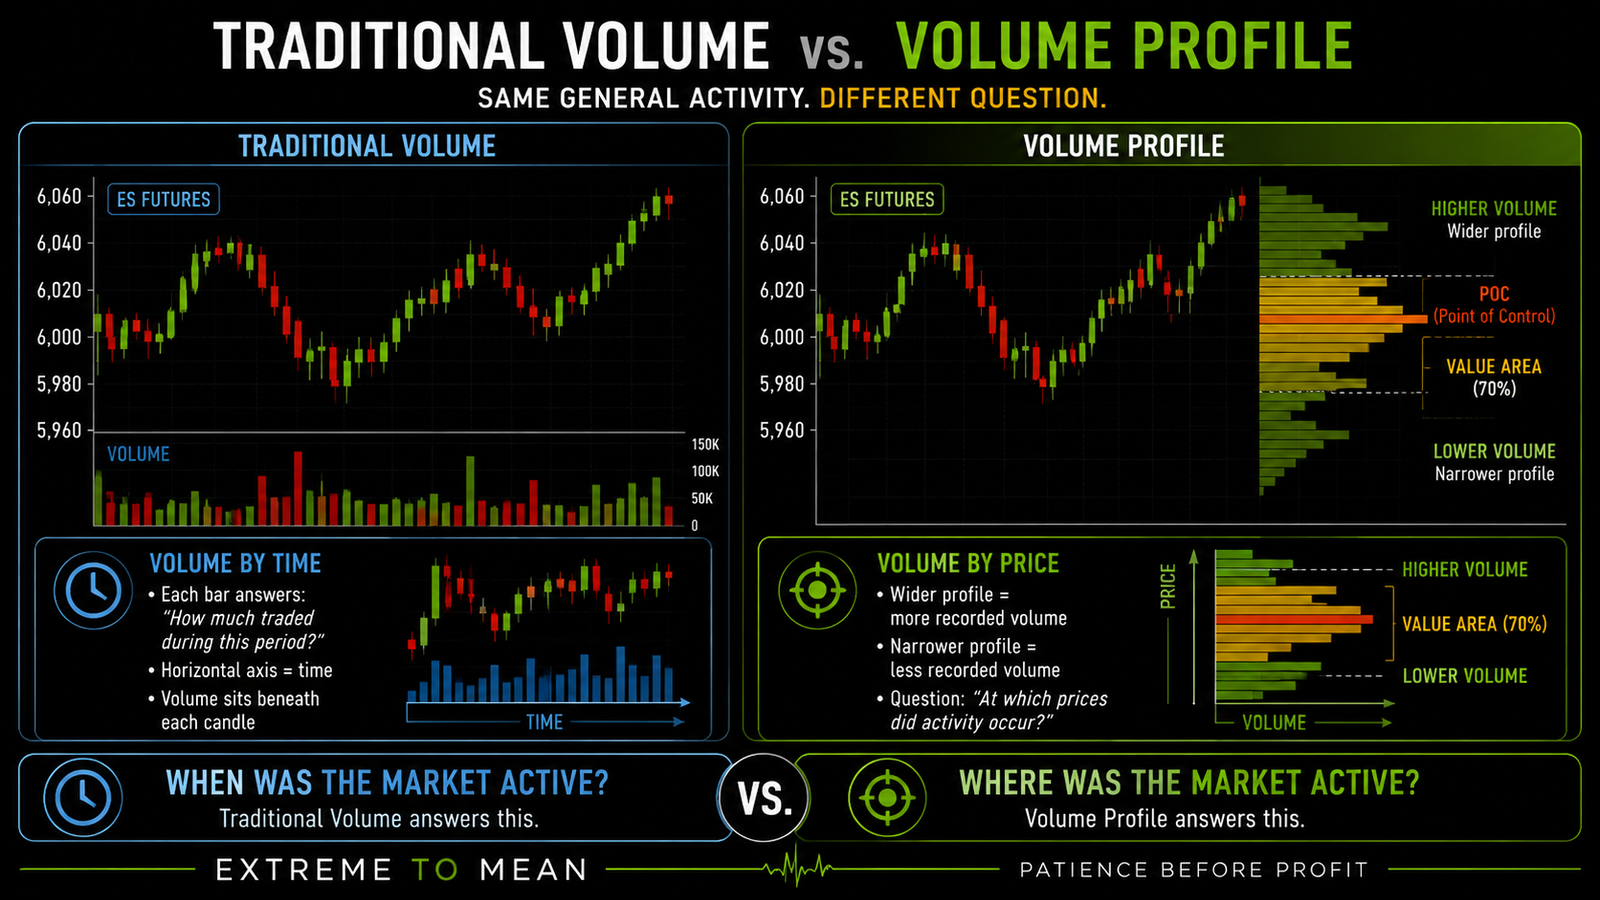
Traditional volume is usually displayed vertically below a price chart. Each bar answers a time-based question: how much traded during this candle, minute, hour, or session? If you need a deeper foundation first, what volume and liquidity mean explains why activity and available liquidity are related to market movement without being the same thing.
Volume Profile reorganizes trading activity along the price axis instead. Prices where comparatively large amounts of volume traded produce wider horizontal bars, while prices with less recorded volume produce thinner areas. TradingView's documentation describes the tool in essentially those terms: trading activity is organized across specified price levels for the period being profiled. (tradingview.com)
That changes the question from “When was the market active?” to “Where was the market active?” It is a simple shift, but it changes how the trader reads a session because the profile exposes the distribution of participation across price rather than only across time. The information is historical and descriptive; interpretation still comes afterward.
The Profile Is Defined by the Period You Choose
A Volume Profile is not one permanent map of a market. Before interpreting POC, Value Area, VAH, VAL, or any node, the trader has to know what data was included in the profile. A single session, previous session, visible chart range, week, custom range, or multi-session composite can all produce different distributions.
That means changing the scope can change the levels. A morning-only ES profile may show its heaviest activity around 6,010, while the full session could place the greatest concentration somewhere else after substantial afternoon trading develops between 6,030 and 6,050. A multi-day composite may produce yet another answer because it is measuring a different sample.
None of those profiles has to be “wrong.” They answer different questions because they were built from different data. Before interpreting any Volume Profile level, ask what data created it.
This matters especially in futures because session definitions can differ. A trader may profile regular trading hours, the full electronic session, overnight trading, or a custom template, and those choices can materially change the resulting distribution. There is no universal instruction to always use RTH or always include overnight volume; the important point is knowing which market sample your profile represents.
POC, Value Area, VAH, and VAL Are Derived References
The Point of Control, or POC, is the highest-volume price level or profile row within the selected period and calculation settings. In plain English, more volume was assigned to that row than to any other row in the profile. It does not by itself prove fair value, support, resistance, a future target, or a price that the market must revisit.
The reference can also be less exact than its clean horizontal line makes it look. Platforms may aggregate multiple ticks into profile rows, use different source resolutions, and apply different calculation settings. That means a data-derived line can be precise within a particular configuration without possessing universal precision across every chart or platform.
The Value Area is a calculated region intended to capture a large portion of the profile's activity around the heavier part of the distribution. The percentage is configurable rather than a market law: TradingView currently uses 70% as a default, while NinjaTrader documentation uses a configurable 68% default. The useful lesson is not memorizing one percentage; it is understanding that Value Area is a statistical summary created from selected data and settings. (tradingview.com, ninjatrader.com)
VAH is the upper boundary of that calculated Value Area, while VAL is the lower boundary. Those lines tell you where the configured value region begins and ends, but they do not automatically mean resistance above and support below. What price actually does when it reaches, leaves, or re-enters those boundaries still has to be observed.
Do Not Confuse a Clean Line With Universal Precision
Two traders can load Volume Profile on ES and get slightly different POCs, Value Areas, or nodes without either platform necessarily being broken. Differences in data feeds, RTH versus ETH templates, period boundaries, row size, tick resolution, Value Area percentage, and calculation methodology can all change the output. NinjaTrader's documentation, for example, allows different source resolutions and ticks-per-level configurations. (ninjatrader.com)
The danger is psychological as much as technical. A horizontal line drawn at 6,002 can look as though the market itself declared 6,002 uniquely important, when the line is really an output created from a particular sample and calculation method. Do not confuse a precise-looking line with universal precision.
This same principle applies to developing profiles. A completed profile tells you where POC and Value Area finished for that sample, while a developing profile changes as new transactions enter the distribution. The profile is not merely a collection of yesterday's permanent lines; its shape can evolve as the auction evolves.
High-Volume and Low-Volume Areas Tell You About Activity
A High-Volume Node, or HVN, is an area where the profile bulges because comparatively more volume traded there than at surrounding prices. The clean descriptive conclusion is that a lot of business occurred there during the selected sample. Whether that should be interpreted as meaningful acceptance in the current market depends on context rather than on the histogram alone.
A Low-Volume Node, or LVN, is an area where the profile narrows because comparatively less volume traded there. That tells you less business occurred at those prices during the sample being measured. It does not prove that price will race through the area, reject it, break out through it, or behave the same way the next time it arrives.
This distinction keeps raw data separate from trading stories. High volume does not automatically mean a level must hold, and low volume does not automatically make a level fragile. A profile can identify places worth paying attention to without telling the trader what decision to make there.
Volume Shows Activity—Not Identity or Intention
Suppose enormous volume trades at ES 6,000. Volume Profile can tell you that substantial activity occurred around that price, but it cannot tell you from the histogram alone that buyers were winning, sellers were winning, institutions were accumulating, or institutions were distributing. Every completed futures transaction has both sides.
It also does not reveal who the participants were or why they acted. The profile generally cannot tell you whether a trader was institutional or retail, opening or closing, informed or uninformed, hedging or speculating. Volume Profile shows activity—not identity or intention.
That is why the resulting price behavior still matters. Heavy activity followed by acceptance, rejection, continuation, or structural failure can provide additional information that the static histogram does not contain by itself. The broader auction and liquidity mechanics behind that distinction are explored in how the stock market actually moves through auction, liquidity, and emotion.
Auction Market Theory Gives the Questions; Volume Profile Organizes Some of the Evidence
Auction Market Theory asks whether trade is developing, failing to develop, balancing, repricing, or migrating to a new area. Volume Profile gives the trader one way to visualize where transacted volume accumulated across price. The framework and the tool therefore complement each other without becoming interchangeable.
That distinction matters because Volume Profile is not Market Profile either. Volume Profile organizes volume at price, while Market Profile or TPO methodology organizes time or opportunity at price using a different structure. A later lesson can compare them properly; for this article, the important point is simply that they answer related but different questions.
The same separation applies to VWAP. VWAP reduces a sample to a volume-weighted average price, while Volume Profile preserves a distribution of volume across many price levels. Both use volume, but one produces an average and the other produces a map.
Yesterday's Profile Is Not Today's Command
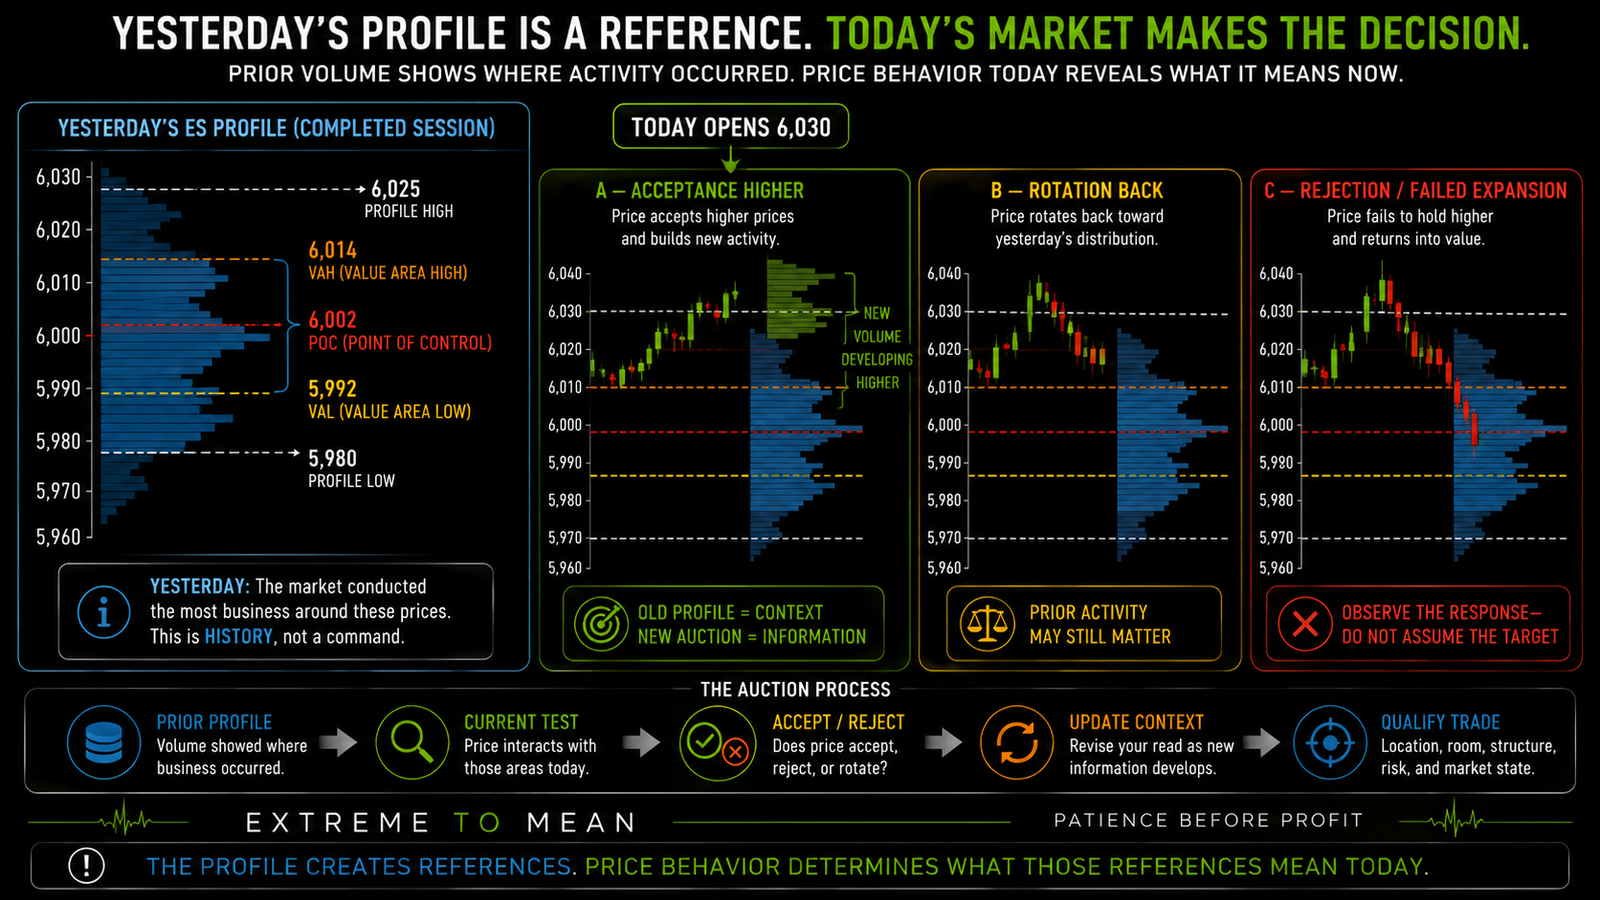
Imagine yesterday's ES profile ended with POC at 6,000, VAH at 6,015, and VAL at 5,985. Today opens at 6,030, well above the prior distribution. The weak conclusion is, “Price is above value, so it has to revert to POC.”
The better conclusion is that yesterday's market concentrated substantial activity lower, while today's market is currently trading somewhere different. The trader can now ask whether price is accepting the higher region, rejecting it, rotating back toward prior activity, or building a new developing distribution. The old profile provides context; today's auction provides the decision.
This is especially useful when reviewing early-session references such as the Initial Balance. Prior-session profile levels and early-session structure can coexist on the same chart, but neither should automatically overrule what the current market is actually doing. The job is to determine whether today's participation still respects the old references or is moving beyond them.
A Simple Futures Example
Suppose a completed ES session has a profile low at 5,980, VAL at 5,992, POC at 6,002, VAH at 6,014, and a profile high at 6,025. The next session opens at 6,012, inside the prior Value Area. That starting location gives the trader references, but it does not create an automatic buy, sell, or fade.
In one scenario, price remains inside the prior high-activity region and repeatedly rotates through it. That suggests yesterday's references may still be relevant to current two-way trade. A market behaving this way may also resemble the rotational state discussed in The Three Market States, but the profile still does not remove the need for setup qualification.
In another scenario, price moves above 6,014 and begins developing meaningful activity higher. Yesterday's Value Area may no longer describe today's emerging distribution particularly well if participation is migrating. The correct response is not to keep insisting that VAH must act as resistance simply because it is drawn on the chart.
A third scenario has price move above 6,014, fail to sustain business there, and return rapidly inside the prior Value Area. That gives the trader different information because the attempted expansion did not behave like the acceptance scenario. In all three cases, the profile defined what the market was testing; it did not predict the result of the test.
The Profile Should Lead to Questions, Not Orders
Use Scope → Distribution → Activity → Reference → Test → Context. The sequence prevents the trader from jumping directly from a visible profile line to an order. It asks what created the reference before asking whether that reference matters today.
- Scope: What period am I profiling?
- Distribution: How was volume spread across price?
- Activity: Where was comparatively more or less volume recorded?
- Reference: What do POC, Value Area, VAH, VAL, HVNs, or LVNs actually represent?
- Test: What happens when current price interacts with those areas?
- Context: Does current structure, market state, location, room, and risk support a usable trade?
| Tool / Level | What It Shows | What It Does Not Prove |
|---|---|---|
| Traditional volume | Volume during each time period | Where inside the period volume occurred |
| Volume Profile | Distribution of volume across price | Future direction |
| POC | Highest-volume row or price in selected profile | True fair value or guaranteed magnet |
| Value Area | Configured region containing a large portion of profile volume | Automatic trading range |
| VAH | Upper Value Area boundary | Automatic resistance |
| VAL | Lower Value Area boundary | Automatic support |
| HVN | Comparatively high-volume region | Price must stall there |
| LVN | Comparatively low-volume region | Price must accelerate through it |
The better question is not, “What Volume Profile level should I trade?” Ask: “Where did the market previously conduct the most and least business—and what is price proving when it interacts with those areas now?” Then ask the question that comes before even that: “What profile period am I looking at, and why is that the correct sample for the decision I am trying to make?”
Final Thought
Volume Profile is a map of where transactions occurred within a selected sample. POC, Value Area, VAH, VAL, and volume nodes can all provide useful references, but their meaning depends on the period, settings, current market behavior, and the question being asked. A data-derived reference is not the same thing as an automatic trading instruction.
Used well, the profile adds another layer to the market's story: not only where price traveled, but where activity accumulated along the way. Price structure, volatility, session behavior, acceptance, rejection, and risk still determine whether those historical references matter to the trade in front of you. The trader's job remains to evaluate rather than react.
Before trading a POC, Value Area boundary, or volume node simply because it is drawn on the chart, ask whether you can explain what data created it, why that particular profile matters, and what the current market is actually doing when price reaches it. Readers who want to continue developing that context-first way of reading markets can explore Decode the Market.
Educational content only. Trading involves substantial risk and is not suitable for everyone.