
Inside The Basics, the cleanest way to separate the two is to think in terms of flow and inventory. Volume measures the flow of transactions during a period, while open interest measures the stock of contracts that remain open at a reporting point. Volume asks, “How much traded?” Open interest asks, “How much remains open?”
The confusion begins when traders attach directional stories to descriptive statistics. Rising open interest becomes “new longs” and high volume becomes “confirmation,” even though the cleaner process is to understand the mechanics first and then ask what price actually accomplished.
Volume vs. Open Interest: The Short Answer
Futures volume is the number of contracts traded during a specified period. That period might be a bar, hour, session, or day, which makes volume useful for judging how active the current auction is. CME describes volume as the number of contracts traded on the selected date across its venues. (cmegroup.com)
Open interest measures contracts that have been entered into and remain outstanding rather than the amount of turnover that occurred. Every open futures contract has both a long side and a short side, but only one contract is counted in open interest. CFTC also notes that aggregate long open interest equals aggregate short open interest. (cftc.gov)
A simple mental model is Volume = Flow and Open Interest = Outstanding Inventory. The earlier lesson on what volume and liquidity mean explains why trading activity matters to the environment; open interest adds a different question about what position exposure survived that activity. Volume measures turnover. Open interest measures what remains open.
One Trade Can Affect the Two Numbers Differently
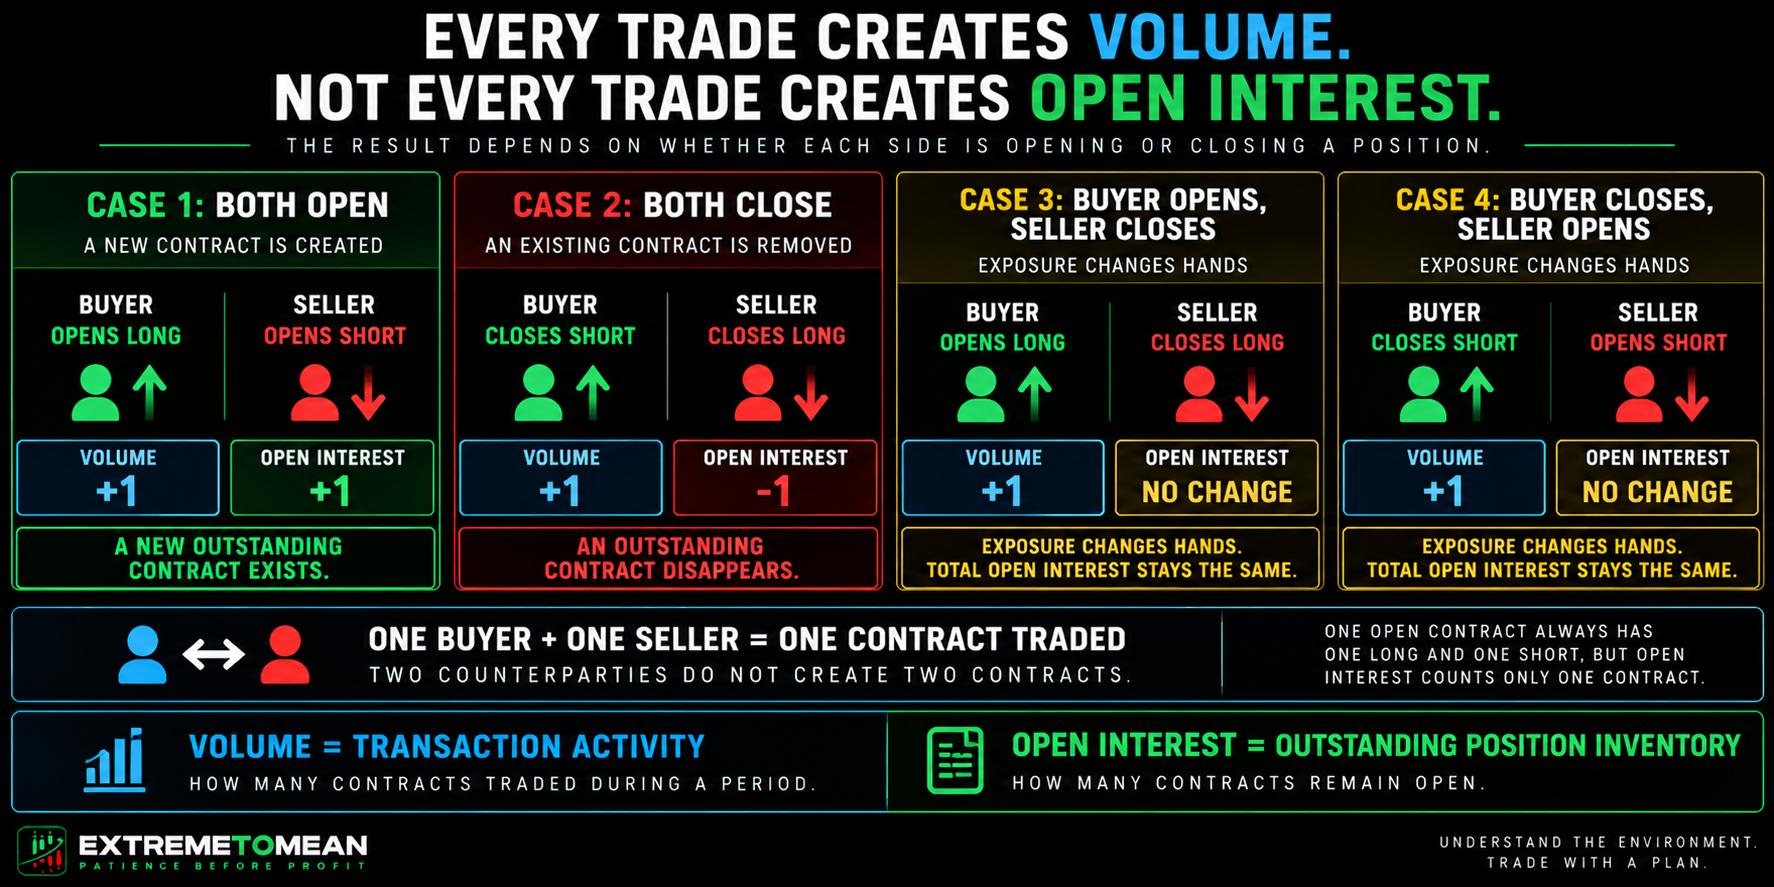
Every completed futures transaction adds to volume, but it does not automatically increase open interest. The open-interest effect depends on whether the buyer and seller are opening new positions, closing existing positions, or transferring exposure from a closing participant to an opening one. Every trade creates volume. Not every trade creates open interest.
| Buyer | Seller | Volume | Open Interest |
|---|---|---|---|
| Opens a new long | Opens a new short | +1 | +1 |
| Closes an existing short | Closes an existing long | +1 | −1 |
| Opens a new long | Closes an existing long | +1 | No change |
| Closes an existing short | Opens a new short | +1 | No change |
When both sides open, a new outstanding contract exists, so volume rises by one and open interest rises by one. When both sides close, a transaction still occurred, so volume rises by one while open interest falls by one. When one participant opens and the other closes, ownership changes without changing the total number of outstanding contracts.
This also prevents a basic counting error. One buyer and one seller do not create two units of volume, and one long plus one short do not create two units of open interest; they are the two sides of one contract. Two counterparties do not create two contracts. (cmegroup.com)
Neither Volume Nor Open Interest Is Directional
Rising open interest is not automatically bullish because every newly created futures contract requires both a new long and a new short. If open interest increases by 10,000 contracts, the market has 10,000 additional long positions matched against 10,000 additional short positions. Futures cannot create a new long without creating the matching short. (cftc.gov)
Raw volume has the same limitation. One million NQ contracts traded means the market was extremely active, not that one million contracts were somehow bought without sellers on the other side. Volume measures activity—not bullishness or bearishness.
That is also why total volume should not be confused with Cumulative Volume Delta. Volume counts completed transactions, while CVD attempts to classify executed activity by aggressive buying versus aggressive selling and accumulate the difference. The raw volume total does not identify which side initiated the trades or which side will ultimately be right.
Open Interest Usually Moves on a Different Clock
Volume can be observed continuously during the trading day because each completed transaction adds to the running total. Open interest is fundamentally a clearing and reporting statistic, so the number displayed on a platform may represent the latest reported daily figure rather than a live five-minute measurement. Before interpreting open interest, verify the source, contract month, reporting date, and update frequency.
CME says its Daily Volume and Open Interest report is preliminary at the end of the trading day, with official data following the next morning. Its settlement pages can also show current-day estimated volume beside previous-day open interest. Volume can help describe the current auction; open interest usually describes what survived the previous clearing cycle. (cmegroup.com)
Contract Month and Rollover Matter
Open interest belongs to an actual futures contract or contract month, not merely to a root symbol such as ES or NQ. The same is true of volume because September NQ and December NQ are separate contracts with separate trading activity and outstanding positions. Understanding what a futures contract actually is makes that distinction easier to see.
Rollover is one of the clearest practical uses for both numbers. Volume can show where trading activity is migrating while open interest shows where positions still remain, and heavy roll volume may simply reflect exposure moving between months. Position transfer should not be mistaken for directional conviction.
What Volume Can Legitimately Tell You
Volume helps describe participation. Traders can compare current activity with nearby bars, the same time of day, or a recent session baseline to judge whether the market is unusually active or quiet. Volume needs a baseline before it becomes context.
High volume does not automatically confirm continuation because large turnover can appear during breakouts, failed breakouts, liquidation, reversals, news shocks, or rollover. Low volume does not automatically make a move false, either. High volume tells you the market cared; price response tells you what that activity accomplished.
What Open Interest Can Legitimately Tell You
Open interest helps answer whether outstanding exposure expanded, contracted, or stayed relatively stable from one reporting point to the next. Imagine 250,000 contracts of daily volume while open interest rises from 300,000 to 302,000; the market processed enormous turnover while outstanding inventory increased by only 2,000 contracts. A rise also does not tell us how many dollars “flowed in” or how many traders were involved, because open interest is a contract count—not a money-flow or head-count statistic.
Price and Open Interest Add Context, Not Signals
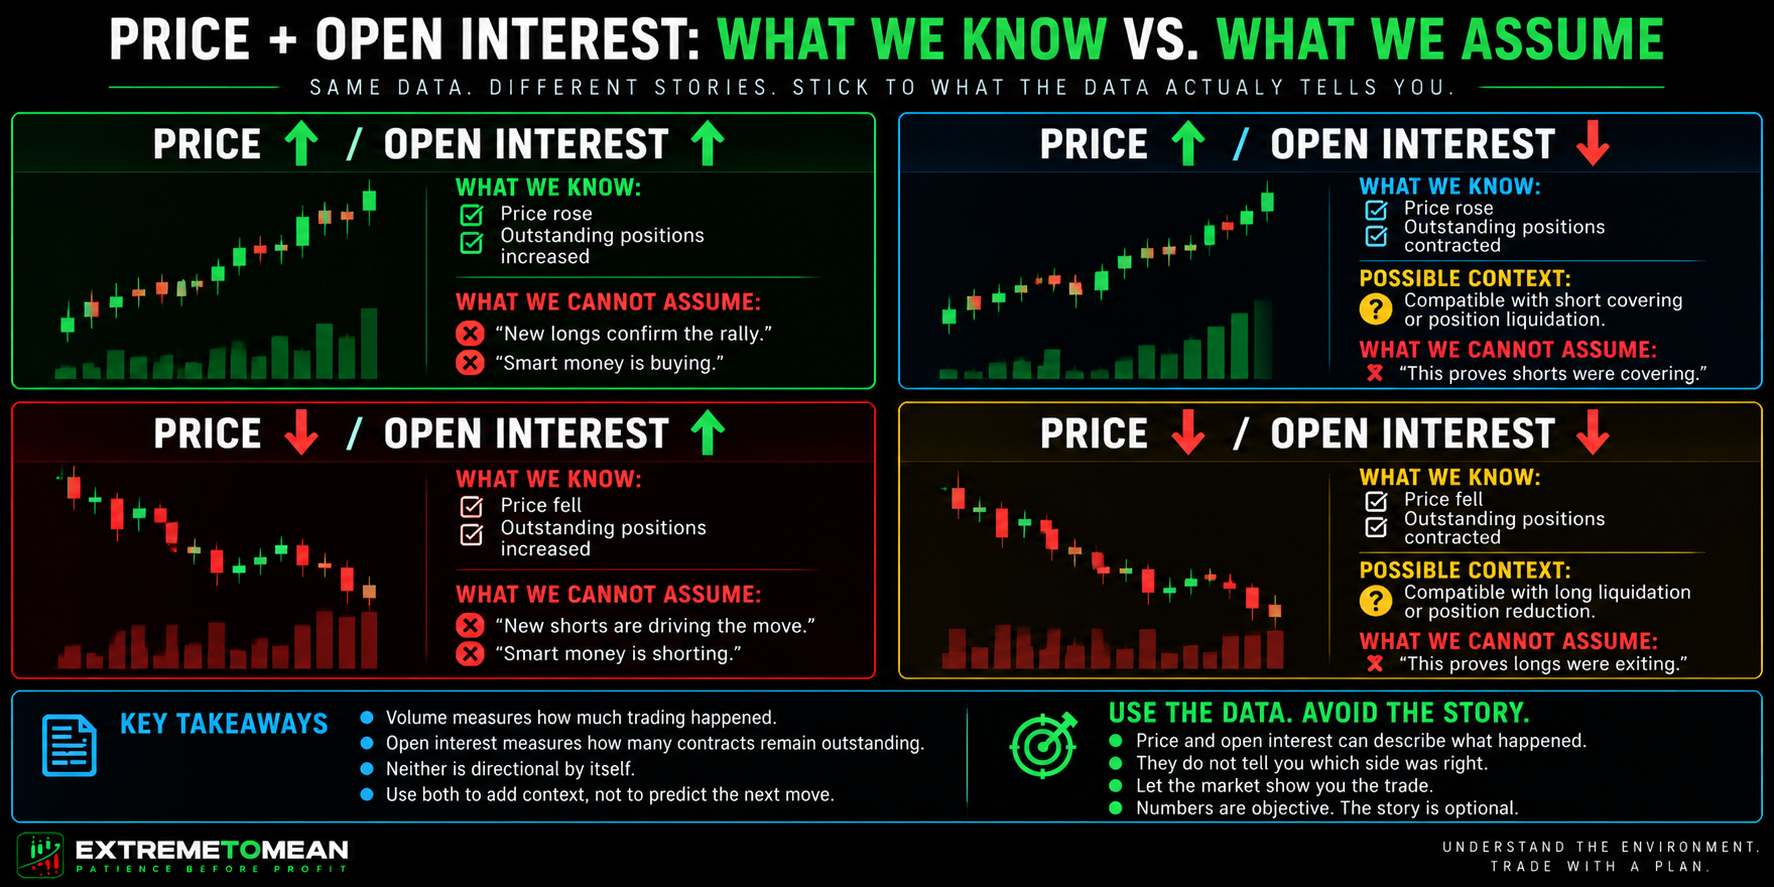
The traditional price-and-open-interest matrix can be useful if it is read cautiously. Its real question is whether a price move occurred while outstanding position inventory was expanding or contracting. It does not identify which participant group initiated the move or predict what the next candle must do.
| Price | Open Interest | Careful Interpretation |
|---|---|---|
| Rising | Rising | Price rose while outstanding positions expanded |
| Rising | Falling | Price rose while outstanding positions contracted |
| Falling | Rising | Price fell while outstanding positions expanded |
| Falling | Falling | Price fell while outstanding positions contracted |
Price up with falling open interest is often called short covering, and price down with falling open interest is often called long liquidation. Those descriptions may be compatible with what happened, but open interest alone cannot prove that one participant group caused the move. Compatible with short covering is not the same as proven short covering.
When open interest rises, price up means positions expanded during an advance and price down means positions expanded during a decline; new longs and new shorts existed in both cases. Use price and open interest to classify participation—not predict the next candle. The framework is useful because it organizes context without pretending to identify the winning participant.
Volume and Open Interest Work Best Together
Taken together, the statistics answer complementary questions. High volume can accompany rising, flat, or falling open interest, telling us whether heavy turnover left more, similar, or less outstanding exposure behind. None of those combinations is automatically bullish or bearish.
They also remain distinct from other tools. Volume Profile organizes traded volume by price, while open interest measures outstanding contracts and live market depth describes resting orders. Volume tells you how much, Volume Profile tells you where, and open interest tells you what remains open.
A Practical ETM Volume-and-Open-Interest Framework
Use Contract → Volume → Open Interest → Change → Price → Context → Decision. The sequence identifies the contract first, separates turnover from outstanding inventory, and only then asks whether the information adds anything useful to the price read. Activity can improve understanding of a setup, but it cannot replace location, structure, invalidation, or risk.
- Contract: Which actual expiration are these numbers describing?
- Volume: How much trading occurred?
- Open Interest: How many contracts remained outstanding?
- Change: Did outstanding exposure expand, contract, or stay roughly stable?
- Price: What did price accomplish while participation changed?
- Context: Was this normal trading, news, rollover, expiration, trend, or chop?
- Decision: Does the information clarify an existing setup, or is it simply an interesting statistic?
The better question is not “Is rising open interest bullish?” Ask instead, “What changed in outstanding exposure, what did price do while it changed, and does that information actually improve my understanding of this trade?” That shift keeps the statistic tied to a defined question instead of giving an existing bias a more sophisticated story.
This matters because traders are very good at turning objective numbers into subjective confirmation. A bullish trader can call rising open interest “new longs,” while a bearish trader can call the same number “new shorts”; a trader already long can call high volume confirmation while another calls it capitulation. Numbers can be objective while the story attached to them is not.
Final Thought
Volume and open interest become much easier to use once they are given separate jobs. Volume tells us how much trading happened, while open interest tells us how many contracts remained outstanding after positions were opened, closed, or transferred. Neither metric by itself identifies the winning side of the market.
Their value comes from context. Volume can describe current activity, open interest can describe changes in outstanding position inventory, and price can show what the market actually accomplished while participation changed. Read activity. Read positioning. Then make price prove the trade.
That keeps descriptive statistics in their proper role instead of turning them into a prediction machine, which is the same process-first discipline developed throughout The Patience Principle. The goal is not to make the numbers say more; it is to make the interpretation cleaner.
Educational content only. Trading involves substantial risk and is not suitable for everyone.