
When an index rebounds sharply after several weak sessions, the move can feel important immediately. Price accelerates, headlines turn more optimistic, and traders who were waiting for a recovery begin wondering whether the low is already behind them. That reaction is understandable because price is the most visible piece of market information, but a large percentage move does not tell you how many stocks actually participated. The strength of the index and the strength of the market underneath the index are related, but they are not always the same thing.
That distinction belongs inside The Market because breadth is context rather than an automatic trading instruction. A trader is not trying to make breadth predict the next candle or prove that a low must hold. The objective is to ask whether the rebound is being supported by a meaningful expansion in participation or whether a relatively narrow group of stocks is doing most of the lifting. The trader's job is to evaluate what came with the move before deciding how much confidence the move deserves.
A Quick Market-Breadth Refresher
Market breadth asks how much of the market is participating in a move. One common breadth measure compares advancing securities with declining securities, which helps reveal whether strength or weakness is broadly distributed rather than concentrated in a small number of names. Nasdaq describes the advance-decline measure as the number of issues trading above their previous closes relative to those trading below them. (nasdaq.com)
That makes breadth different from simply looking at an index level. An index can rise while participation underneath it is strong, mediocre, or deteriorating, which is why breadth can confirm or question what headline price appears to be saying. The market-internals dashboard framework adds TICK and up volume versus down volume to that confirmation question. The distinction becomes especially important when the market is emerging from a selloff because the first rebound often looks powerful after traders have become accustomed to weakness. A fast move off the lows deserves attention, but it has not yet answered whether the market itself is broadening.
What a Breadth Thrust Actually Means
In general terms, a breadth thrust describes a rapid and meaningful expansion in market participation. Instead of a rebound being carried by only a handful of large stocks, advancing issues become much more widespread and other internal measures begin showing that buying pressure is reaching a larger portion of the market. The important word is breadth: the strength is coming from how many securities are participating, not merely from the number of index points gained. That is why the visual size of the bounce should be treated as the beginning of the evaluation rather than its conclusion.
There is also no single universal breadth-thrust formula that every trader, researcher, or platform uses. Several named breadth-thrust indicators have their own formulas, lookback periods, universes, and thresholds, so it is a mistake to describe one calculation as though it defines every use of the term. For this lesson, the useful question is broader: did participation expand enough, across enough evidence, to make this rebound materially different from an ordinary bounce?
What a Weak or Oversold Bounce Looks Like
A weak bounce can still be fast, dramatic, and profitable for traders who caught it. After a sharp decline, short covering, bargain hunting, reduced selling pressure, or a rebound in heavily weighted stocks can push an index higher without producing broad confirmation underneath. That is why “oversold bounce” should not automatically be translated into “bad bounce.” The move can continue; the point is that its internal evidence may be less convincing than the index candle suggests.
The weaker decision is to see the magnitude of the rebound and immediately label it a healthy market turn. A trader who has just watched several days of selling is naturally sensitive to the first strong upside move, so urgency can replace evaluation very quickly. A cleaner approach follows the principle that the market comes first: first observe the rebound, then examine whether participation and supporting evidence are expanding with it. Price earns attention; breadth helps determine what kind of attention.
Breadth Thrust vs. Weak Bounce
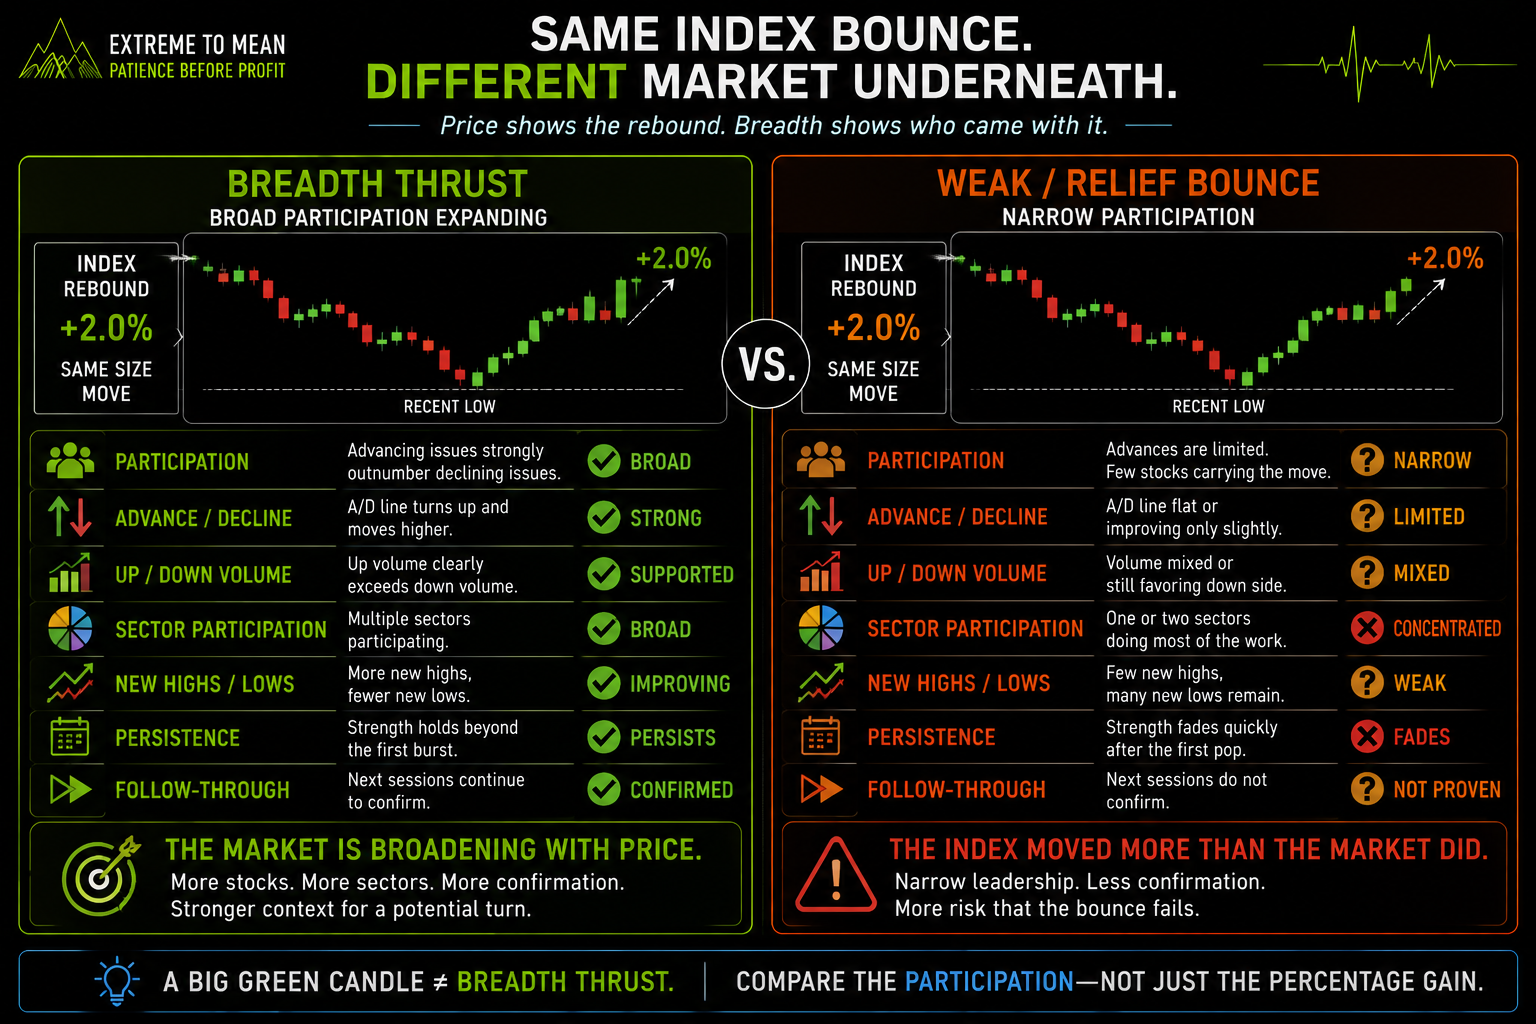
The distinction becomes easier when the two conditions are compared directly. A stronger breadth-thrust environment tends to show the index rising with widespread participation, stronger advancing-versus-declining data, constructive volume beneath the advance, participation across several sectors, and evidence that the improvement survives beyond the first burst. A weaker bounce may show a similar index gain while fewer stocks participate, leadership remains concentrated, volume confirmation is less persuasive, and the improvement fades quickly. Neither description determines what must happen next.
The most useful comparison is therefore not big bounce versus small bounce. It is broadening evidence versus concentrated evidence. A two-percent index rally with expanding participation can communicate something different from an equally large rally driven mainly by a few heavyweight components. The size of the candle measures the surface move; the breadth diagnostic asks how much of the market actually moved with it.
Participation, Advance-Decline Data, and Volume
Start with participation because it answers the simplest question: are advancing stocks meaningfully outnumbering declining stocks, or is the headline index stronger than the average stock underneath it? Advance-decline data gives each issue a voice rather than allowing the largest companies to dominate the interpretation. Nasdaq has illustrated this exact problem: an index can rise while its advance-decline line weakens when fewer stocks are carrying the move. (nasdaq.com) The trader does not need one magical breadth reading; the objective is to see whether participation is expanding in the same direction as price.
Then examine volume. If more stocks are advancing, ask whether trading activity is also supporting those advancing names rather than remaining unusually concentrated on the declining side. Up-volume and down-volume data adds another layer because participation by itself does not show where trading activity is concentrated. The combination is more informative than either observation alone: How many stocks came with the move, and where was the volume flowing while they did?
Sectors, New Highs and Lows, and the Concentration Problem
Sector participation helps determine whether the rebound is spreading through the market or remaining trapped inside one corner of it. A rally led by one powerful sector can still lift a major index, but that is different from financials, industrials, technology, consumer groups, smaller companies, and other areas improving together. New highs and new lows provide another perspective by asking whether more securities are making constructive progress or whether the rebound is occurring while a large part of the market remains structurally weak. These measures are not required to agree perfectly; they are evidence to compare.
This matters because major indexes are not necessarily one-stock-one-vote measurements. The S&P 500, for example, is float-adjusted market-cap weighted, meaning larger companies have greater influence over the index level than smaller constituents. (spglobal.com) A small group of mega-cap stocks can therefore make the headline index look healthier than participation across the full constituent list. The better question is not simply, “Is the index green?” but “How widely is that strength distributed?”
Persistence and Follow-Through Separate the First Burst From the Bigger Story
The first strong session is useful evidence, but persistence tells you whether the improvement survives. A market can produce impressive breadth for a few hours as positioning resets and then lose much of that participation the following session. A stronger case develops when advancing participation remains constructive, sector involvement stays relatively broad, and the market continues behaving in a way consistent with the original improvement. Follow-through does not guarantee continuation; it simply makes the breadth story more complete.
Imagine two hypothetical rebounds in the same index. On Day One, both indexes rise 2 percent, but Market A shows broad advancing participation, strong volume behind advancing stocks, several sectors improving, fewer new lows, and similar strength again the next session; Market B rises the same 2 percent while leadership remains concentrated in several large companies and breadth quickly fades. The headline return is identical, but the evidence underneath the return is not. This is why context comes before the candle: identical-looking price moves can carry different information when their surrounding evidence differs.
What a Breadth Thrust Cannot Tell You
Even a strong breadth thrust does not prove that the market has made a permanent bottom. It does not guarantee a new bull market, eliminate the possibility of a retest, predict tomorrow's session, or turn every long setup into a good trade. A strong breadth reading can improve the evidence surrounding a rebound without removing uncertainty from the trade itself.
The inverse matters too. Weak breadth does not force the market to collapse, and narrow leadership can persist longer than a trader expects because larger constituents have greater influence in capitalization-weighted indexes. (spglobal.com) Breadth disagreement should therefore produce a question rather than a prediction: why is price saying one thing while participation underneath it is saying something weaker? Sometimes the disagreement resolves through broader participation; other times the headline index eventually reflects the weakness underneath it.
A Practical Breadth-Thrust Diagnostic
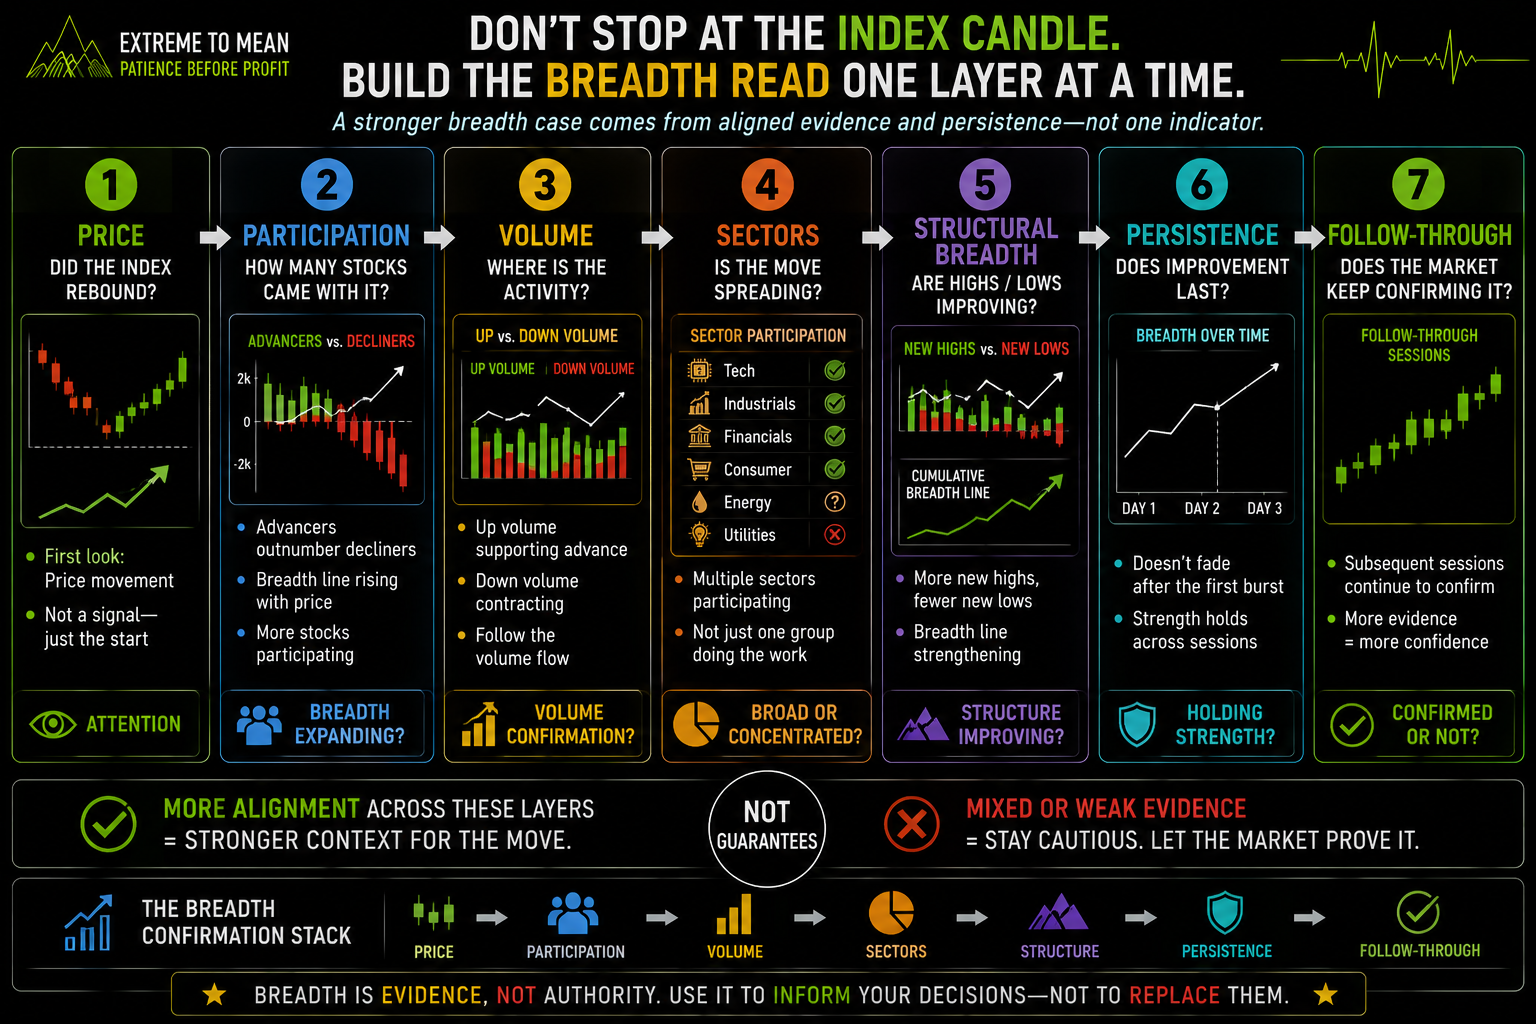
The cleaner process is to stack evidence rather than search for one perfect indicator. That is also why the three market states still matter: a breadth reading should be interpreted inside the broader condition rather than separated from trend, balance, volatility, and structure. If the market has just emerged from a sharp selloff, the trader should expect the first bounce to create excitement and deliberately ask whether participation is strengthening enough to justify a different read. The framework below is designed to slow that reaction into evaluation.
- Participation: Are advancing stocks broadly outnumbering declining stocks, or is the index being carried by a limited group?
- Advance-decline breadth: Is the breadth measure improving with price rather than diverging from it?
- Volume: Is trading activity supporting the advancing side, or does the volume picture remain weaker than the index?
- Sector breadth: Are several areas of the market participating, or is leadership concentrated?
- New highs and new lows: Is underlying structure improving as the bounce develops?
- Persistence: Does the breadth improvement last beyond the first burst?
- Follow-through: Do subsequent sessions continue to support the original breadth read?
- Concentration: Could a handful of large index components be making the headline move look broader than it is?
- Context: Does the breadth evidence make sense inside the current market state and surrounding structure?
- Decision: Am I using breadth to evaluate the environment, or am I treating one reading as automatic permission to trade?
No checklist turns breadth into certainty. Its purpose is to make the trader explain why the rebound looks different beneath the surface rather than allowing one dramatic candle to make the argument by itself. A stronger breadth case develops when several independent pieces point toward broader participation and then persist long enough to survive the first emotional rebound. If those pieces remain mixed, not clear yet is still a useful market read.
Final Thought
The difference between a breadth thrust and a weak market bounce is not simply how far the index rises. A stronger breadth event shows that participation itself is expanding: more stocks are involved, advancing-versus-declining evidence improves, volume supports the move, sectors participate, structural breadth strengthens, and that improvement persists with follow-through. A weaker bounce can still move sharply, but the evidence underneath it remains narrower or less durable. Breadth helps the trader distinguish those conditions without pretending to know what the market must do next.
The important skill is patience between seeing the rebound and deciding what the rebound means. That is where this lesson naturally connects with The Patience Principle: waiting for enough evidence is not passivity when the evidence itself is still developing. Price can earn your attention before breadth earns your confidence, and breadth can strengthen a thesis without becoming a signal. The trader's job remains the same—evaluate first, then decide whether the environment has actually improved enough to matter.
Educational content only. Trading involves substantial risk and is not suitable for everyone.